The cryptocurrency market continued its downturn in the second quarter of 2026, marking three straight quarters of losses. A particularly bad June led to significant drops, bringing the total crypto market value down 12.6% ($304.8 billion) to $2.1 trillion – a level not seen since September 2024 and about 52% lower than its high in October 2025. The biggest price falls happened in June, caused by factors like the Federal Reserve’s stricter policies, unstable relations between the US and Iran, and a Bitcoin sale by Strategy.
Bitcoin (-14.2%) and Ethereum (-25.4%) continued to fall in value even though US stocks rebounded strongly. Overall, the past quarter saw crypto move away from typical market trends, with larger cryptocurrencies struggling while some smaller, more speculative altcoins – particularly Hyperliquid’s HYPE – saw a surge in demand thanks to new investment products, prediction markets, and a deal with Coinbase that propelled it into the top 10 coins.
The CoinGecko Q2 2026 Crypto Industry Report provides a complete overview of the cryptocurrency world. It examines the overall market, analyzes Bitcoin and Ethereum, explores the DeFi space in detail, and reviews the performance of both centralized (CEX) and decentralized (DEX) exchanges.
Key Takeaways
- Total Crypto Market Cap Fell -12.6% in 2026 Q2, Ending June at $2.1T.
- Stablecoin Market Cap Slipped -1.6% to $305.1B, a First Since 2023 Q3.
- Notional Volume on Prediction Markets Grew +48.7% QoQ, Totaling $113.8B in 2026 Q2.
- Collector Crypt Monopolized the Tokenized Collectibles Space With a 62.8% Share in June 2026.
- Spot Trading Volume on Centralized Exchanges Fell -27.9% in 2026 Q2 to $1.95T, with May Hitting a New Monthly Low of $0.62T.
- Perps Trading Volume on Centralized Exchanges Fell -10.0% From $14.1T in Q1 to $12.7T in Q2.
1. Total Crypto Market Cap Fell -12.6% in 2026 Q2, Ending June at $2.1T
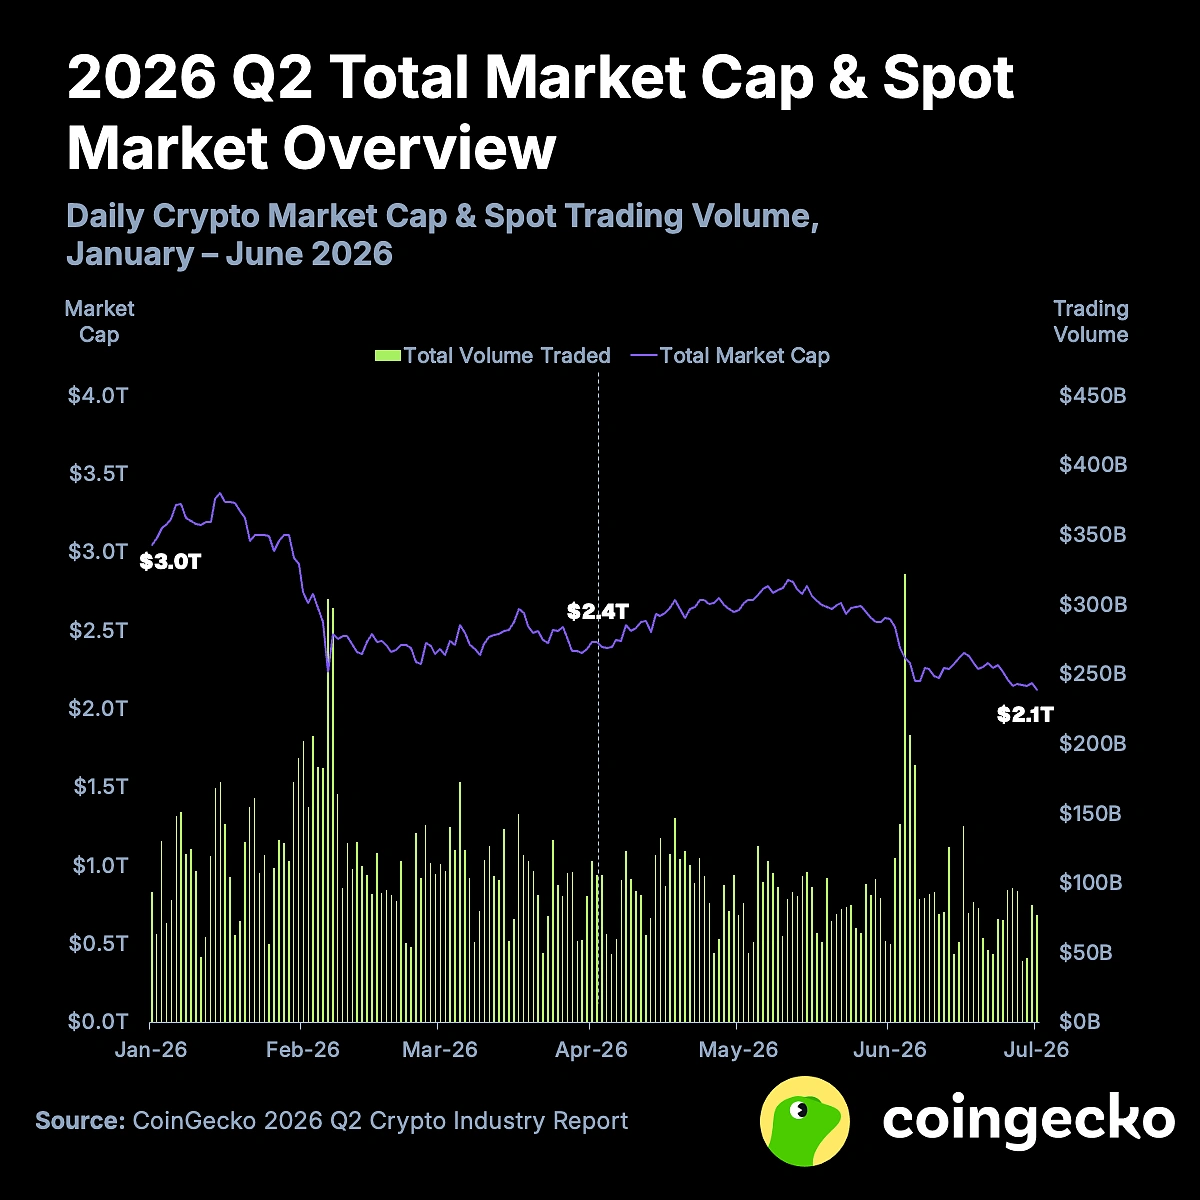
The overall value of the cryptocurrency market decreased by 12.6% in the second quarter of 2026, dropping from $2.4 trillion to $2.1 trillion. While the first quarter saw an initial rush of selling, the market started Q2 more steadily, with April performing particularly well before prices began to fall again. This decline was also reflected in stablecoins, which saw their total value decrease – something that hadn’t happened since the third quarter of 2023 – indicating that investors were pulling money out of the crypto market.
The biggest price drop of the quarter happened in June, influenced by several factors: investors pulling money out of ETFs, the Federal Reserve signaling it would keep interest rates high, uncertain relations between the US and Iran, and a notable Bitcoin sale. By the end of June, the total market value was about 52% lower than its high point in October 2025.
Trading slowed down considerably for the second quarter in a row. The average daily volume dropped to $93.1 billion, which is a 20.9% decrease compared to the previous quarter.
2. Stablecoin Market Cap Slipped -1.6% to $305.1B, a First Since 2023 Q3

The stablecoin market shrank by $4.8 billion (1.6%) in the second quarter of 2026, finishing the quarter at $305.1 billion. This was a shift from the slight growth seen in the first quarter, but the decrease was relatively small compared to the overall market decline.
USDC, issued by Circle, experienced a significant outflow of $3.7 billion, a nearly 5% decrease, bringing its total to $73.5 billion. Meanwhile, Tether’s USDT remained relatively stable at $184.4 billion, bouncing back from losses in the first quarter and increasing its dominance in the market to 60%.
Sky’s USDS and Ethena’s USDe both saw significant declines in value this quarter. Sky’s USDS dropped by 16.4% (or $2.0 billion) to reach $10.0 billion, while Ethena’s USDe fell by 24.4% (or $1.4 billion) to $4.4 billion. This decrease was mainly because the returns on these assets went below typical risk-free rates, leading users to withdraw their staked funds.
WLFI’s USD1 revenue increased by 5.5% (an additional $0.2 billion), but the growth was slower than in the first quarter. The ‘Others’ category also saw a small increase of 6.2% ($1.7 billion).
3. Notional Volume on Prediction Markets Grew +46.0% QoQ, Totaling $111.7B in 2026 Q2

Prediction market activity reached $113.8 billion in the second quarter of 2026, up 48.7% compared to the previous quarter. In June alone, trading volume hit $52.8 billion – a 91.9% increase from the average monthly volume over the prior five months ($27.5 billion), and an all-time record. This surge was driven by several major sporting events happening at once, including the UEFA Champions League Final, Stanley Cup Finals, NBA Finals, FIFA World Cup, and Wimbledon.
Polymarket is seeing a surge in sports-related contracts, with 81% of trading volume in June focused on sports compared to 40% in January. Kalshi is becoming the dominant player in this market, increasing its share from 42.4% in the first quarter to 58.9% in the second. Over the same period, Polymarket’s market share decreased slightly, from 35.8% to 30.2%.
Rothera, a new trading firm created by Robinhood and Susquehanna International Group (SIG) in May, quickly became one of the top players, reaching fourth place in June with $2.1 billion in trades.
4. Collector Crypt Monopolized The Tokenized Collectibles Space With a 62.8% Share in June 2026
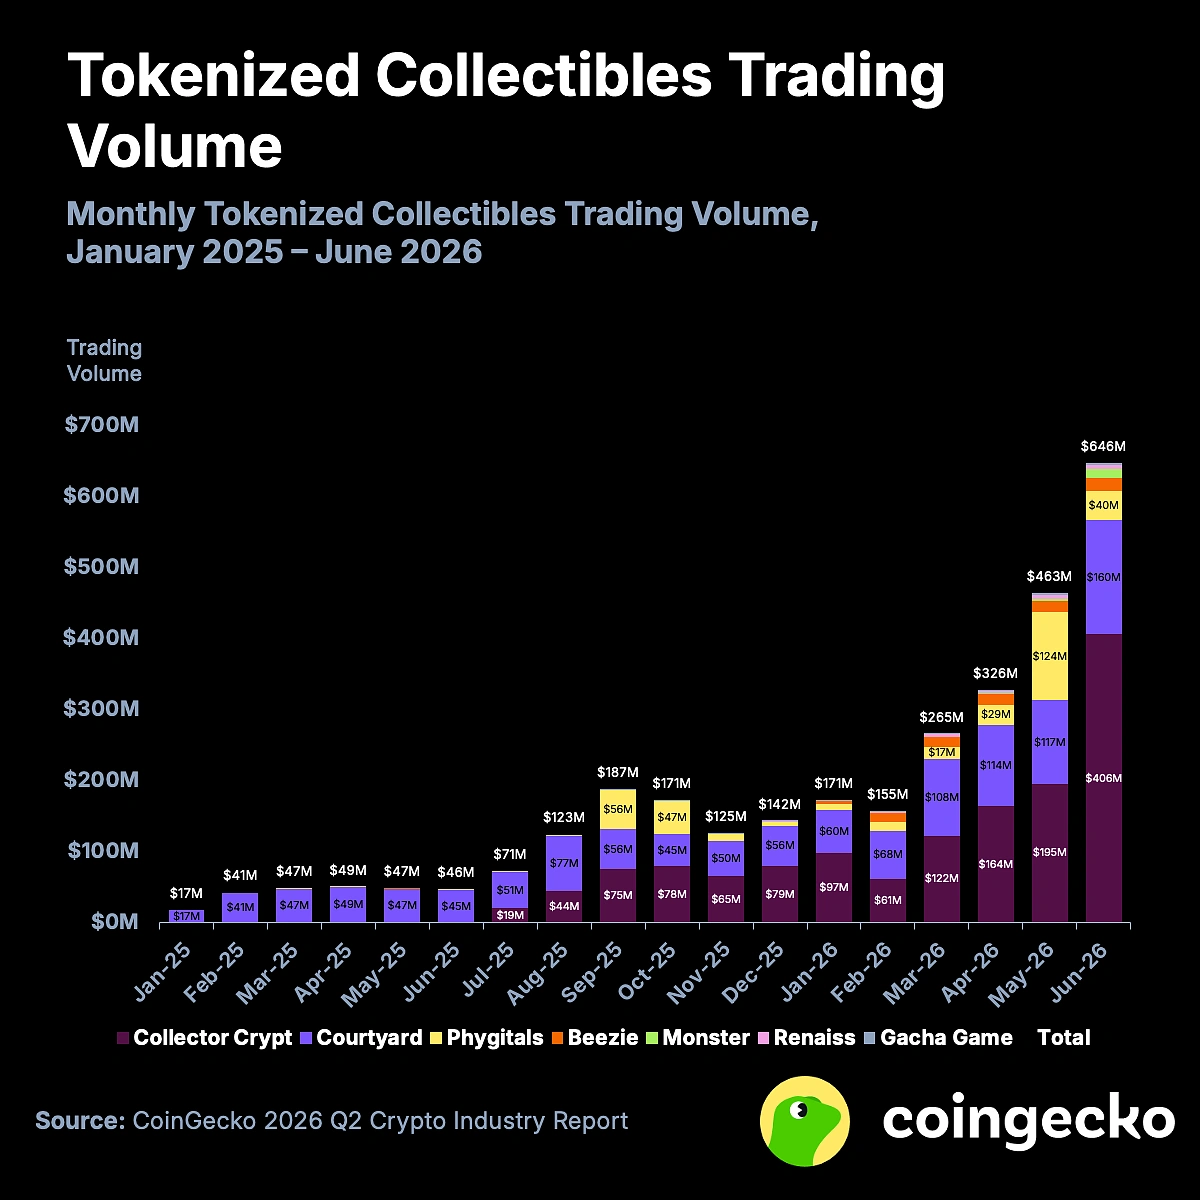
As a researcher tracking the tokenized trading card game (TCG) market, I’ve observed a significant shift in platform dominance. Courtyard was the clear leader in the first half of 2025, but Collector Crypt has now taken the top spot in 2026. We’ve seen a remarkable 317% increase in their monthly trading volume, jumping from $97 million in January to $406 million by June. This growth has given Collector Crypt a commanding lead, capturing 62.8% of the total market share by June 2026.
However, OpenSea only saw $32.7 million in NFT sales during June 2026, meaning Collector Crypt, Courtyard, and Phygitals were the leading NFT marketplaces at that time.
Most popular NFT platforms don’t make money from users reselling NFTs to each other. Instead, the vast majority – over 98% – of their revenue comes from a system called ‘gacha.’ This works like a digital lottery where users buy mystery boxes containing NFTs of varying rarity, hoping to win valuable cards.
5. Spot Trading Volume on Centralized Exchanges Fell -27.9% in 2026 Q2 to $1.95T, with May Hitting a New Monthly Low of $0.6T

During the second quarter of 2026, the ten largest centralized cryptocurrency exchanges saw $1.95 trillion in trading volume. This represents a significant drop of 27.9% compared to the $2.70 trillion traded in the first quarter of 2026.
Trading volume dropped to $619.0 billion in May, the lowest point for the month. It then slightly increased in June, reaching $695.0 billion.
Even though the cryptocurrency market struggled during the second quarter of the year, Binance remained the leading exchange, controlling 38.7% of trading volume. Bybit was the only other exchange with a significant share—reaching 10.0% and surpassing MEXC in popularity.
Trading volume decreased across most exchanges, but the extent of the drops varied widely – from a 5% decrease to as much as 56%. MEXC experienced the largest decline, with its volume falling by more than half from $275.2 billion to $121.2 billion, causing it to drop in ranking from second place to seventh. Crypto.com and KuCoin also saw substantial decreases, losing 40.9% and 38.5% of their volume respectively.
6. Perps Trading Volume on Centralized Exchanges Fell -10.0% From $14.1T in Q1 to $12.7T in Q2
As a crypto investor, I’ve been watching the numbers closely, and it looks like trading volume on the top 10 centralized exchanges decreased a bit in the second quarter of 2026 – we saw around $12.7 trillion traded, which is down about 10% from the $14.1 trillion in the first quarter. However, even with that dip, monthly volumes have stayed strong, consistently above $4 trillion. That’s still a pretty healthy level and better than what we were seeing for most of 2024.
Trading activity in perpetual futures (perps) fell less sharply compared to spot trading this quarter (-10.0% vs -39.1%). This suggests traders are increasingly favoring perps for speculative trading, and growing interest in real-world asset (RWA) perps is also contributing to sustained engagement.
Trading activity suggested the market was likely to weaken further. Even though prices went up in May, trading volume fell to its lowest point of the year. Conversely, when Bitcoin’s price dropped below $60,000 in May, trading volume increased.
The leading ten cryptocurrency perpetual futures exchanges maintained fairly stable market shares overall. While MEXC saw a temporary increase in trading volume during April and early May, this advantage diminished by June.
- Editor’s note: The data points to a market contracting from the inside out, not just repricing. A third straight quarterly decline is one thing; a stablecoin drawdown alongside it – the first since Q3 2023 – is another, since it could be giving a signal that capital is leaving the industry rather than rotating within it. Falling spot volumes and a widening gap between struggling majors and outperformers like Hyperliquid’s HYPE reinforce that read.
This article is meant for educational use only and shouldn’t be considered financial, investment, or trading advice.
2026-07-23 10:12