Ah, Bitcoin, that digital chimera, once again teases the masses with its dance around the $75,000 mark. The pundits, those modern-day soothsayers, are as divided as ever, their voices a cacophony of conflicting prophecies. While some declare the bottom has been plumbed, others foresee further descent into the abyss. Yet, amidst this intellectual brawl, a quieter narrative unfolds, one that the majority, in their myopic fervor, overlook.
The sages at CryptoQuant, those meticulous observers of the digital ledger, have unearthed a curious phenomenon. Since March, the flow of Bitcoin into the labyrinthine world of futures exchanges has intensified, mirroring the pattern observed in the wake of the FTX debacle in December 2022. A structural echo, not of price or sentiment, but of capital’s clandestine movements through the veins of the exchange infrastructure.
This is no mere coincidence, no random flutter in the digital breeze. It is a behavioral match, a structural reprise of the moment when the last bear market exhaled its final breath and the next cycle, like a phoenix, began to stir. The pattern, once dormant, has reawakened. The question lingers: what does it portend?
The analysts, ever the divided chorus, offer their interpretations. Some, fixated on the price chart, predict a plunge below $60,000, while others, scanning the macro horizon, foresee a slow, laborious recovery. Yet, neither faction heeds the whispers of the futures flow data, which speaks of a market structure beginning to resemble its former self, at a juncture that, in hindsight, proved pivotal.
The Pattern Is Present. The Confirmation Is Not Yet
The CryptoQuant oracles, with due caution, interpret this development. The surge in Bitcoin flows into futures exchanges, rather than spot exchanges, signals a return of leveraged positioning. Traders, it seems, are not content merely to hold; they are wagering, using Bitcoin as collateral for their directional bets. A behavioral signature, indeed, of those who believe a sustained move is nigh and seek amplified exposure to its whims.
This behavior, manifesting at this price level and stage of the cycle, carries a historical weight. The last time this pattern emerged-following the FTX collapse, at what proved to be the cycle’s nadir-it heralded the dawn of a new cycle, not the prolongation of the bear’s reign. The analysts’ verdict is clear: the bear market may be drawing its final breaths.
That “may,” a small word, carries a heavy burden. Bitcoin, after weeks of consolidation, remains directionless, and the market has yet to produce the price confirmation that would transform this structural signal into a declared trend reversal. The futures flow pattern reveals what participants are doing, but it does not yet foretell where the price will go.
Two conditions coexist in this digital arena: a structural behavioral signal that historically preceded cycle recoveries, and a price chart that remains undecided. This gap-between what the on-chain data suggests and what the price confirms-is the very chasm in which the market has dwelled for weeks. The resolution of this gap is the move toward which the market consolidates.
Bitcoin Tests Resistance as Recovery Attempts Strengthen
Bitcoin, ever the resilient contender, pushes toward the $74,000-$75,000 region, testing a key resistance zone after rebounding from the sharp February breakdown. The chart reveals a clear transition from capitulation to consolidation, followed by a gradual ascent of higher lows. This structure hints that buyers are regaining the upper hand in the short term.

Yet, the broader trend remains unresolved. Bitcoin still trades below the 100-day (green) and 200-day (red) moving averages, both trending downward, reinforcing the presence of overhead resistance. The 50-day moving average (blue), however, has begun to turn upward, acting as dynamic support and signaling improving short-term momentum.
Volume dynamics offer crucial context. The spike during the February sell-off reflects forced liquidations, while the subsequent normalization suggests the market has stabilized but lacks strong conviction. The recent push higher has not been accompanied by a significant increase in volume, raising questions about the strength of the move.
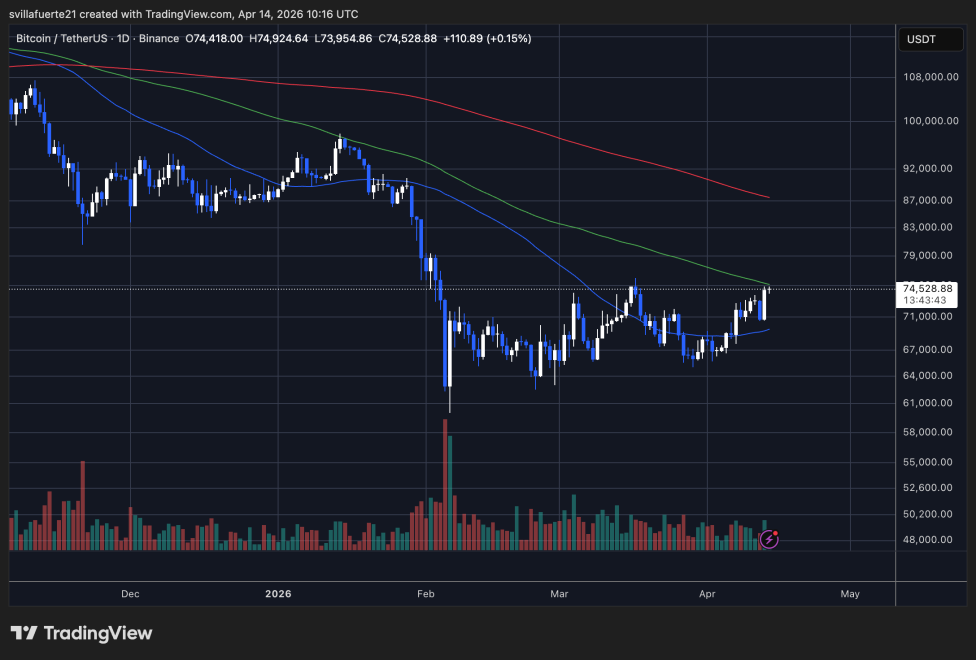
Structurally, Bitcoin stands at a crossroads. A confirmed break above $75,000 would likely shift momentum and open the path toward the $80,000-$85,000 range. Failure to break higher could result in another rejection and a return to the $68,000-$70,000 support zone. The market, ever fickle, awaits its next move with bated breath.
2026-04-15 00:42