A drop to 83 cents could be the setup XRP investors have been waiting for.
According to crypto analyst Egrag Crypto, XRP has been forming a falling wedge pattern on its price chart for almost nine months. Currently, the token is trading around $1.30 after a significant price decrease.
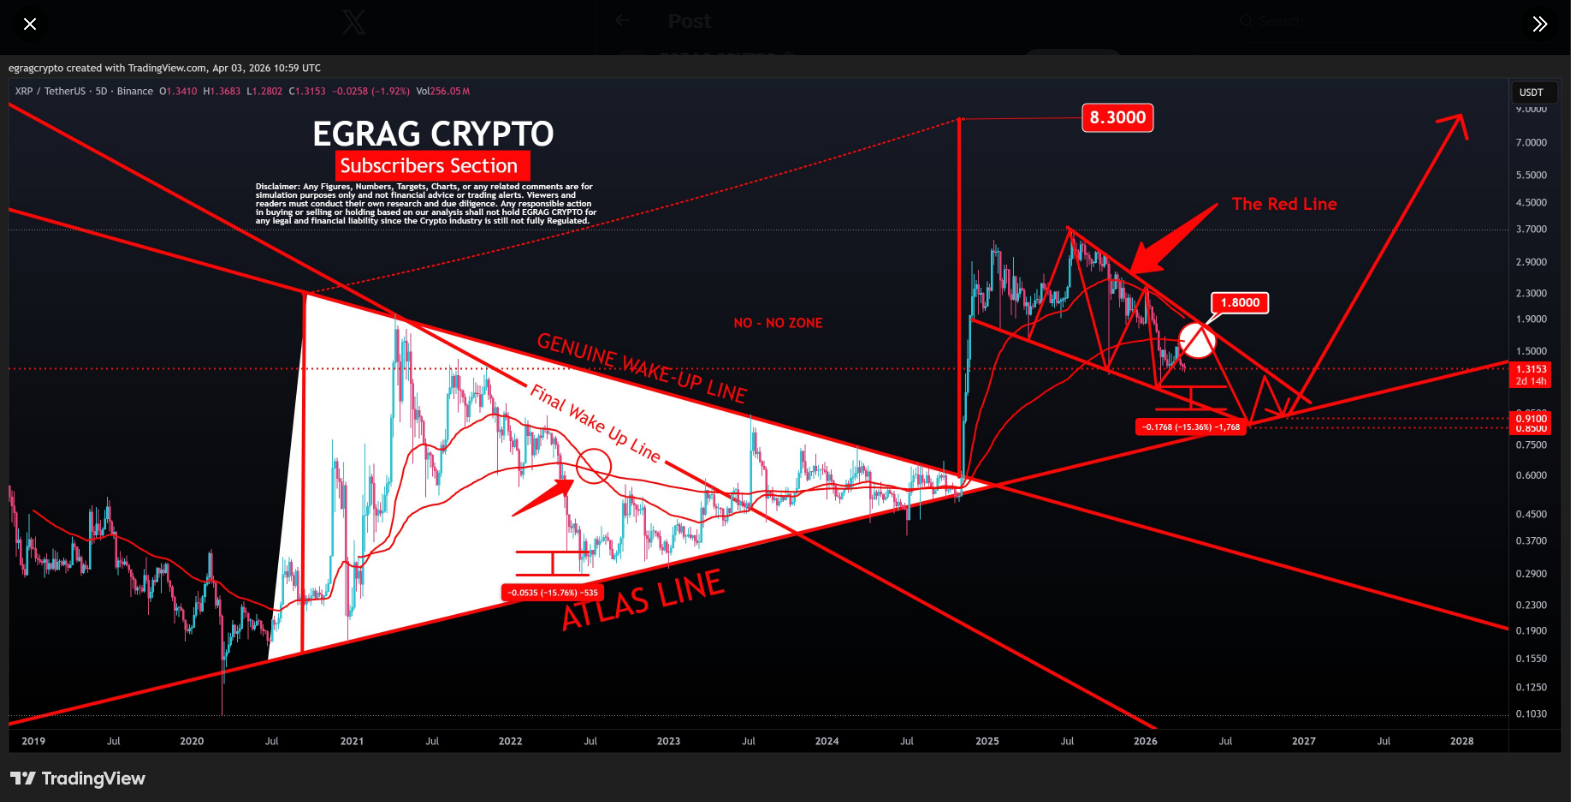
Looking at things, XRP might drop a bit more before it really bounces back. But once it hits that low point, I think it could really take off – potentially all the way up to $8.30. I’m watching for that bottom as a possible entry point.
Six Painful Months
XRP has been losing value for six months in a row, which is its longest losing streak since 2014. So far in April, the price is down 1.80%, and if this continues, it will mark seven consecutive months of losses – something XRP has never experienced before.
In July 2025, the token reached its highest price of $3.60. Since then, its price has been moving within a narrowing range, bouncing between an upper resistance level and a lower support level. This consistent pattern of price reversals – going up until it hits the resistance, then down until it hits the support – creates a wedge pattern.
#XRP – The RED Chart :
It’s red… but it’s offering one of the best buying opportunities and upside potential for #XRP.
Breaking above $1.80 would suggest the falling wedge pattern is no longer valid. A crossover of the two red lines indicates a bearish trend.
Otherwise:
Bottom target: crystal clear →…— EGRAG CRYPTO (@egragcrypto) April 3, 2026
Two Key Price Levels Are Driving The Outlook
According to Egrag’s analysis, XRP could initially rise to around $1.80, but this level has historically proven difficult to break through. The price previously tried to recover past $1.80 – most recently in early January 2026 when it reached $2.41 before falling back down. If XRP encounters similar resistance at $1.80 again, it could lead to another price decrease.
Based on current projections, the price is expected to reach around 83 cents, where a key support level intersects with a long-term upward trend identified by the analyst as the ‘Atlas Line’.

This price point is considered a key level for XRP right now. Based on current data, XRP could rise back above $1.00, briefly fall to around 91 cents to confirm its support level, and then potentially start a more significant upward trend.
If that sequence plays out, the breakout target lands at $8.30.
XRP has experienced noticeable price fluctuations recently. For example, during a market downturn on October 10, 2025, its price dropped from $2.80 to $1.36, hitting a key support level before recovering. It faced another dip in early February 2026, falling to $1.11, but again bounced back from that same support level.
Breakout Conditions Depend On Two Clear Boundaries
While things look positive, there are limits to how high prices might go. Egrag’s analysis shows that if the price rises above $1.80, it would invalidate the current trading pattern and suggest a different outcome.
If the price falls below 83 to 91 cents, it suggests a likely further decrease, potentially more significant than currently expected.
Read More
- ‘Project Hail Mary’s Unexpected Post-Credits Scene Is Worth Sticking Around
- Beyond Accuracy: Gauging Trust in Human-AI Teams
- The most surprising Hannah Montana cameos: From John Cena to Dwayne Johnson and even a Coronation Street soap star as show celebrates its 20th anniversary
- Limbus Company 2026 Roadmap Revealed
- The Division Resurgence Specializations Guide: Best Specialization for Beginners
- Clash of Clans April 2026 Gold Pass Season introduces a Archer Queen skin
- Total Football free codes and how to redeem them (March 2026)
- After THAT A Woman of Substance cliffhanger, here’s what will happen in a second season
- Gold Rate Forecast
- Brawl Stars Sands of Time Brawl Pass brings Sandstalker Lily and Sultan Cordelius sets, along with chromas and more
2026-04-04 23:11