Oh, look! Chainlink (LINK) is having a little identity crisis at $9.50, trapped in a symmetrical triangle since February. Will it break out to $12 or plummet to $6.80? Spoiler: institutions are watching, and they’re not here for the snacks.
This triangle has been marinating for 70-80% of its life, and let’s not forget the weekly accumulation setup that’s basically saying, “I’m here for a good time, not a long time.” Oh, and Swiss and Spanish equities are now onchain because why not? Europe’s like, “We’re cool now, right?”
Weekly Chart: Déjà Vu from 2018, But Make It Fashion
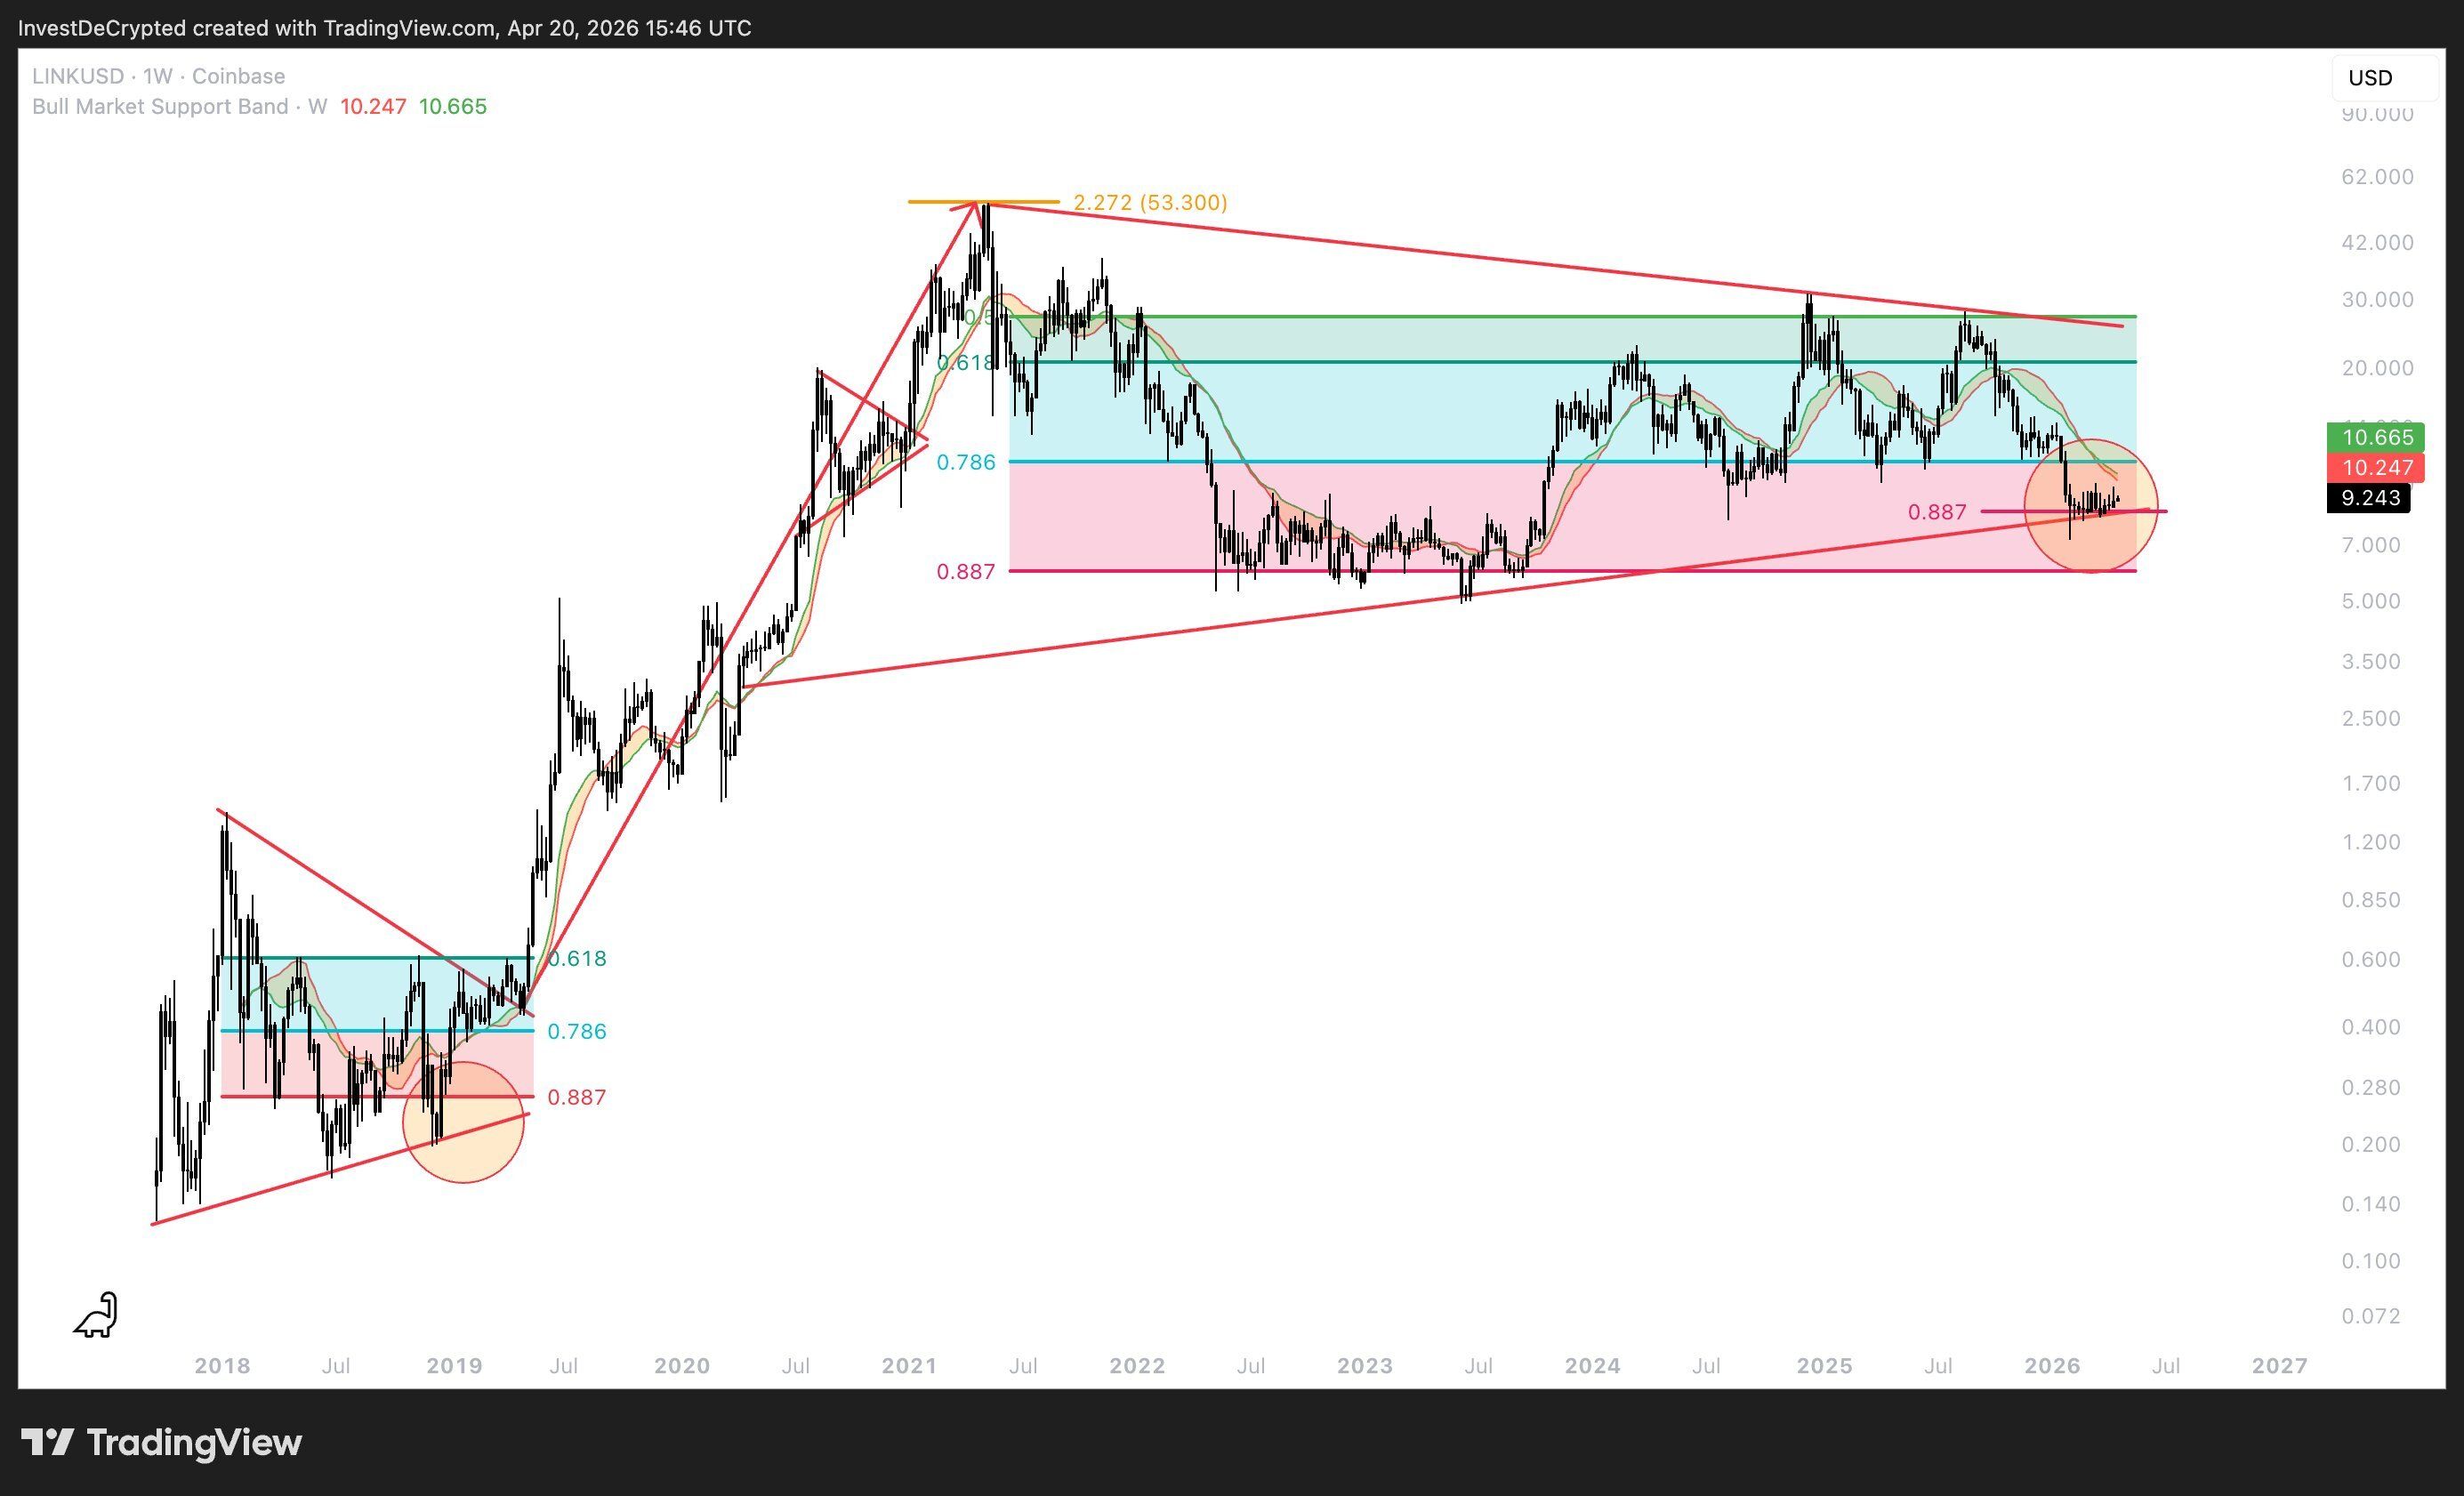
On the weekly chart, LINK is chilling at $9.24, flirting with the Bull Market Support Band like it’s a Tinder match. The band’s all like, “Catch me if you can” between $10.25 and $10.67.
InvestDeCrypted (great name, by the way) is drawing Fibonacci lines like it’s a modern art project. The current zone? Aligned with the 0.887 level, which is basically the crypto equivalent of “hitting rock bottom before the glow-up.”
And guess what? This setup is giving major 2018 vibes. Remember when LINK bottomed near the 0.887 retracement and then went full Beyoncé to $53? History, darling, has a sense of humor.
Multi-year trendlines are now in a symmetrical triangle, and volume is drier than my wit. The apex is near, so buckle up-this is about to get spicy.
Swiss & Spanish Equities: The New Cool Kids on the Blockchain
On April 16, SIX Group and Chainlink decided to throw a party and invite equities data onchain. Yes, you heard that right. Swiss and Spanish stocks are now blockchain-official, with a combined market value of over €2 trillion. Casual.
This means institutions can publish regulated data without breaking a sweat. Tokenized indices? Check. Structured products? Check. Compliant DeFi? Double check. It’s like financial plumbing, but make it chic.
Oh, and OpenAssets is teaming up with Chainlink because why not add more regulated flow to the mix? It’s like a crypto potluck, and everyone’s bringing their A-game.
LINK Price: $12 or $6.80? Place Your Bets, Folks!
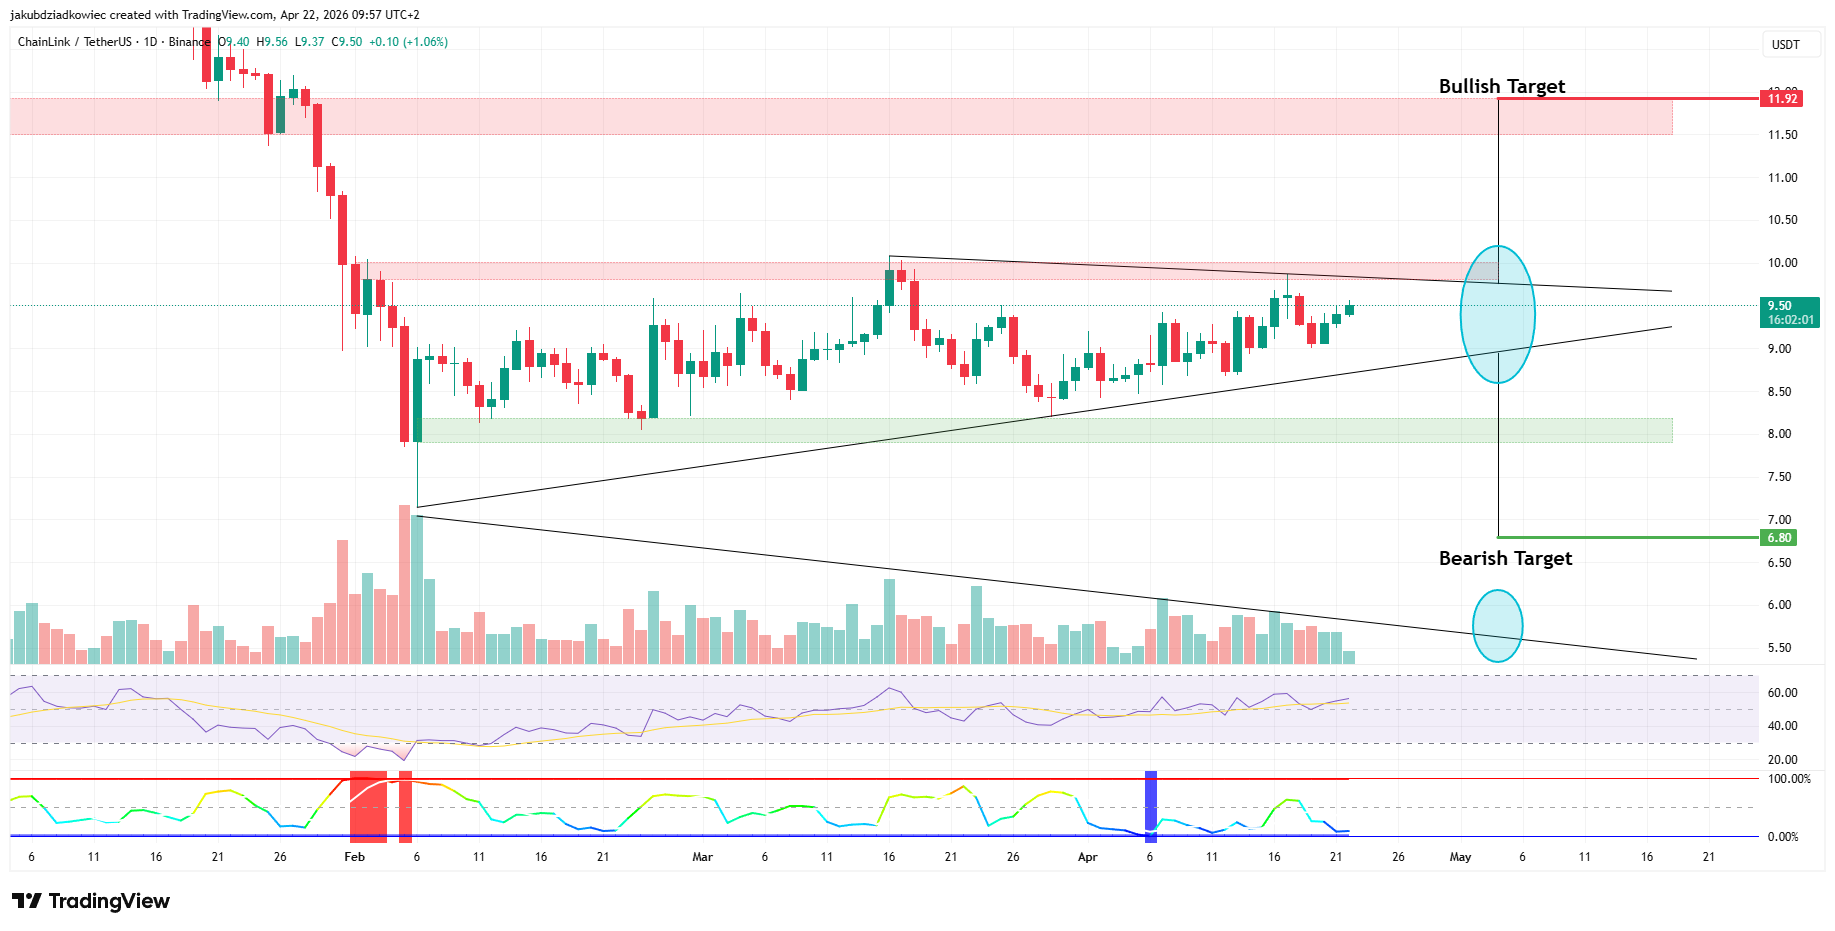
The daily chart is serving symmetrical triangle realness, with support at $8 and resistance at $10. LINK’s market cap? A cool $6.8 billion. No biggie.
The pattern’s 70-80% mature, and Bollinger Bands are like, “Low volatility? We love to see it.” Volume? Down. RSI? Neutral, but with a wink.
Break higher? Hello, $12. Break lower? Bye, $6.80. It’s a choose-your-own-adventure, but with more financial stakes.
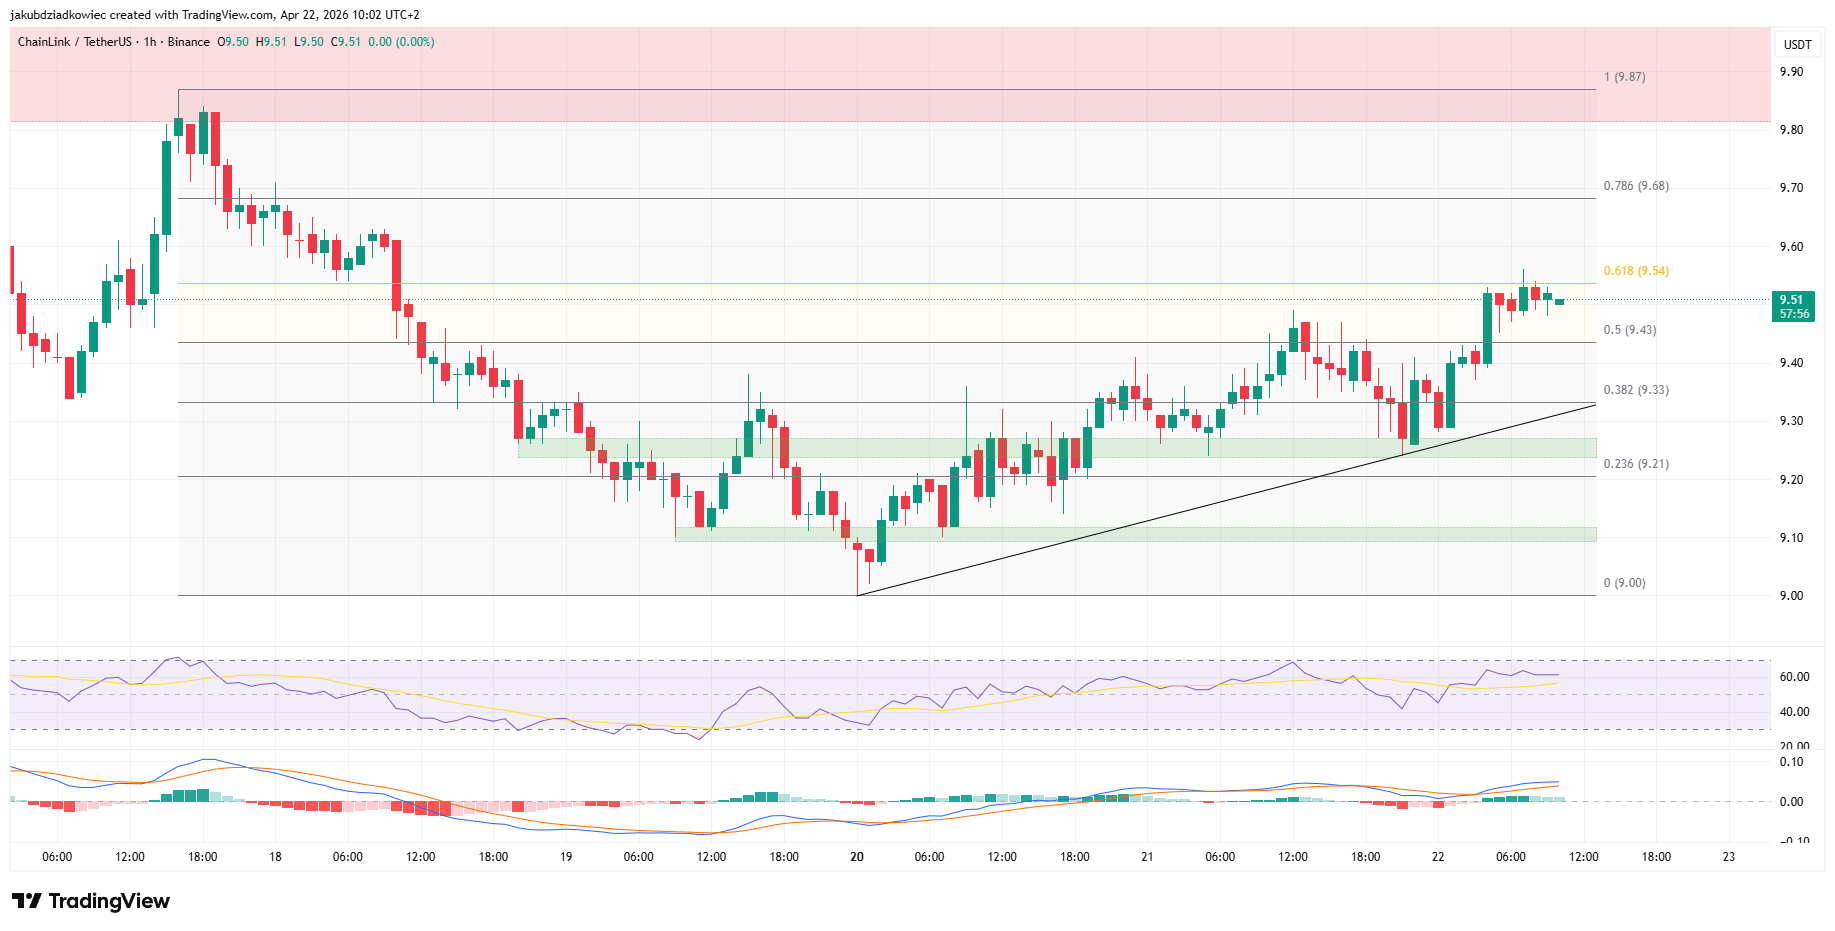
On the 1-hour chart, LINK’s at $9.51, flirting with $9.54 like it’s a first date. Support’s at $9.33, and there’s a rising trendline from April 20 that’s basically saying, “I’ve got you.”
Break above $9.68? $10, here we come. But RSI’s like, “Pump the brakes, darling.” It’s a drama, I love it.
So, will LINK confirm the accumulation thesis above $10 or reject it below $8? The SIX and BME integration is the plot twist we didn’t know we needed. Stay tuned, because this is better than a soap opera.
Read More
- Total Football free codes and how to redeem them (March 2026)
- Clash of Clans May 2026: List of Weekly Events, Challenges, and Rewards
- Farming Simulator 26 arrives May 19, 2026 with immersive farming and new challenges on mobile and Switch
- Last Furry: Survival redeem codes and how to use them (April 2026)
- Pixel Brave: Idle RPG redeem codes and how to use them (May 2026)
- Gold Rate Forecast
- Honor of Kings x Attack on Titan Collab Skins: All Skins, Price, and Availability
- Nekopara Sekai Connect Neko Tier List
- Brent Oil Forecast
- Zenless Zone Zero version 2.8 ‘New: Eridan Sunset’ update will release on May 6, 2026
2026-04-22 15:22