Bitcoin is meandering around the $67,000 neighbourhood, having poked its head on both sides of a snug intraday squeeze. The charts suggest we’re at a crossroads, not a rocket launch, and the indicators-momentum gauges and moving averages-read more like a cautious librarian demanding a stamp of approval than a daredevil sprint to the moon.
Bitcoin Chart Outlook
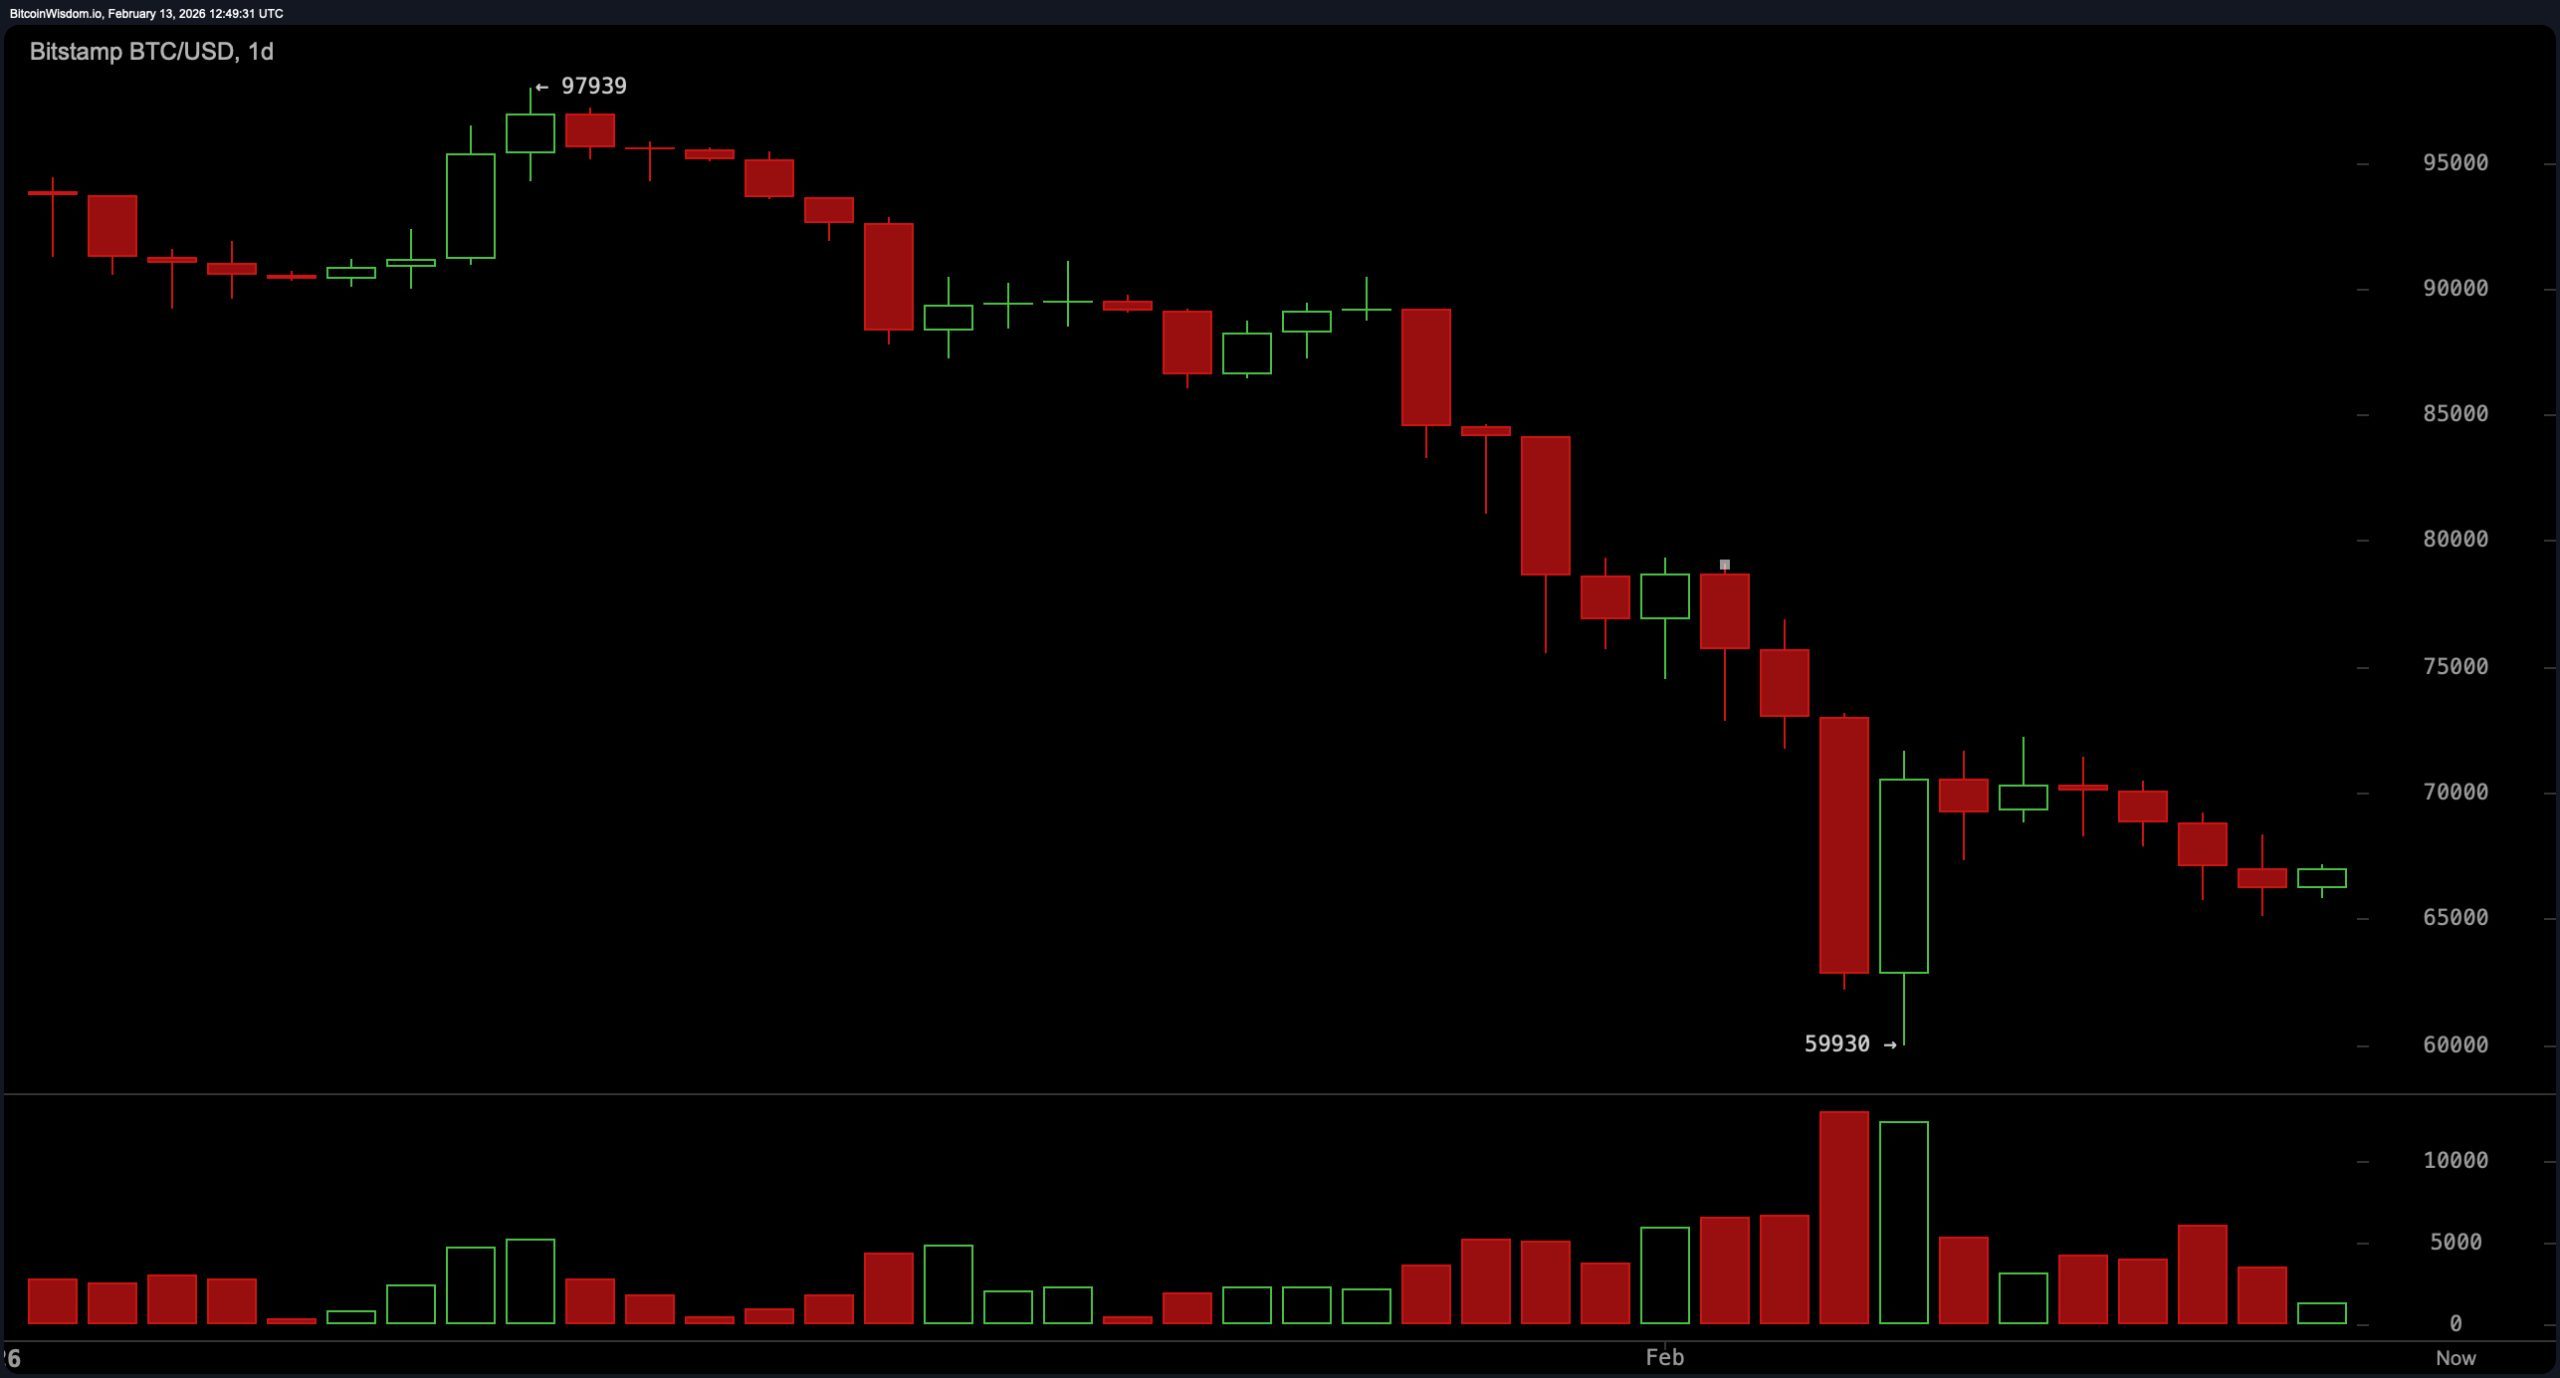
The daily chart reads like a long, steady descent rather than a heroic ascent, with a clear pattern of lower highs and lower lows since the $97,900 peak, followed by a capitulation-style plunge toward roughly $59,900 on heavy volume. Price is now cozied up in the $66,000 to $67,000 zone, a little relief bounce perched atop a still-fragile framework. Key support lurks at $59,900 to $60,000, with intermediate support at $64,000 to $65,000. Resistance sits between $70,000 and $72,000, while a daily close above $75,000 would be the sort of dramatic pivot that market technicians start polishing their spectacles for. Until then, the bias remains neutral-to-bearish unless $72,000 is convincingly reclaimed.
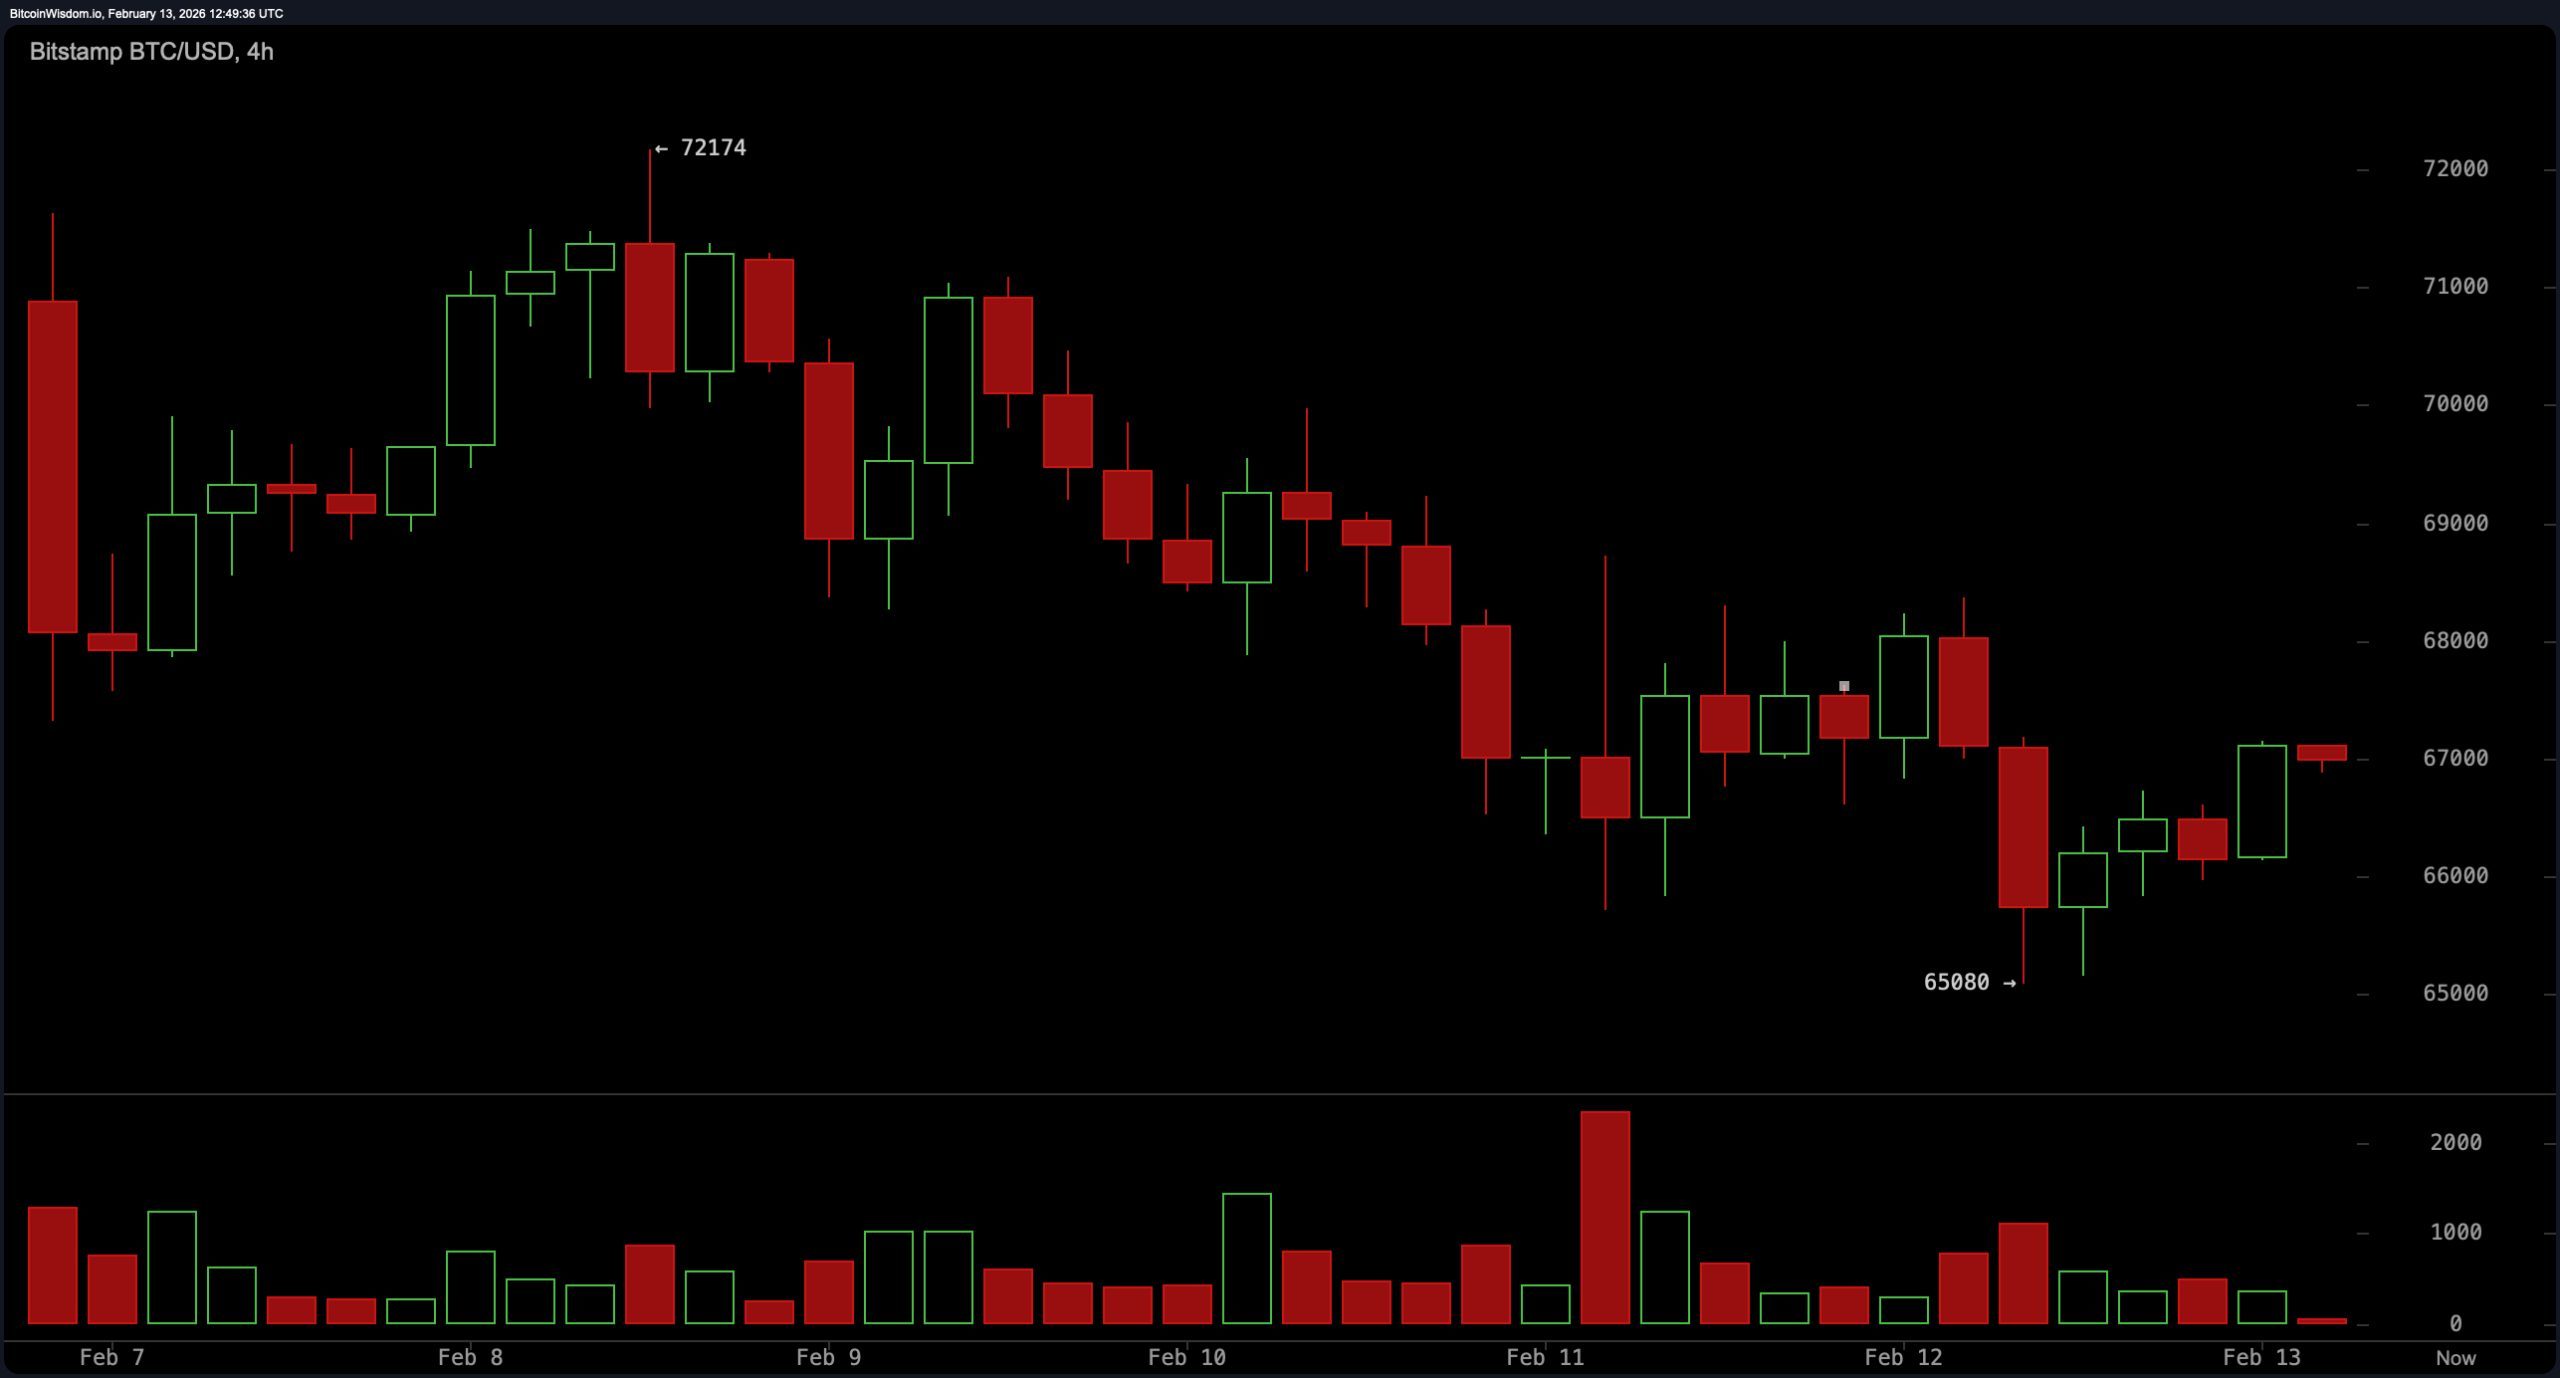
On the four-hour chart, bitcoin has carved out a local bottom near $65,080 and is forming short-term higher lows, trying to grunt its way toward $68,000 to $69,000. Volume, however, lacks impulsive conviction, suggesting the advance is more about a polite wobble than a thunderous breakout.
A four-hour close below $65,000 would invalidate the current recovery attempt, while rejection in the $69,000 to $70,000 region could reinforce overhead supply. In other words, the market is climbing a hill, but it has yet to prove it packed enough oxygen.
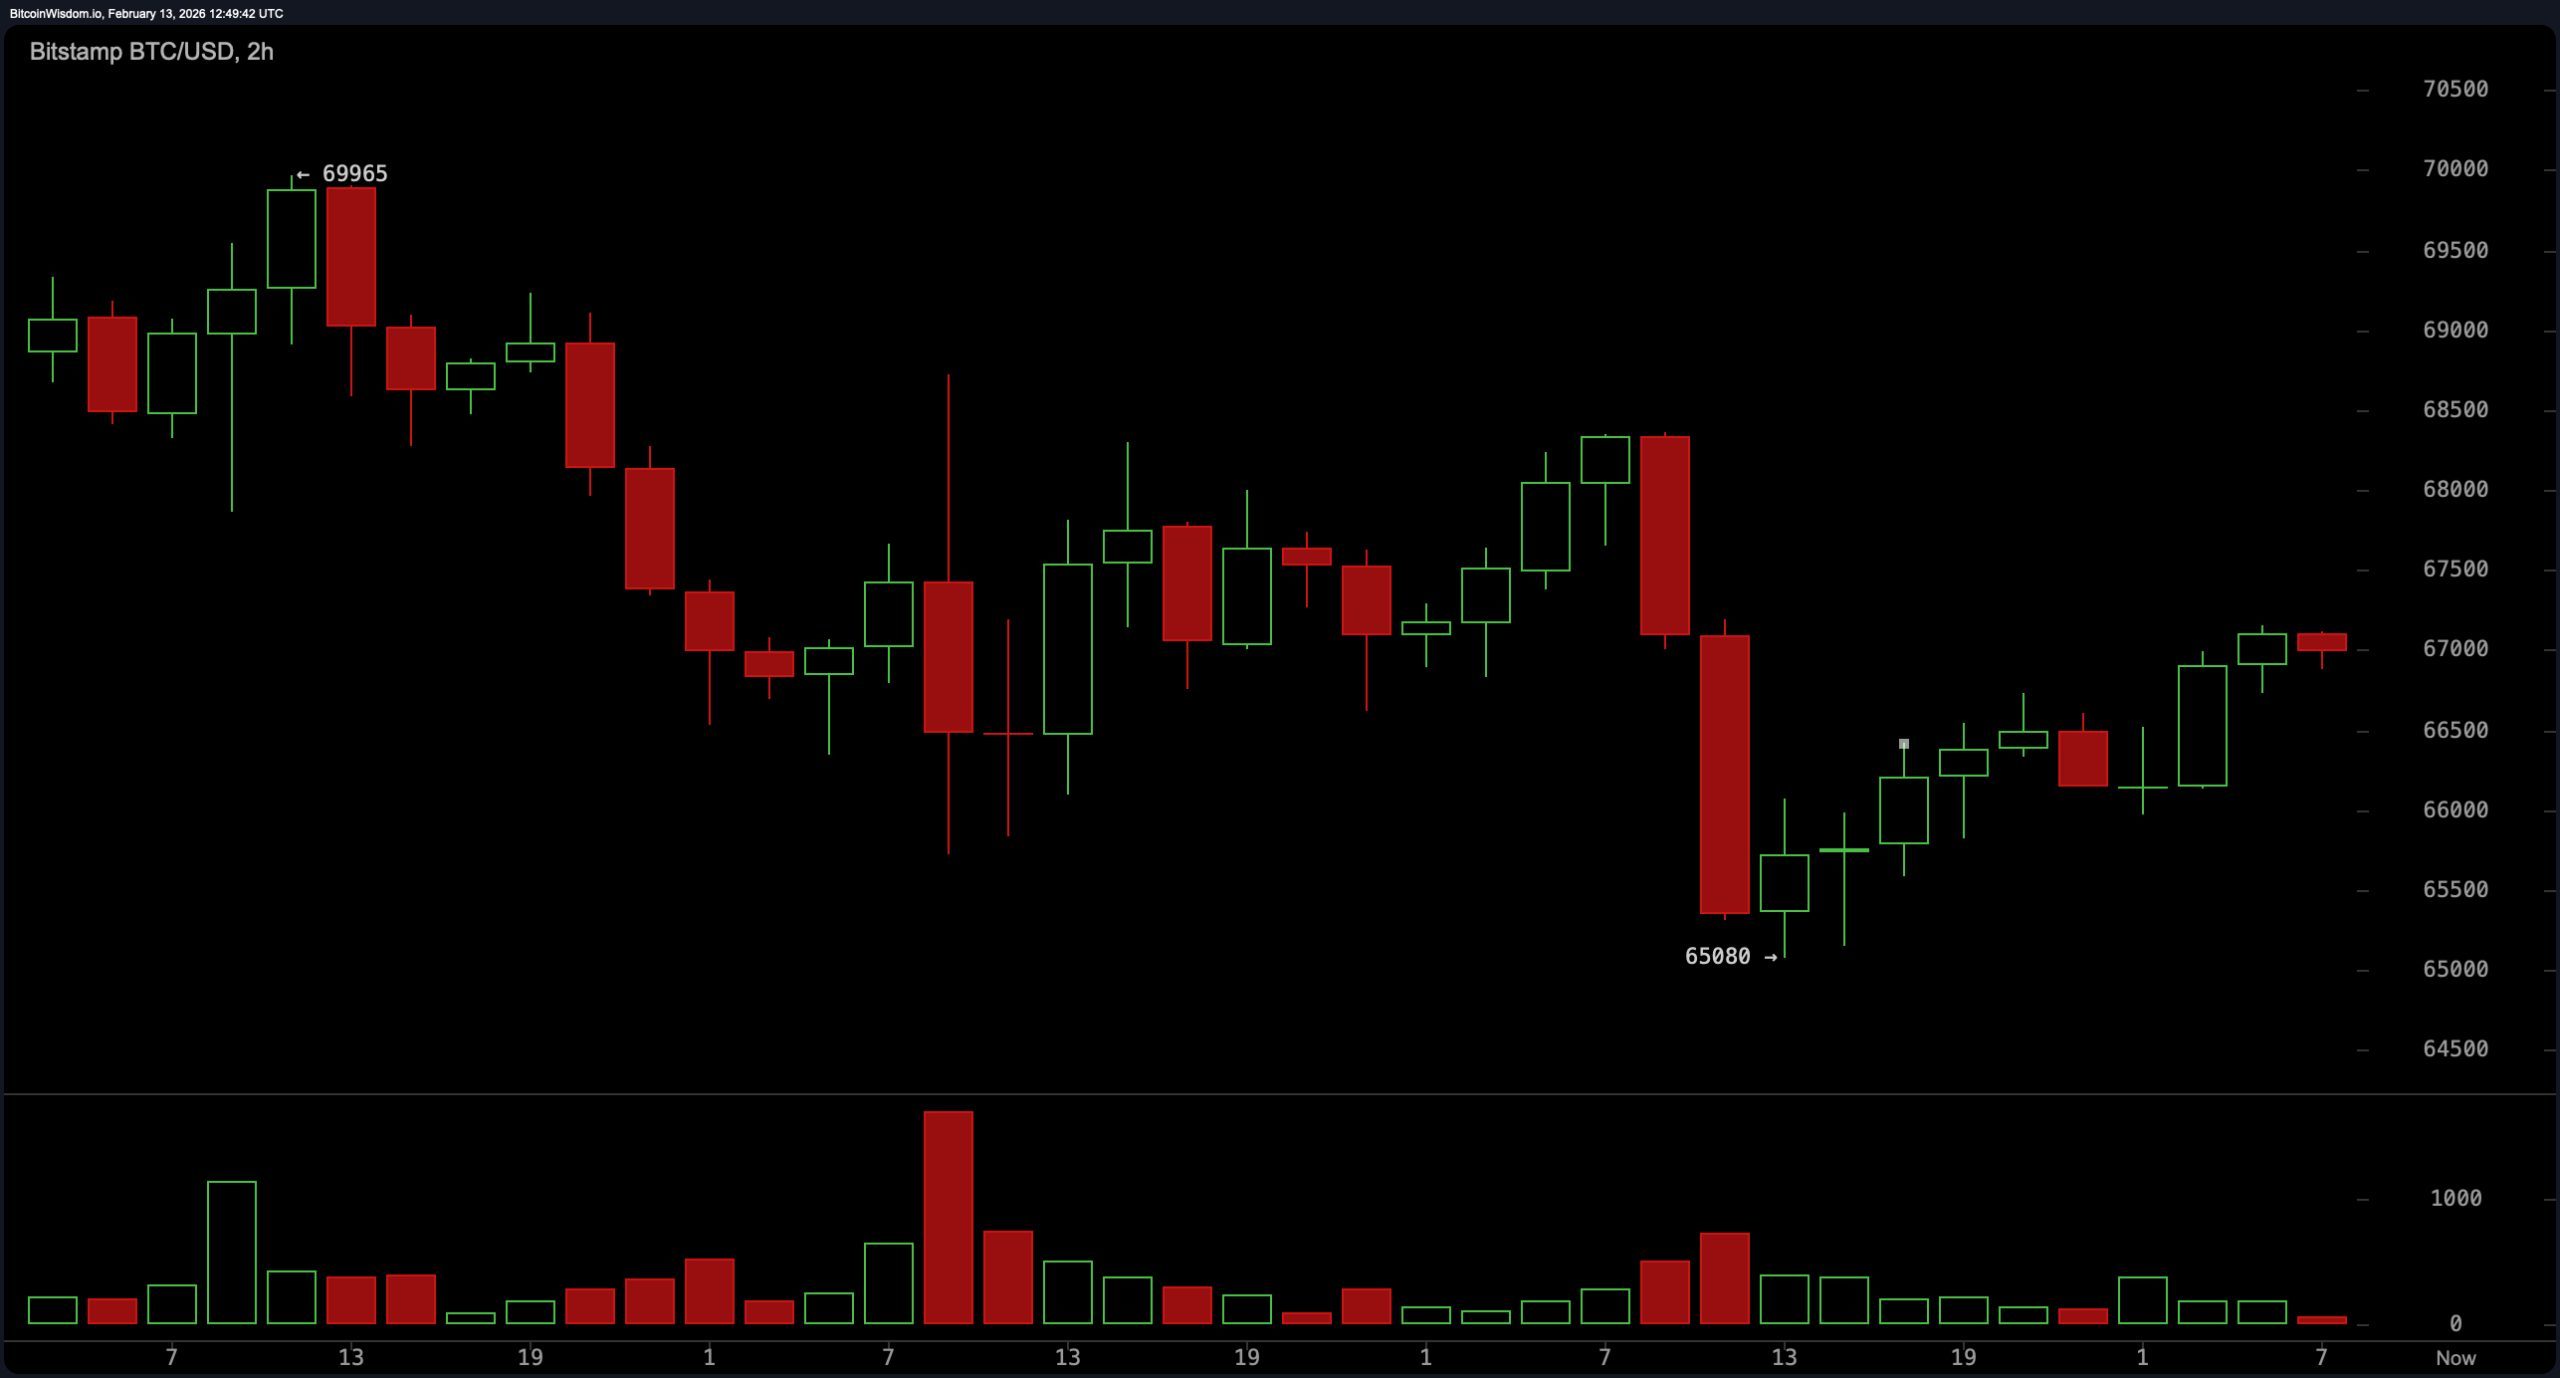
The two-hour chart underscores this compression, with price oscillating between approximately $65,000 and $68,000. Wicks repeatedly defend the $65,000 area, signaling active demand at that level, yet upside momentum is flattening. This tightening range often precedes expansion, and the probable scenarios are clear: holding $65,000 and breaking $69,000 opens a path toward $71,000 to $72,000, while a sustained loss of $65,000 exposes $62,000, and a break below $60,000 could accelerate downside toward the mid-$50,000s. The coil is tightening; the market will eventually pick a direction.
Oscillators offer a nuanced but cautious read. The relative strength index ( RSI) sits at 31 in neutral territory, the Stochastic oscillator at 26 is also neutral, the commodity channel index (CCI) at negative 85 is neutral, and the average directional index (ADX) at 56 is neutral. The Awesome oscillator prints negative 14,795 with a sell signal, while momentum registers negative 8,649 with a buy signal. The moving average convergence divergence ( MACD) level is negative 5,802 with a sell signal. This split personality across oscillators suggests indecision rather than a unified thrust.
Moving averages, by contrast, lean consistently to the downside. The exponential moving average (EMA) (10) at $69,856 and the simple moving average (SMA) (10) at $68,497 both indicate sell. The EMA (20) at $74,508 and the SMA (20) at $75,830 follow suit. The EMA (30) at $77,835 and the SMA (30) at $81,158 extend that pressure, as do the EMA (50) at $82,044 and the SMA (50) at $84,933. Longer-term gauges – the EMA (100) at $88,533, the SMA (100) at $88,323, the EMA (200) at $94,592, and the SMA (200) at $101,039 – all reflect sell signals. In short, the trend backdrop remains heavy, and bitcoin must reclaim higher resistance zones before technicians can declare the downtrend retired rather than merely resting.
Bull Verdict:
Bitcoin is trying to plant a base above $65,000, with repeated defenses of that level on the two-hour chart and emerging higher lows on the four-hour timeframe. A sustained break and hold above $69,000 would expose $71,000 to $72,000, and a strong daily close beyond $75,000 would formally shift the broader structure from neutral-to-bearish to constructive, invalidating the current sequence of lower highs and lower lows.
Bear Verdict:
The dominant daily trend remains intact, and every major exponential moving average (EMA) and simple moving average (SMA) from the 10-period through the 200-period continues to signal sell, underscoring structural weakness. A decisive loss of $65,000 opens the door to $62,000, and failure at $60,000 would risk accelerating pressure toward the mid-$50,000s, reinforcing that the relief bounce was more of a mirage than a reversal.
FAQ ❓
- What is bitcoin’s price on Feb. 13, 2026? Bitcoin is trading at $67,043 with a 24-hour range between $65,243 and $68,308.
- Is bitcoin in an uptrend or downtrend right now? The daily chart shows a broader downtrend unless bitcoin reclaims and closes above $72,000 to $75,000.
- What are the key support and resistance levels for bitcoin? Immediate support sits at $65,000 with major support near $60,000, while resistance stands between $69,000 and $72,000.
- What do bitcoin’s technical indicators signal? Oscillators are mixed, but all major exponential moving averages (EMA) and simple moving averages (SMA) from the 10-period to the 200-period reflect sell signals.
Read More
- Invincible Season 4 Episode 4 Release Date, Time, Where to Watch
- Physics Proved by AI: A New Era for Automated Reasoning
- How Martin Clunes has been supported by TV power player wife Philippa Braithwaite and their anti-nepo baby daughter after escaping a ‘rotten marriage’
- Gold Rate Forecast
- American Idol vet Caleb Flynn in solitary confinement after being charged for allegedly murdering wife
- Total Football free codes and how to redeem them (March 2026)
- CookieRun: OvenSmash coupon codes and how to use them (March 2026)
- Olivia Colman’s highest-rated drama hailed as “exceptional” is a must-see on TV tonight
- Goddess of Victory: NIKKE 2×2 LOVE Mini Game: How to Play, Rewards, and other details
- Nicole Kidman and Jamie Lee Curtis elevate new crime drama Scarpetta, which is streaming now
2026-02-13 17:17