The price of Bitcoin has begun to rise again, breaking past $73,800. It’s currently stabilizing, and could potentially climb higher, possibly exceeding $75,000.
- Bitcoin managed to stay above $72,000 and started a fresh increase.
- The price is trading above $74,000 and the 100 hourly simple moving average.
- There is a steep bullish trend line forming with support at $73,800 on the hourly chart of the BTC/USD pair (data feed from Kraken).
- The pair might extend gains if it stays above the $73,800 and $72,750 levels.
Bitcoin Price Surges Nearly 5%
Bitcoin’s price bounced back from around $70,500 and began to climb again. It’s now gaining momentum and looks poised to break through resistance levels at $72,000 and $72,500.
The price of the asset increased, even surpassing the important $74,000 mark. It peaked at $74,966 and is now stabilizing, holding gains above a key technical level. This level represents a 23.6% retracement of the recent price swing from a low of $70,517 to the high of $74,966.
Bitcoin’s price has risen above $74,000 and is currently trading above its 100-hour moving average. The price is also showing a strong upward trend, with support around $73,800, according to the hourly chart for the BTC/USD pair.
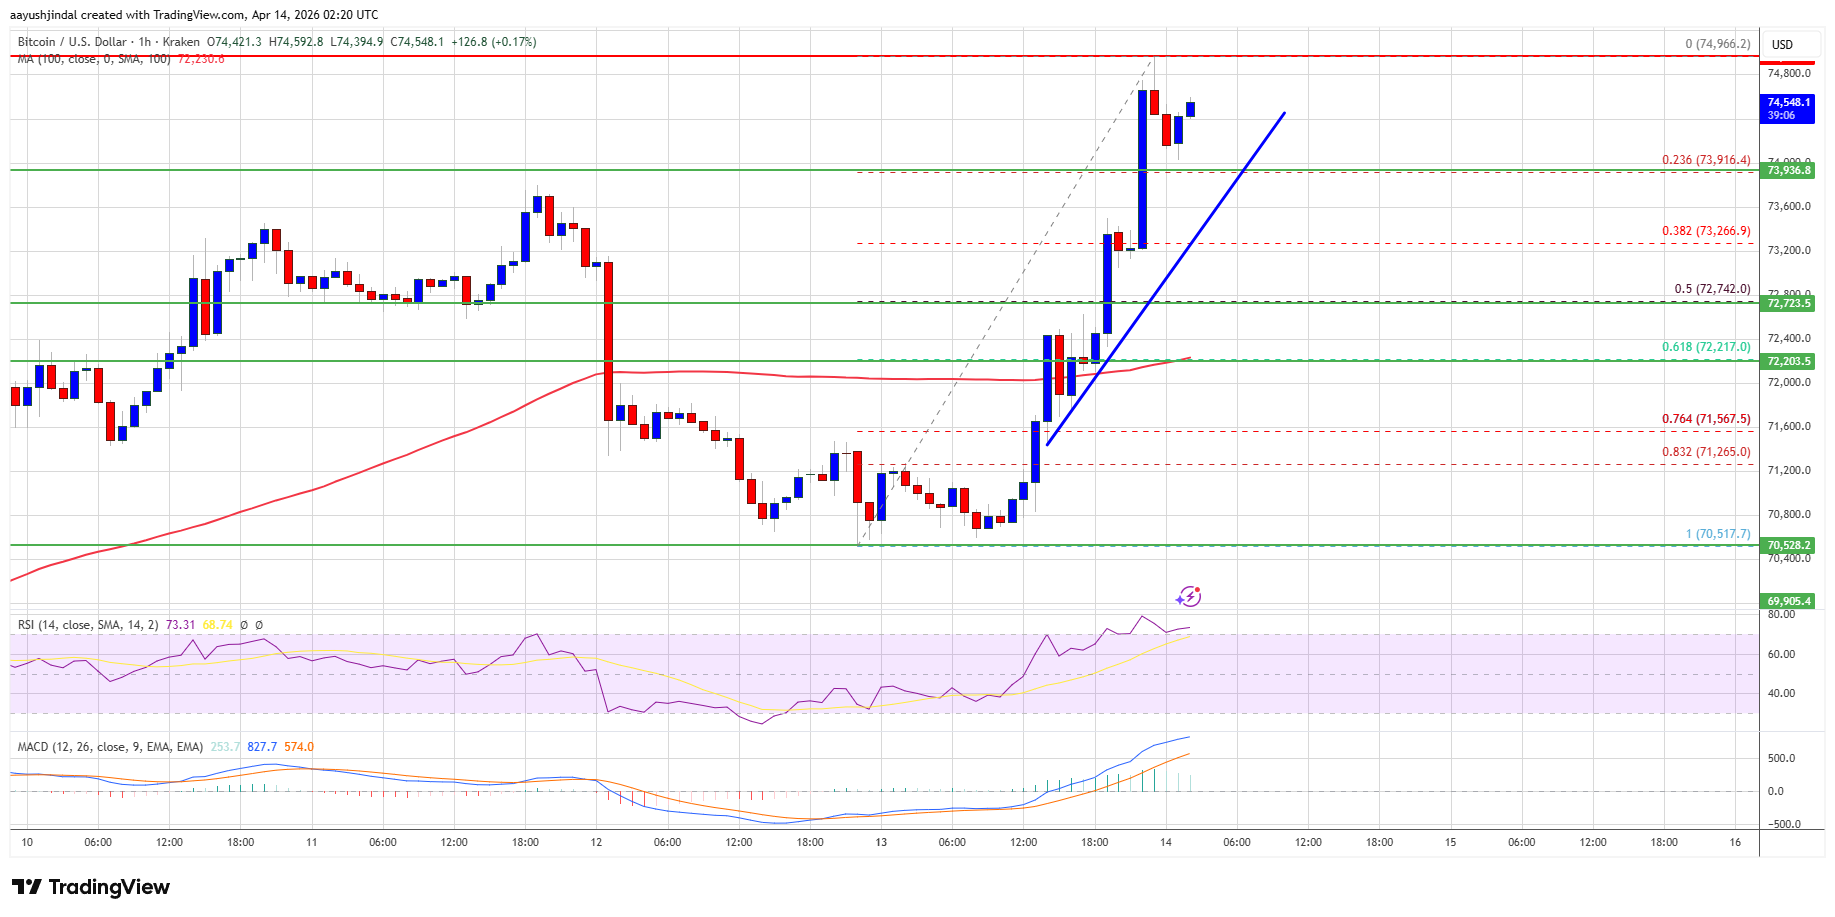
If the price stays above $74,000, it might try to climb higher. It will likely encounter some resistance around $74,800, and a major hurdle near $75,000. Breaking through $75,000 could lead to a test of $76,500, and potentially even $77,200. Beyond that, $78,000 could be the next significant challenge for buyers.
Downside Correction In BTC?
If Bitcoin doesn’t break past $75,000, its price might start to fall again. There’s some initial support around $73,800, along with an upward-trending line that could help prevent further drops.
Initial support for the price is around $73,250. Further down, another support level exists near $72,750, which also coincides with the 50% retracement of the recent price swing from $70,517 to $74,966. If the price falls further, it could test the $72,200 level soon. A key support area is now at $71,500, and a break below this could make it difficult for the price to recover quickly.
Technical indicators:
Hourly MACD – The MACD is now gaining pace in the bullish zone.
Hourly RSI (Relative Strength Index) – The RSI for BTC/USD is now above the 50 level.
Major Support Levels – $73,800, followed by $72,750.
Major Resistance Levels – $75,000 and $76,500.
2026-04-14 05:28