On March 16, 2026, at 11:15 a.m. EST, Bitcoin was trading around $73,764. Over the previous 24 hours, the price fluctuated between $71,389 and $74,387. Its market capitalization was $1.46 trillion, with $48.85 billion worth of Bitcoin traded. The data indicates Bitcoin was trading near the high end of its recent range, showing a period of stability just below a key resistance level.
Bitcoin Chart Outlook
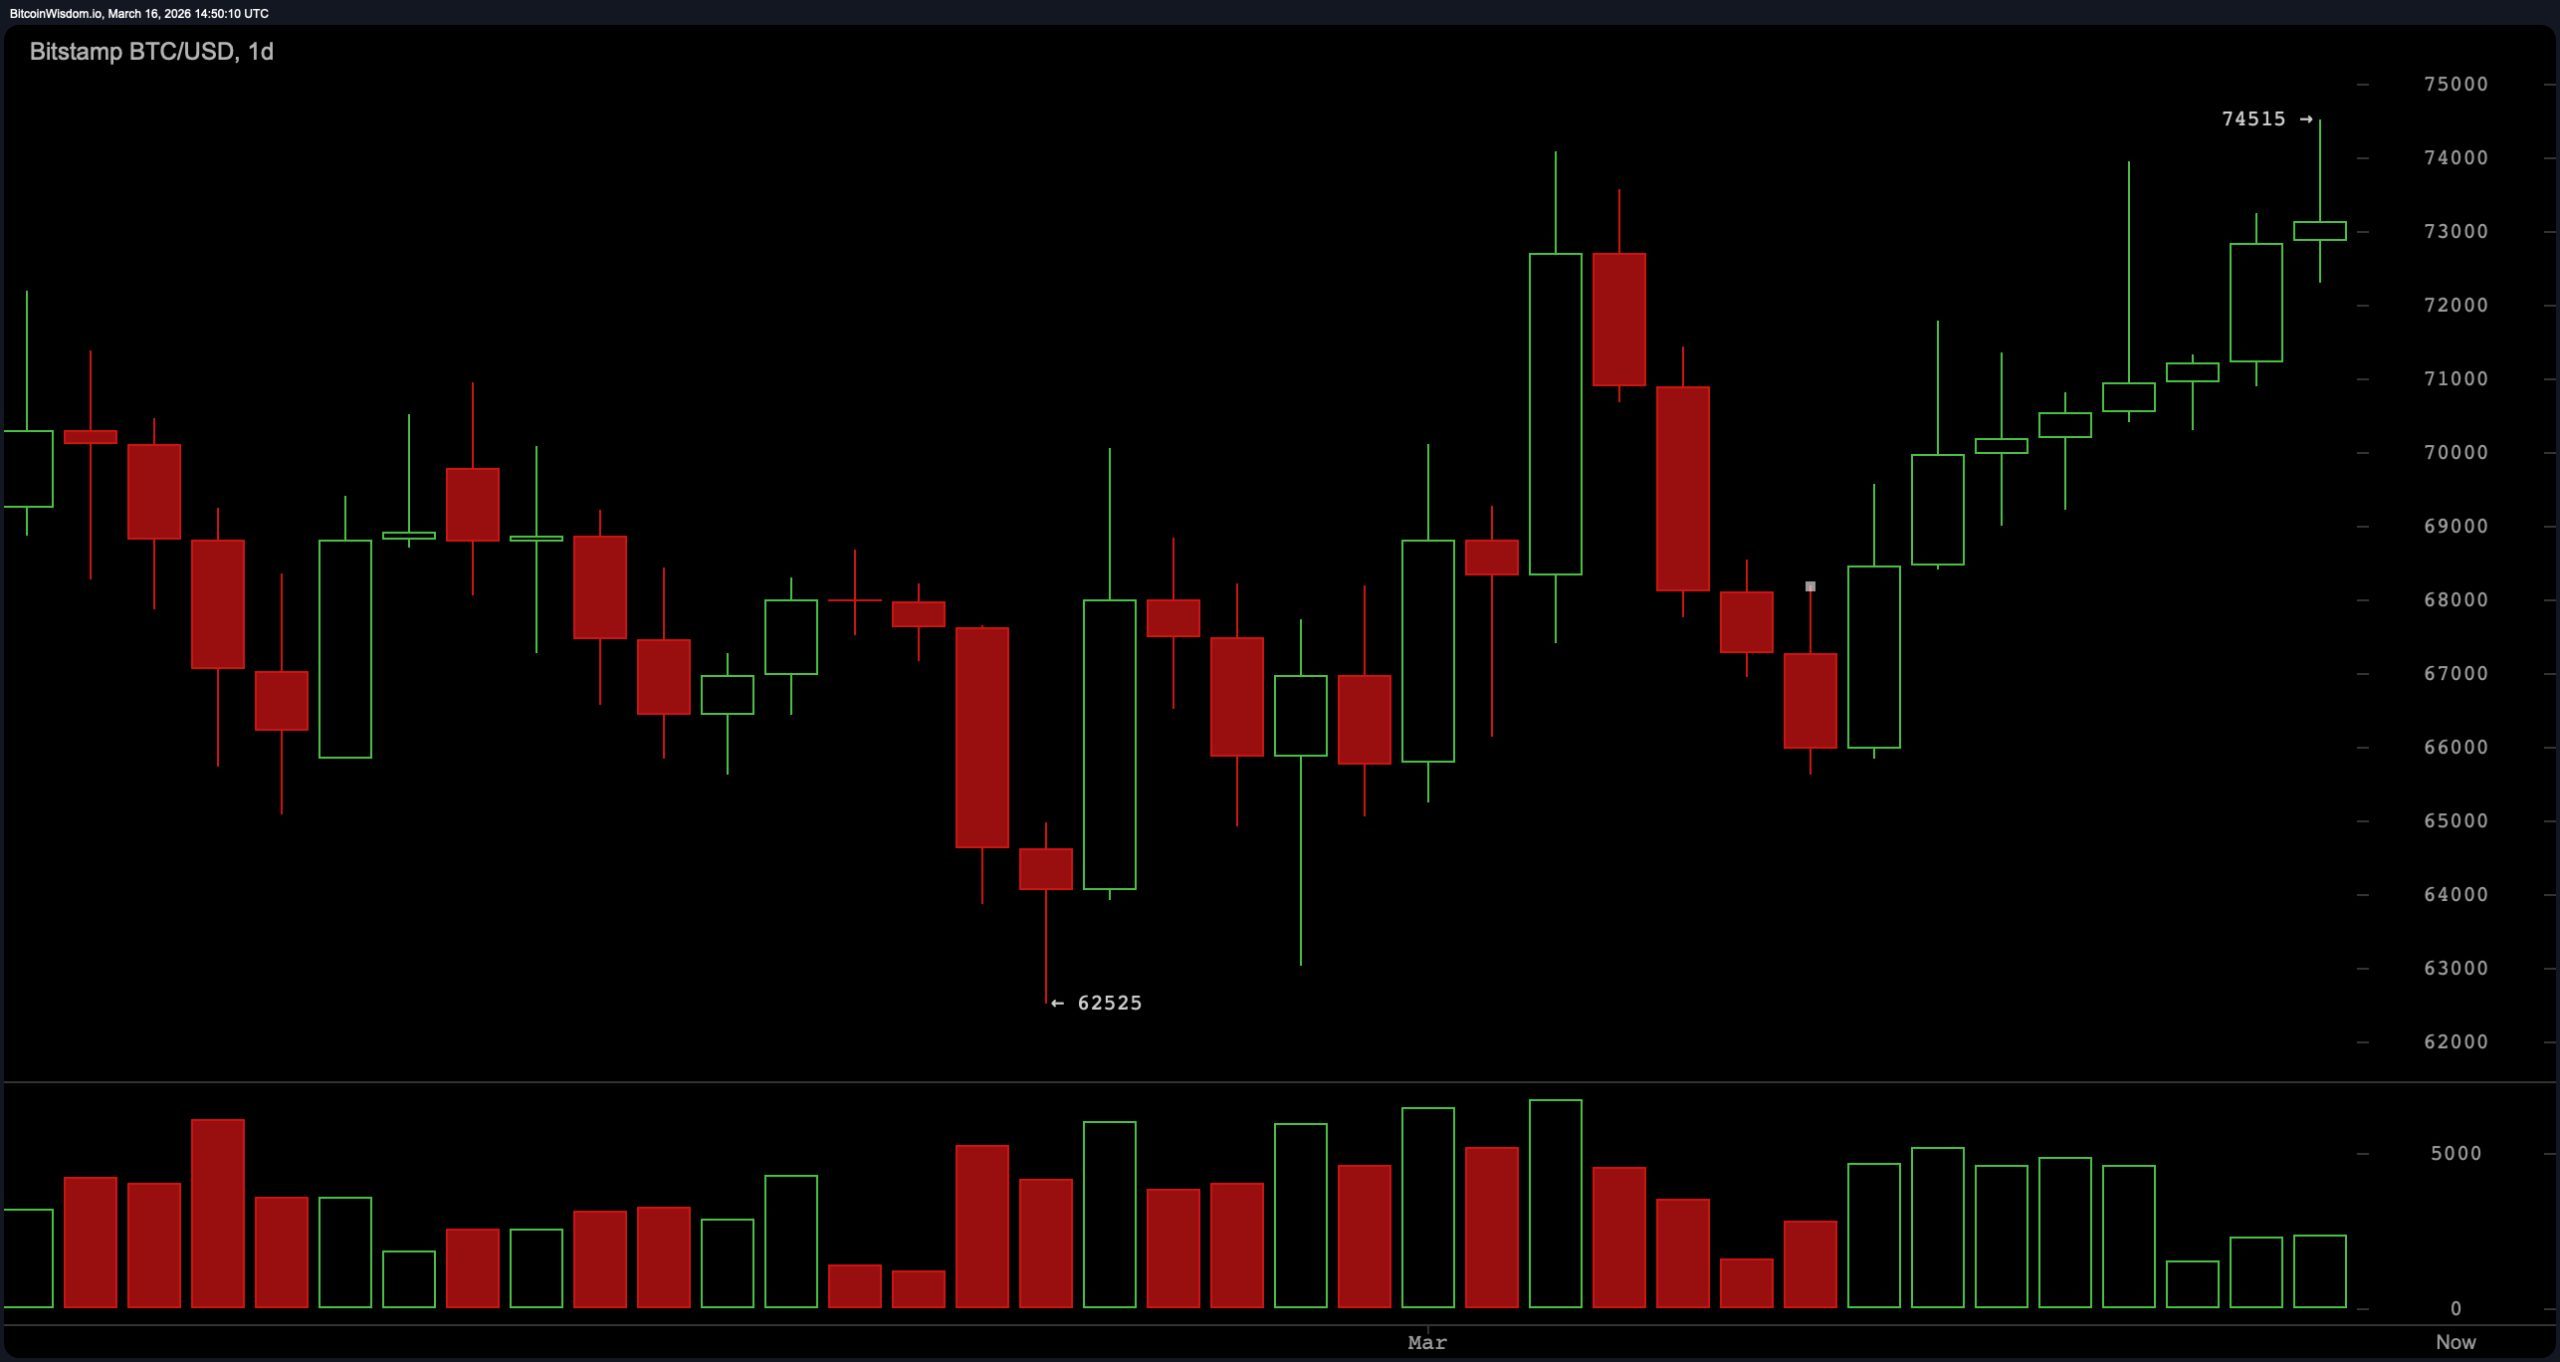
The daily chart places bitcoin within the same verified intraday band, with price activity holding between $71,389 and $74,387 during the latest session. The market remained positioned in the upper section of that range as trading clustered around the $73,000–$74,000 area.
The chart shows key reference levels at 75,000, 83,500, and 87,500, with lower levels around 73,500, 73,000, and 72,500. Currently, the price seems to be stabilizing within this range, rather than breaking above the day’s high.
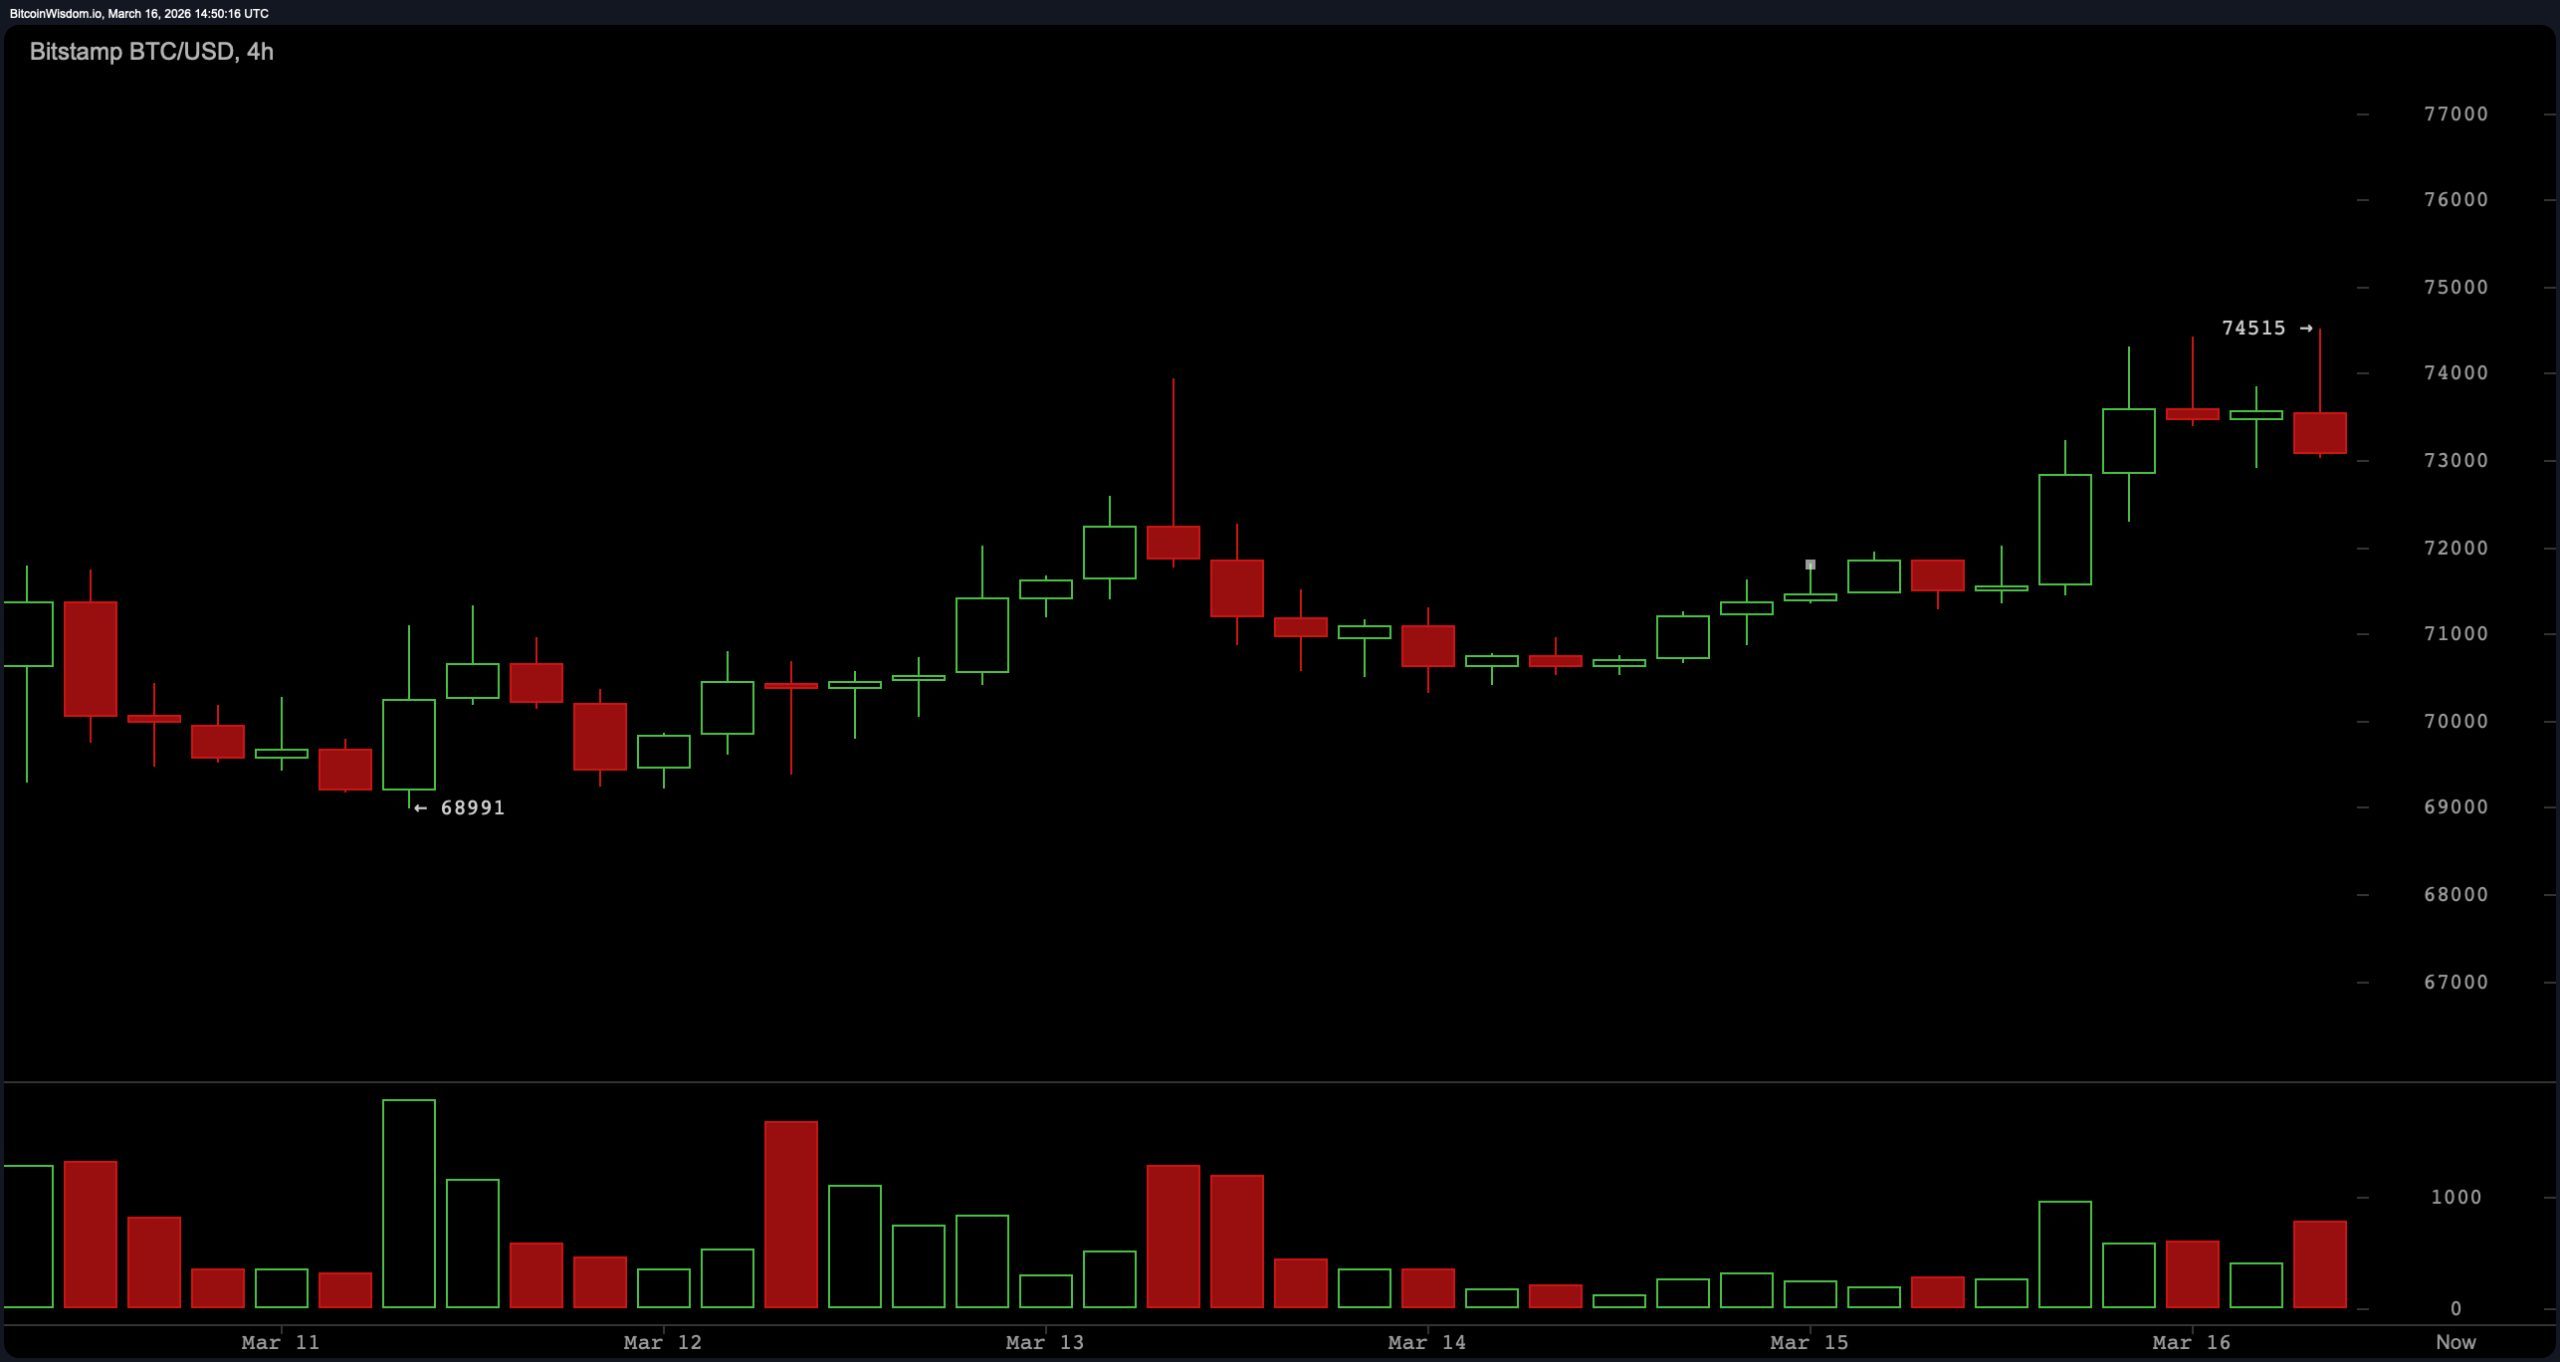
On the four-hour chart, price activity shows bitcoin consolidating near the $73,800–$73,851 region based on Bitstamp movements. The chart’s recent ticks indicate sequential trades within that narrow band, suggesting short-term compression after the earlier push toward the upper end of the session range. Short-term price structure remains above several lower moving-average clusters referenced in the data set between roughly $68,000 and $72,000. The four-hour timeframe, therefore, reflects sideways movement near resistance rather than a retracement back toward deeper support levels.
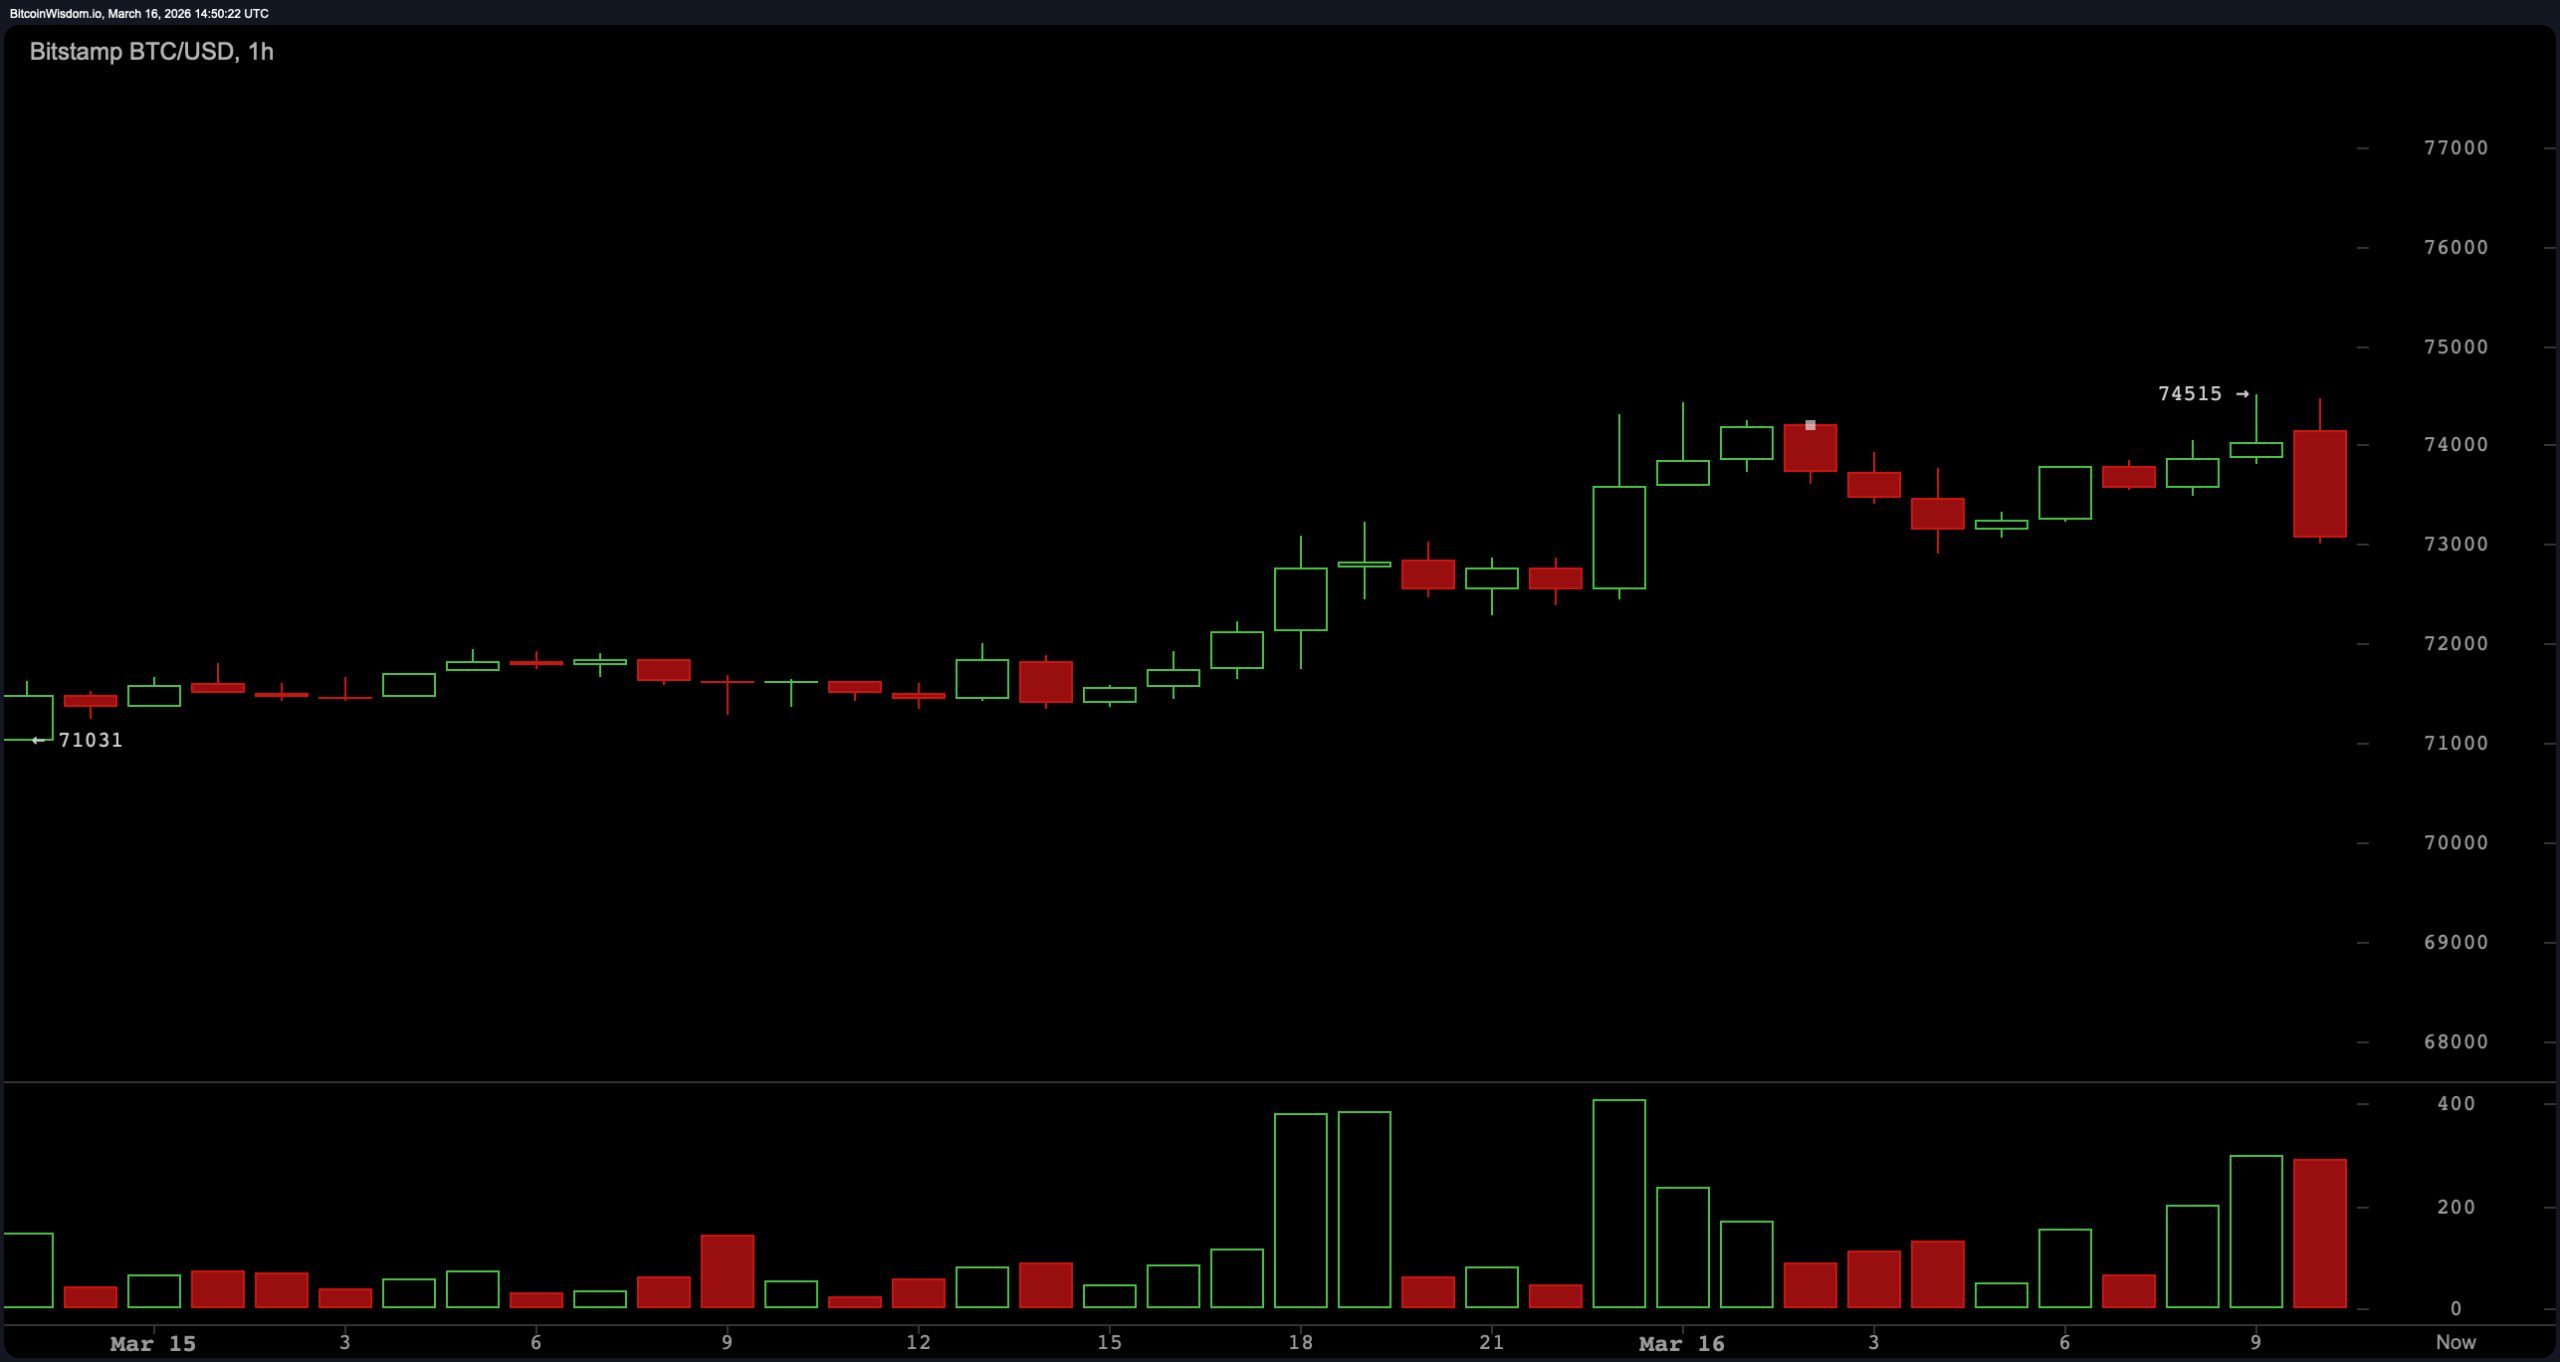
Looking at the one-hour chart, the price is still moving within a narrow range, fluctuating around $73,000. Recent trades have been happening between approximately $73,800 and $73,851, with average buy orders around $73,829 and sell orders around $73,791. Current trading is slightly above these averages, but the difference is small. Overall, the price is moving within a tight band, just below its recent high.
Oscillator readings remain broadly neutral overall. The relative strength index ( RSI) printed 59, while the Stochastic measured 80 and the commodity channel index (CCI) registered 142, each categorized as neutral in the data set. The average directional index (ADX) stood at 25, also labeled neutral, suggesting only moderate trend strength.
The Awesome oscillator recorded 3,282 and likewise remained neutral. Two indicators diverged slightly from the neutral cluster: the momentum indicator (10) registered 5,076 and the moving average convergence divergence ( MACD) level (12, 26) printed 364, both signaling positive momentum in the technical summary.
Moving averages skew supportive on shorter periods, while longer-term levels remain above the current price. The exponential moving average (EMA) and simple moving average (SMA) show the EMA (10) at $70,818 and SMA (10) at $70,054; EMA (20) at $70,012 and SMA (20) at $69,175; EMA (30) at $70,447 and SMA (30) at $68,476; and EMA (50) at $72,799 with SMA (50) at $71,119.
Key moving averages are still high: the 100-day EMA is around $79,412, the 100-day SMA is around $80,613, the 200-day EMA is around $87,686, and the 200-day SMA is around $93,738. Based on this data, the overall trend appears positive.
Bull Verdict:
Bitcoin remains positioned near the upper portion of its 24-hour range while maintaining distance above several short-term moving averages between roughly $68,000 and $72,000. Momentum indicators, including the moving average convergence divergence ( MACD) and the momentum indicator (10), register positive signals, while the relative strength index ( RSI) holds below overbought territory at 59. With price consolidating just below the session high of $74,387.36 and above the 50-period exponential moving average (EMA) at $72,799, the short-term technical structure reflects stability near resistance rather than deterioration. If price maintains its position above the cluster of shorter moving averages, the chart structure suggests continued testing of the upper range.
Bear Verdict:
Despite trading near the upper portion of the daily range, bitcoin remains below several longer-term moving averages that continue to sit significantly above current price levels. The 100-period exponential moving average (EMA) at $79,412, the 100-period simple moving average (SMA) at $80,613, the 200-period EMA at $87,686, and the 200-period SMA at $93,738 all remain overhead. Oscillators broadly categorized as neutral — including the relative strength index ( RSI), stochastic %K, commodity channel index (CCI), average directional index (ADX), and the Awesome oscillator — indicate limited trend strength. With price consolidating just below the session high rather than moving beyond it, the market continues to trade within its defined range rather than establishing a confirmed breakout.
FAQ 🔎
- What is bitcoin’s price on March 16, 2026?
Bitcoin traded around $73,764 on March 16, 2026, around 11:15 a.m. EST, within a 24-hour range of $71,389.65 to $74,387.36. - Is bitcoin trending up or down right now?
Short-term charts show bitcoin consolidating near the upper portion of its daily range while holding above several shorter-term moving averages. - What do bitcoin’s technical indicators show today?
Most oscillators remain neutral, while momentum and moving average convergence divergence ( MACD) indicators register positive momentum signals. - What key levels are traders watching for bitcoin?
The current session high near $74,387 acts as immediate resistance, while nearby support levels appear around $73,500, $73,000 and $72,500.
Read More
- ‘Project Hail Mary’s Unexpected Post-Credits Scene Is Worth Sticking Around
- Total Football free codes and how to redeem them (March 2026)
- Limbus Company 2026 Roadmap Revealed
- The Division Resurgence Specializations Guide: Best Specialization for Beginners
- After THAT A Woman of Substance cliffhanger, here’s what will happen in a second season
- Brawl Stars Sands of Time Brawl Pass brings Sandstalker Lily and Sultan Cordelius sets, along with chromas and more
- Brawl Stars Brawl Cup Pro Pass arrives with the Dragon Crow skin and Chroma, unique cosmetics, and more rewards
- Clash of Clans April 2026 Gold Pass Season introduces a Archer Queen skin
- XO, Kitty season 3 soundtrack: The songs you may recognise from the Netflix show
- Gold Rate Forecast
2026-03-16 19:00