Algorand is currently trading just slightly above its lowest price point since March. Looking at its performance across different timeframes, the coin appears to be experiencing choppy trading with a gradual decline in value.
Looking at the ALGOUSDT chart this week, what stands out most isn’t any particular trend – it’s how close Algorand is to its lowest price ever. Currently, it’s only about 3.5% above that low, which isn’t a great sign considering it used to trade for over three dollars.
That recent low price wasn’t a temporary dip from early in the year. It happened on March 29th – about four months ago – and was $0.0797. The price hasn’t really moved much above that level since then.
Still Living Off a 2019 Peak
Looking at a monthly price chart, one number stands out: 97.7%. That represents the significant difference between ALGO‘s current price and its low of $3.56 from June 2019. Even after seven years, it’s still defined by that initial low point – which seems somewhat unfair.
Monthly RSI, for what it’s worth, reads 43.
The price is currently below fifty and moving sideways. I don’t see any clear signals that it will soon reverse direction. It doesn’t seem like a typical ‘oversold’ situation, but rather a sign that the price has been falling for a while and buyers are no longer trying to take advantage of the lower prices – they’ve lost interest.
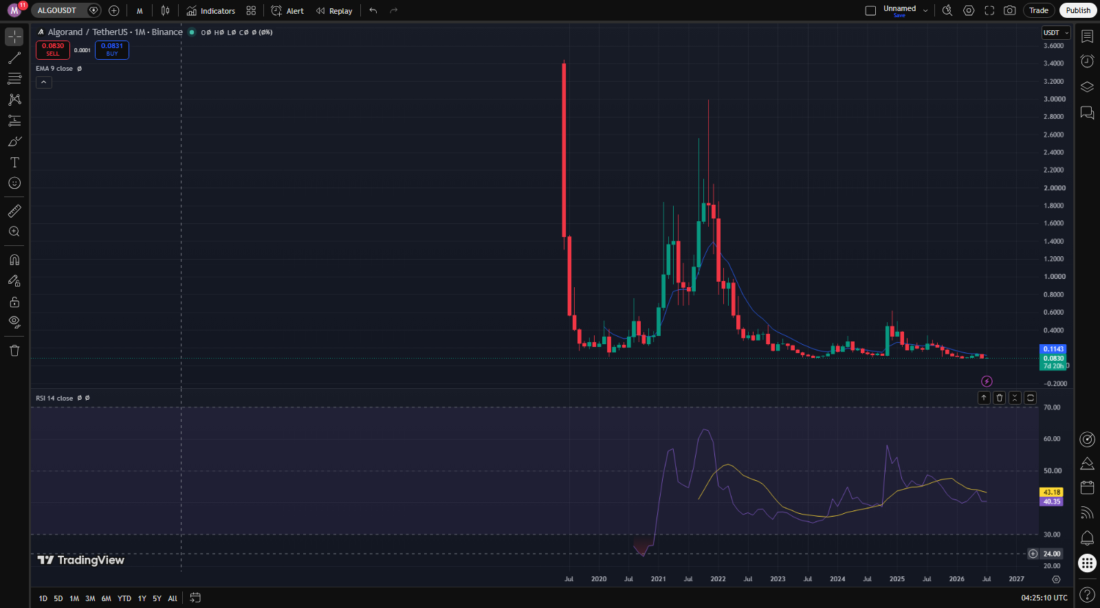
Algorand (ALGOUSDT) Monthly chart. Source: TradingView / Binance.
The Slow Bleed Since Last Summer
The weekly chart simply provides a more detailed view of the same overall trend. ALGO reached around sixty cents in mid-2023, and has been steadily declining ever since, with only a short-lived rise to fifty cents in late 2024 before continuing its downward trend.
Looking at my charts, the weekly Relative Strength Index (RSI) is currently between 36 and 40. It definitely suggests things are heading downwards, but honestly, it’s not a super alarming signal like when you see RSI drop into the low twenties – that’s usually when everyone really starts selling off and we hit a bottom. This feels more like a correction than a complete crash.
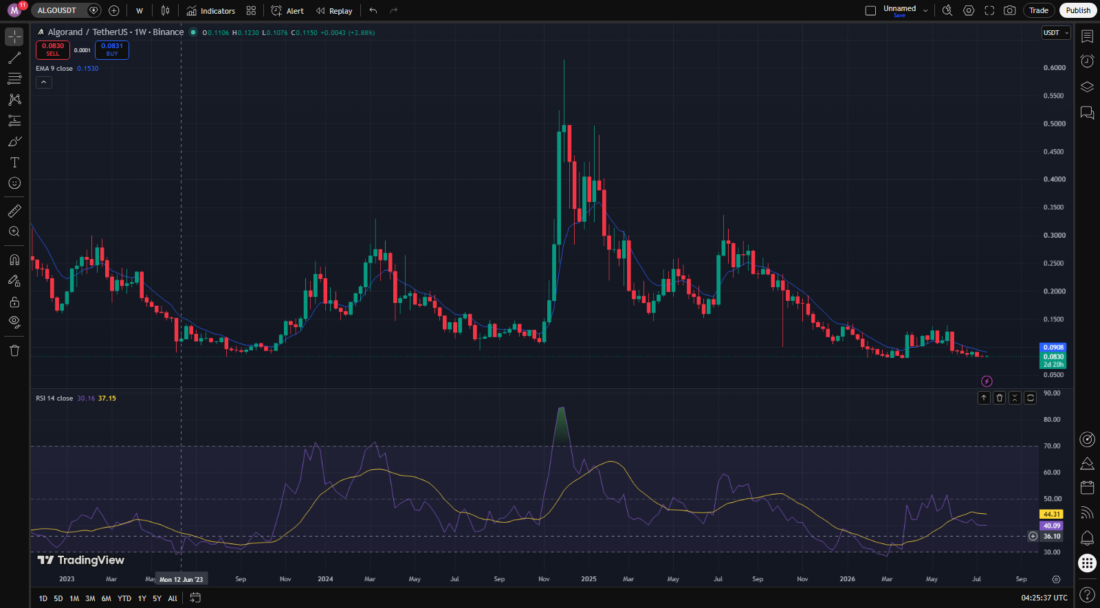
Algorand (ALGOUSDT) Weekly chart. Source: TradingView / Binance.
Stuck Below Nine Cents Since June
With Daily, the specific price range it stays within is becoming more important than whether the overall trend is going up or down. In May and June, automated trading programs (ALGO) attempted to push the price higher, briefly reaching $0.135 and then $0.104, but both times the price fell back down. Since then, it’s been stuck fluctuating between about eight and nine cents.
The Relative Strength Index (RSI) is currently at 41, just below the neutral level. The price is also below its 9-day Exponential Moving Average, which is around $0.0954 – significantly higher than the current trading price. This suggests the short-term trend hasn’t reversed yet, despite a decrease in selling.
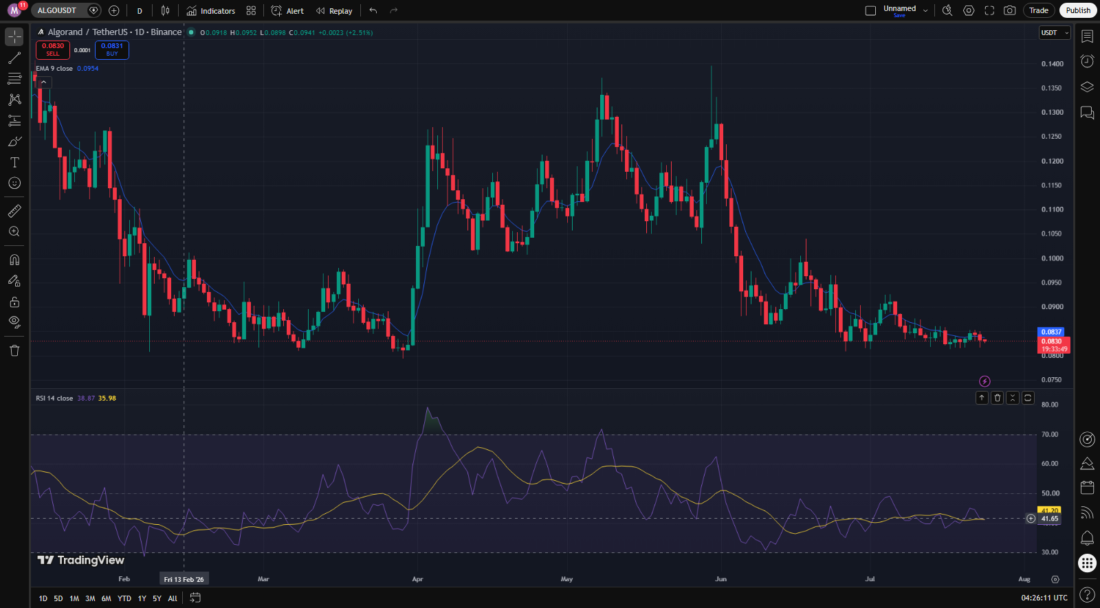
Algorand (ALGOUSDT) Daily chart. Source: TradingView / Binance.
Four Weeks of Going Absolutely Nowhere
Looking at a 4-hour chart, the price has been trading within a very tight range – roughly between 8.2 and 8.8 cents – for nearly a month. The Relative Strength Index (RSI) continues to fluctuate between the high 30s and mid-60s, repeatedly moving within this same limited range.
It’s just random fluctuation, nothing more. It isn’t driven by a clear pattern or steady growth – the market is simply undecided about which direction to take.
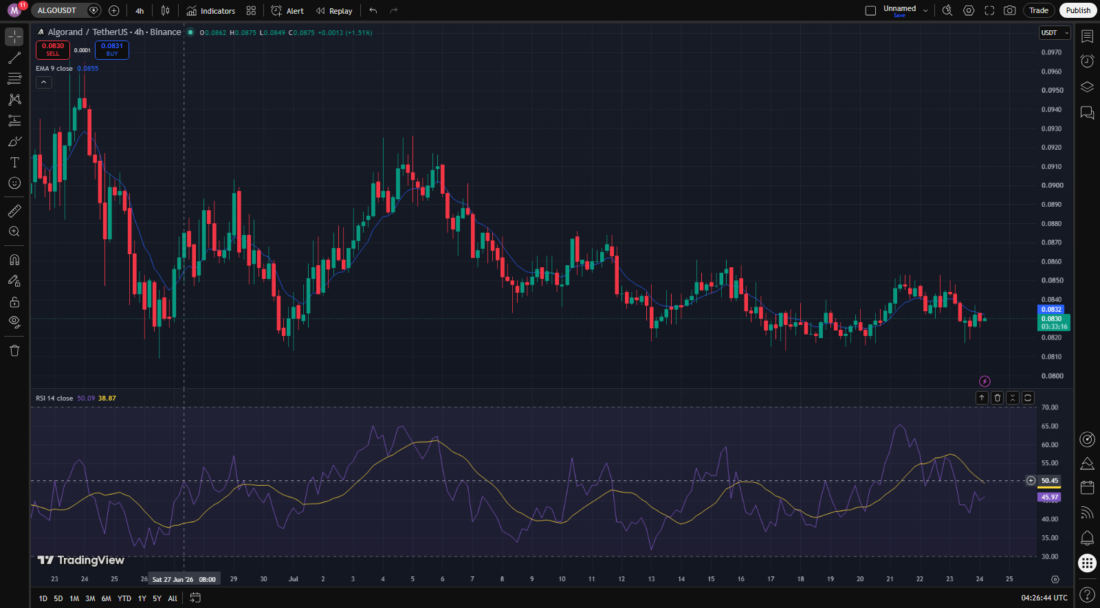
Algorand (ALGOUSDT) 4-hour chart. Source: TradingView / Binance.
The Dip That Got Bought Back Fast
Things became more notable recently, over the past day or so. The price dropped to $0.0818 on the 15-minute chart, pushing the Relative Strength Index (RSI) below 20 – indicating it was oversold. However, it quickly recovered all of that loss in just a few trading periods. Now, it’s back around $0.083 with an RSI near 55.
Looking at the hourly chart, we see a similar recovery happening – the price has bounced back up from the lower end of a trading range it’s been in since July 17th, between $0.0815 and $0.0854. It’s worth watching, but one small bounce on a short-term chart doesn’t necessarily indicate a larger trend change.
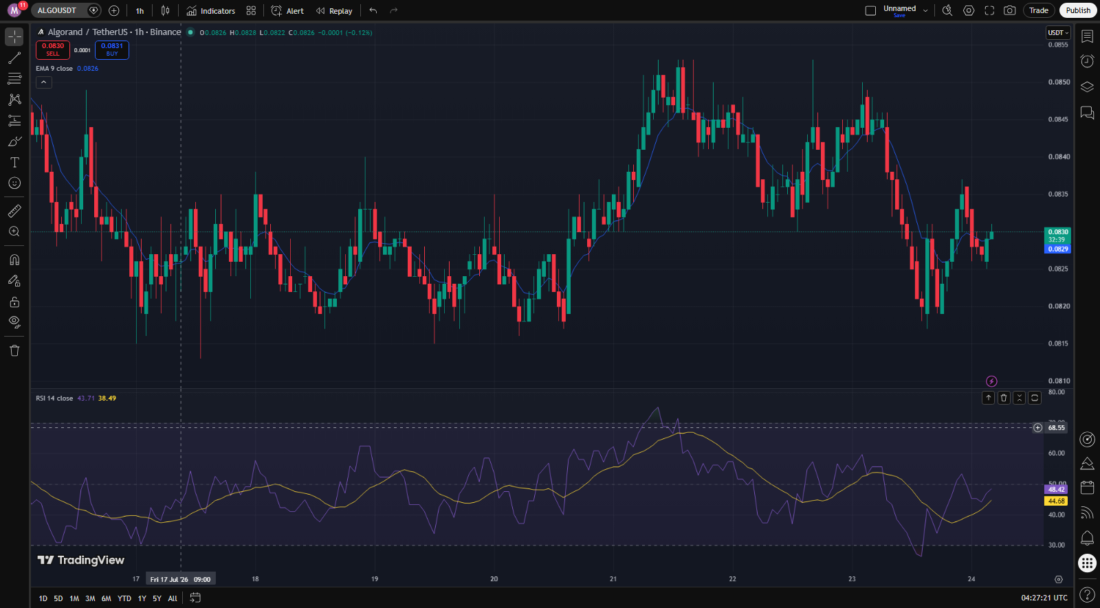
Algorand (ALGOUSDT) 1-hour chart. Source: TradingView / Binance.
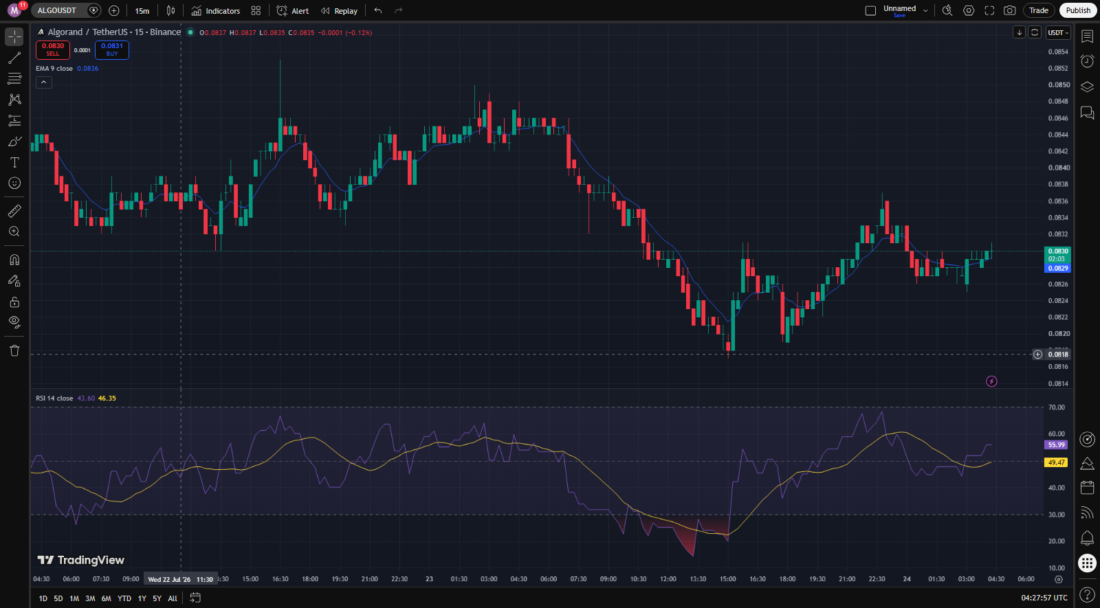
Algorand (ALGOUSDT) 15-minute chart. Source: TradingView / Binance.
What the Volume Numbers Actually Say
According to CoinGecko, Algorand (ALGO) is currently down 1.9% today, but has seen a slight increase of less than 1% over the last week. This weekly performance lags behind both the overall crypto market and other smart contract platforms. Over the past month, ALGO’s performance has worsened, dropping nearly 13%. However, its one-year performance is particularly poor, with a significant loss of 69%.
Trading volume over the past day totaled approximately $18.3 million, a slight decrease of nearly 3% from the previous day, indicating reduced activity. The market capitalization remains around $743 million, currently ranking it 77th overall. Most ALGO/USDT trading is happening on the OKX and Binance exchanges.
The future of ALGO likely hinges on whether it can surpass its low of $0.0797 from March. It’s been four months, and the price hasn’t been able to move significantly away from that level. The current chart pattern – fluctuating prices and a recent dip – doesn’t give a clear indication of which direction the price will ultimately go.
2026-07-24 16:17