On March 6, 2026, at 8:30 a.m. Eastern Time, Bitcoin was trading at $69,926. Its total market value was around $1.39 trillion, with $48 billion worth of Bitcoin traded in the past 24 hours. Throughout the day, the price fluctuated between $69,732 and $72,956, settling in a narrow range. Buyers were actively defending the $69,000 level, while selling pressure remained around $73,000.
Bitcoin Chart Outlook
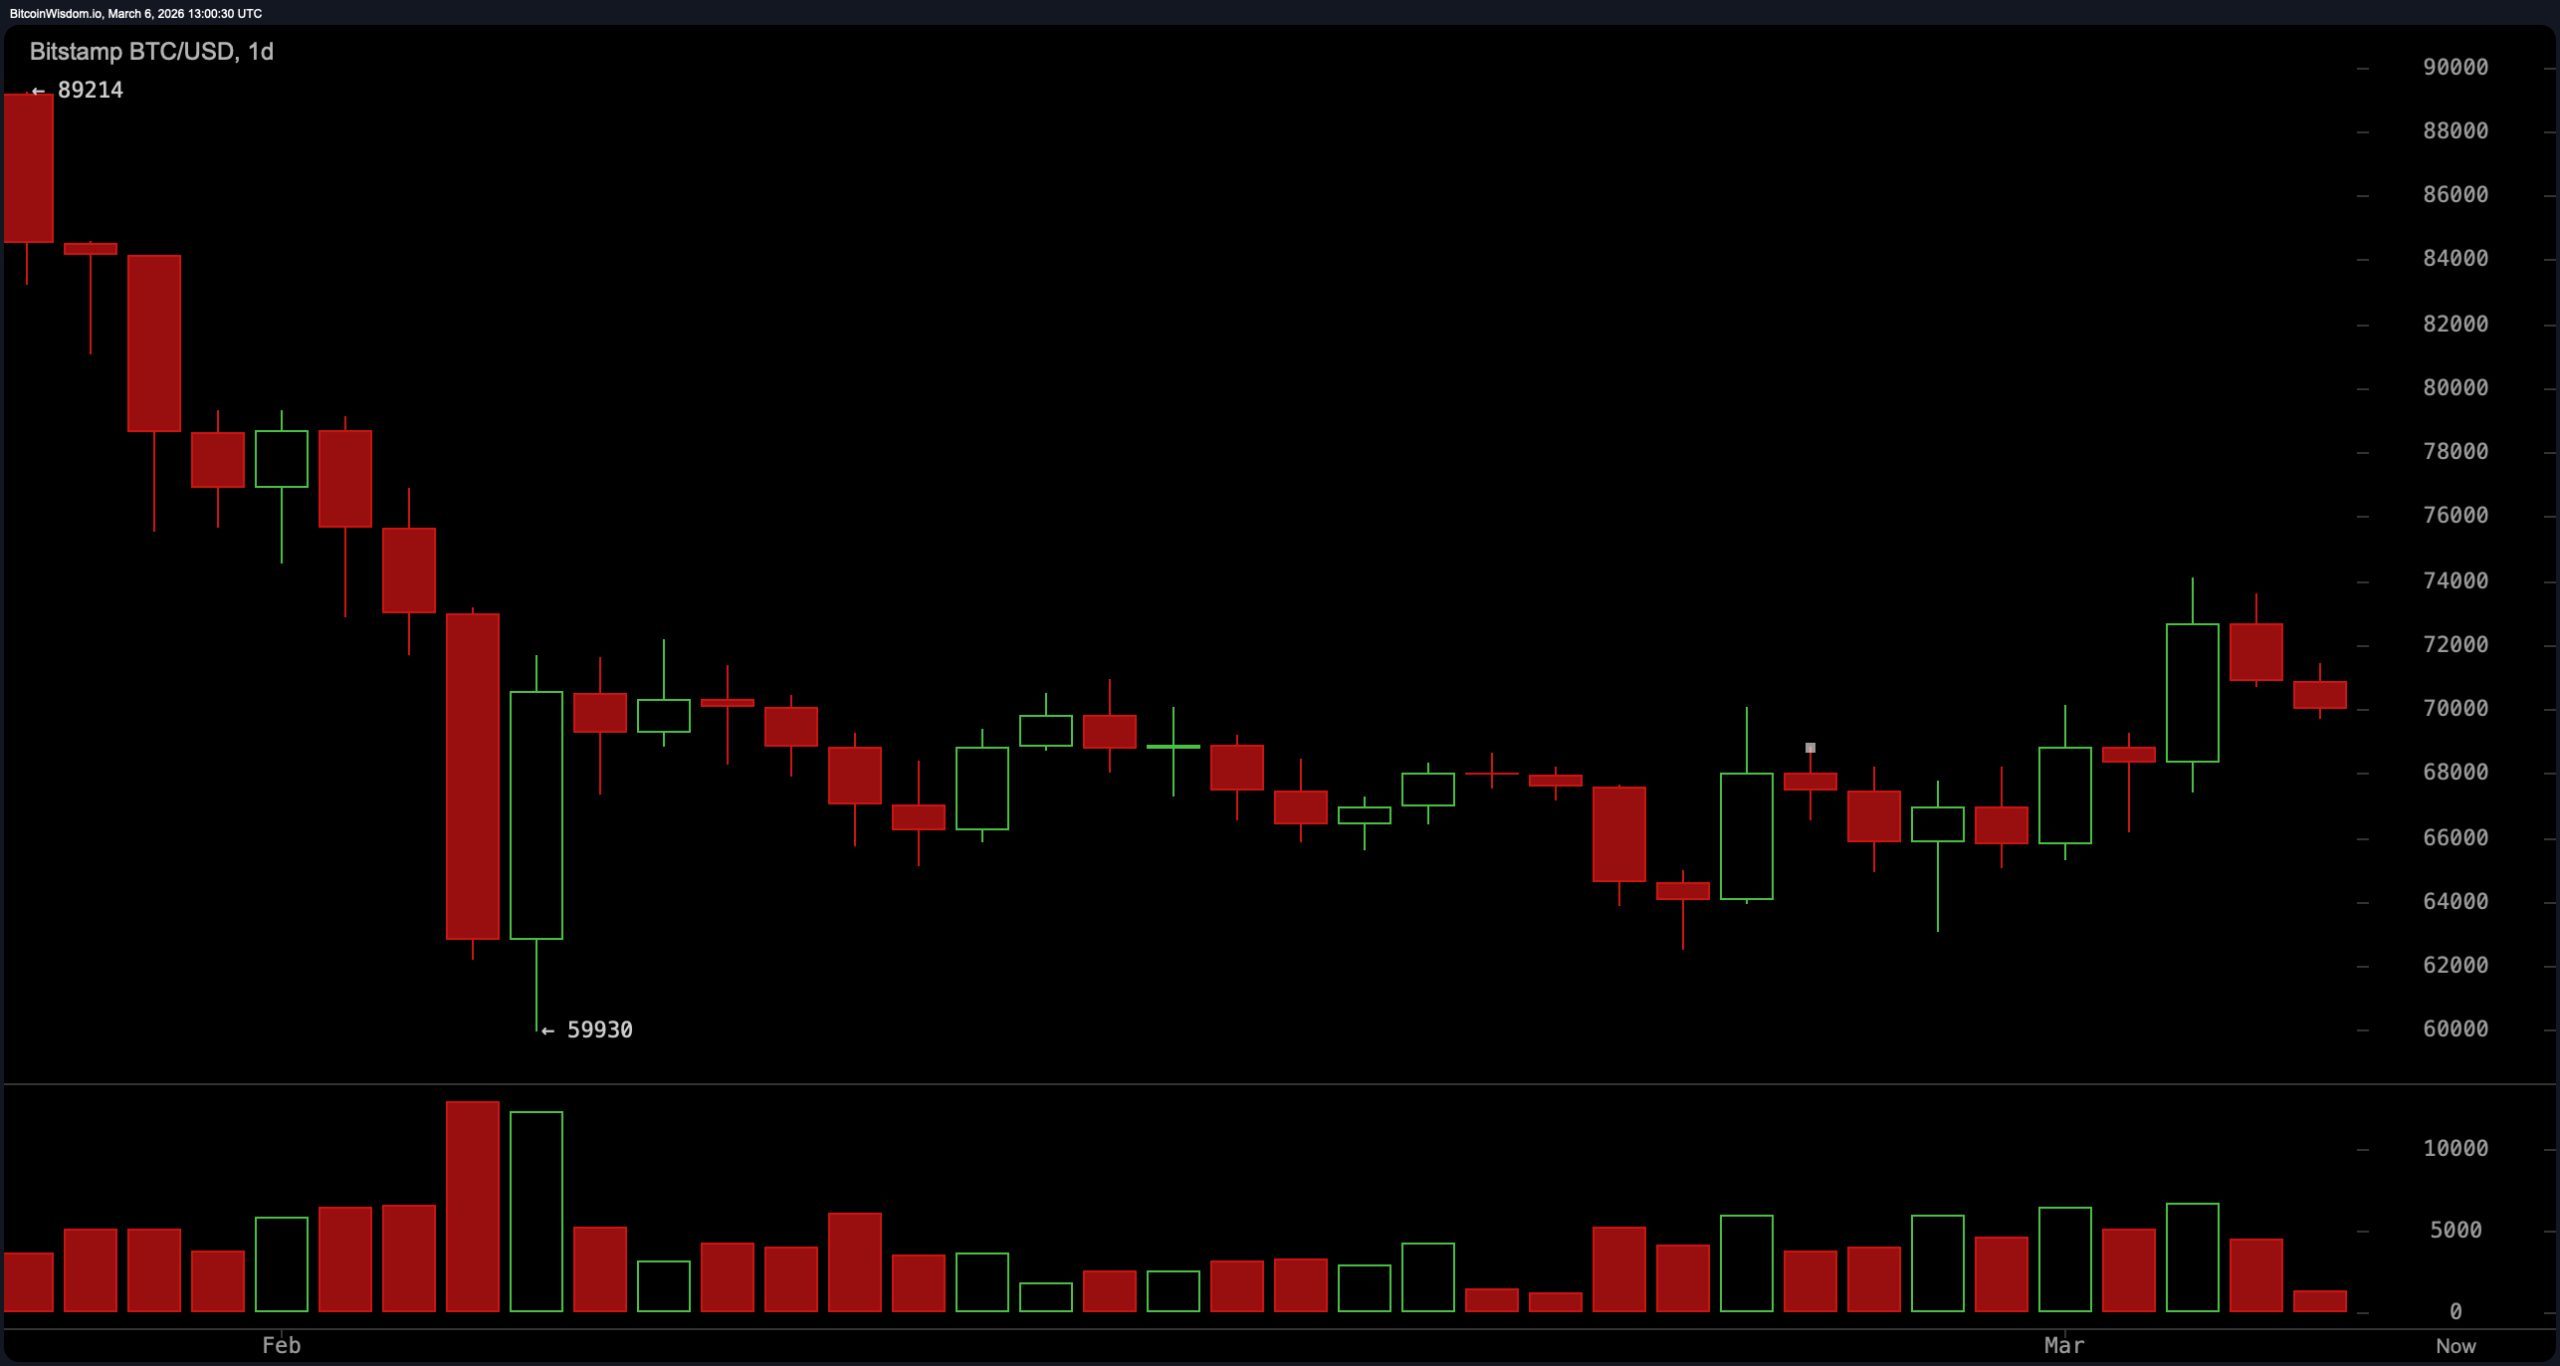
The daily bitcoin chart outlines the broader structural backdrop: a steep decline from roughly $89,000 toward $60,000 followed by a sideways consolidation phase. That range currently spans approximately $63,000 to $73,000, creating a classic equilibrium zone where neither side has established sustained directional control.
Support is clustered near $65,000, with deeper macro support near $60,000, while resistance sits between $73,000 and $74,000, with the next technical ceiling around $78,000. In plain English: Bitcoin is not trending on the macro timeframe right now; it is coiling. And markets that coil tend to eventually snap in one direction or the other.
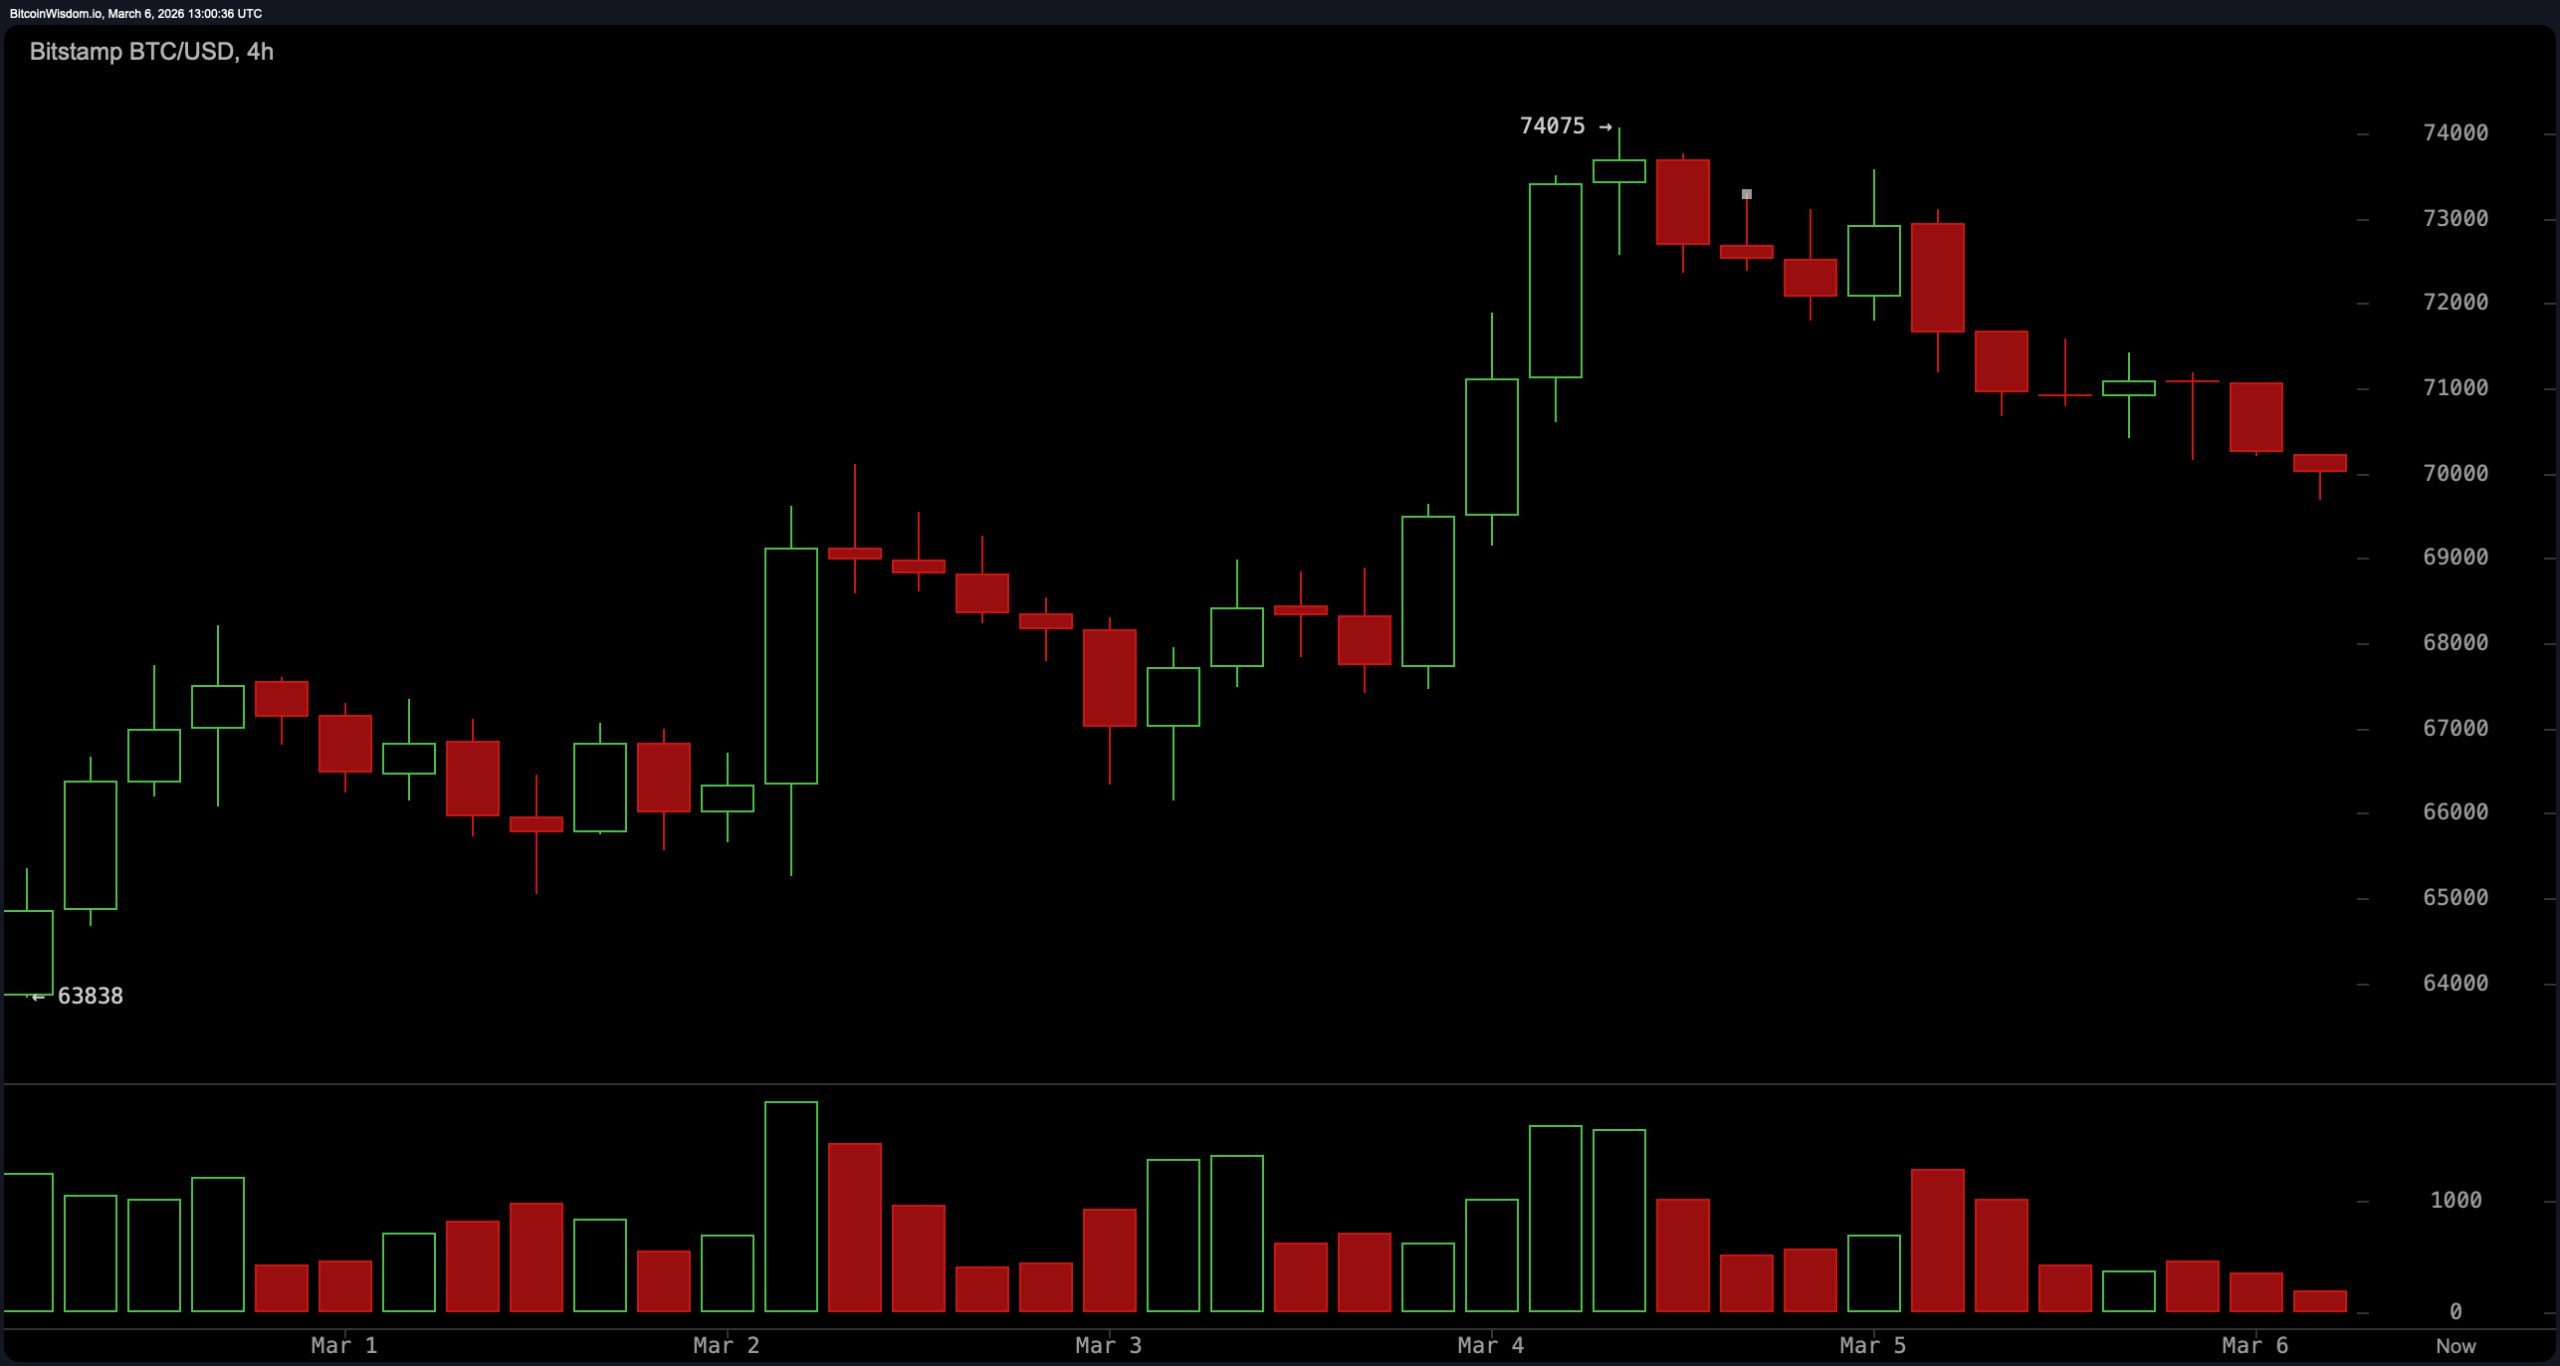
Zooming into the four-hour bitcoin chart shows the intermediate swing structure losing some steam. Price previously rallied from about $68,000 to $74,000 before encountering rejection and forming a sequence of lower highs. That pattern suggests fading upward momentum as the market drifts back toward the $70,000 zone. Key resistance remains around $73,500 to $74,000, while nearby support sits between $69,000 and $70,000, followed by another technical cushion near $67,000. If that $70K shelf fractures with momentum, liquidity likely sits waiting closer to the $67K region, which markets tend to explore with enthusiasm.
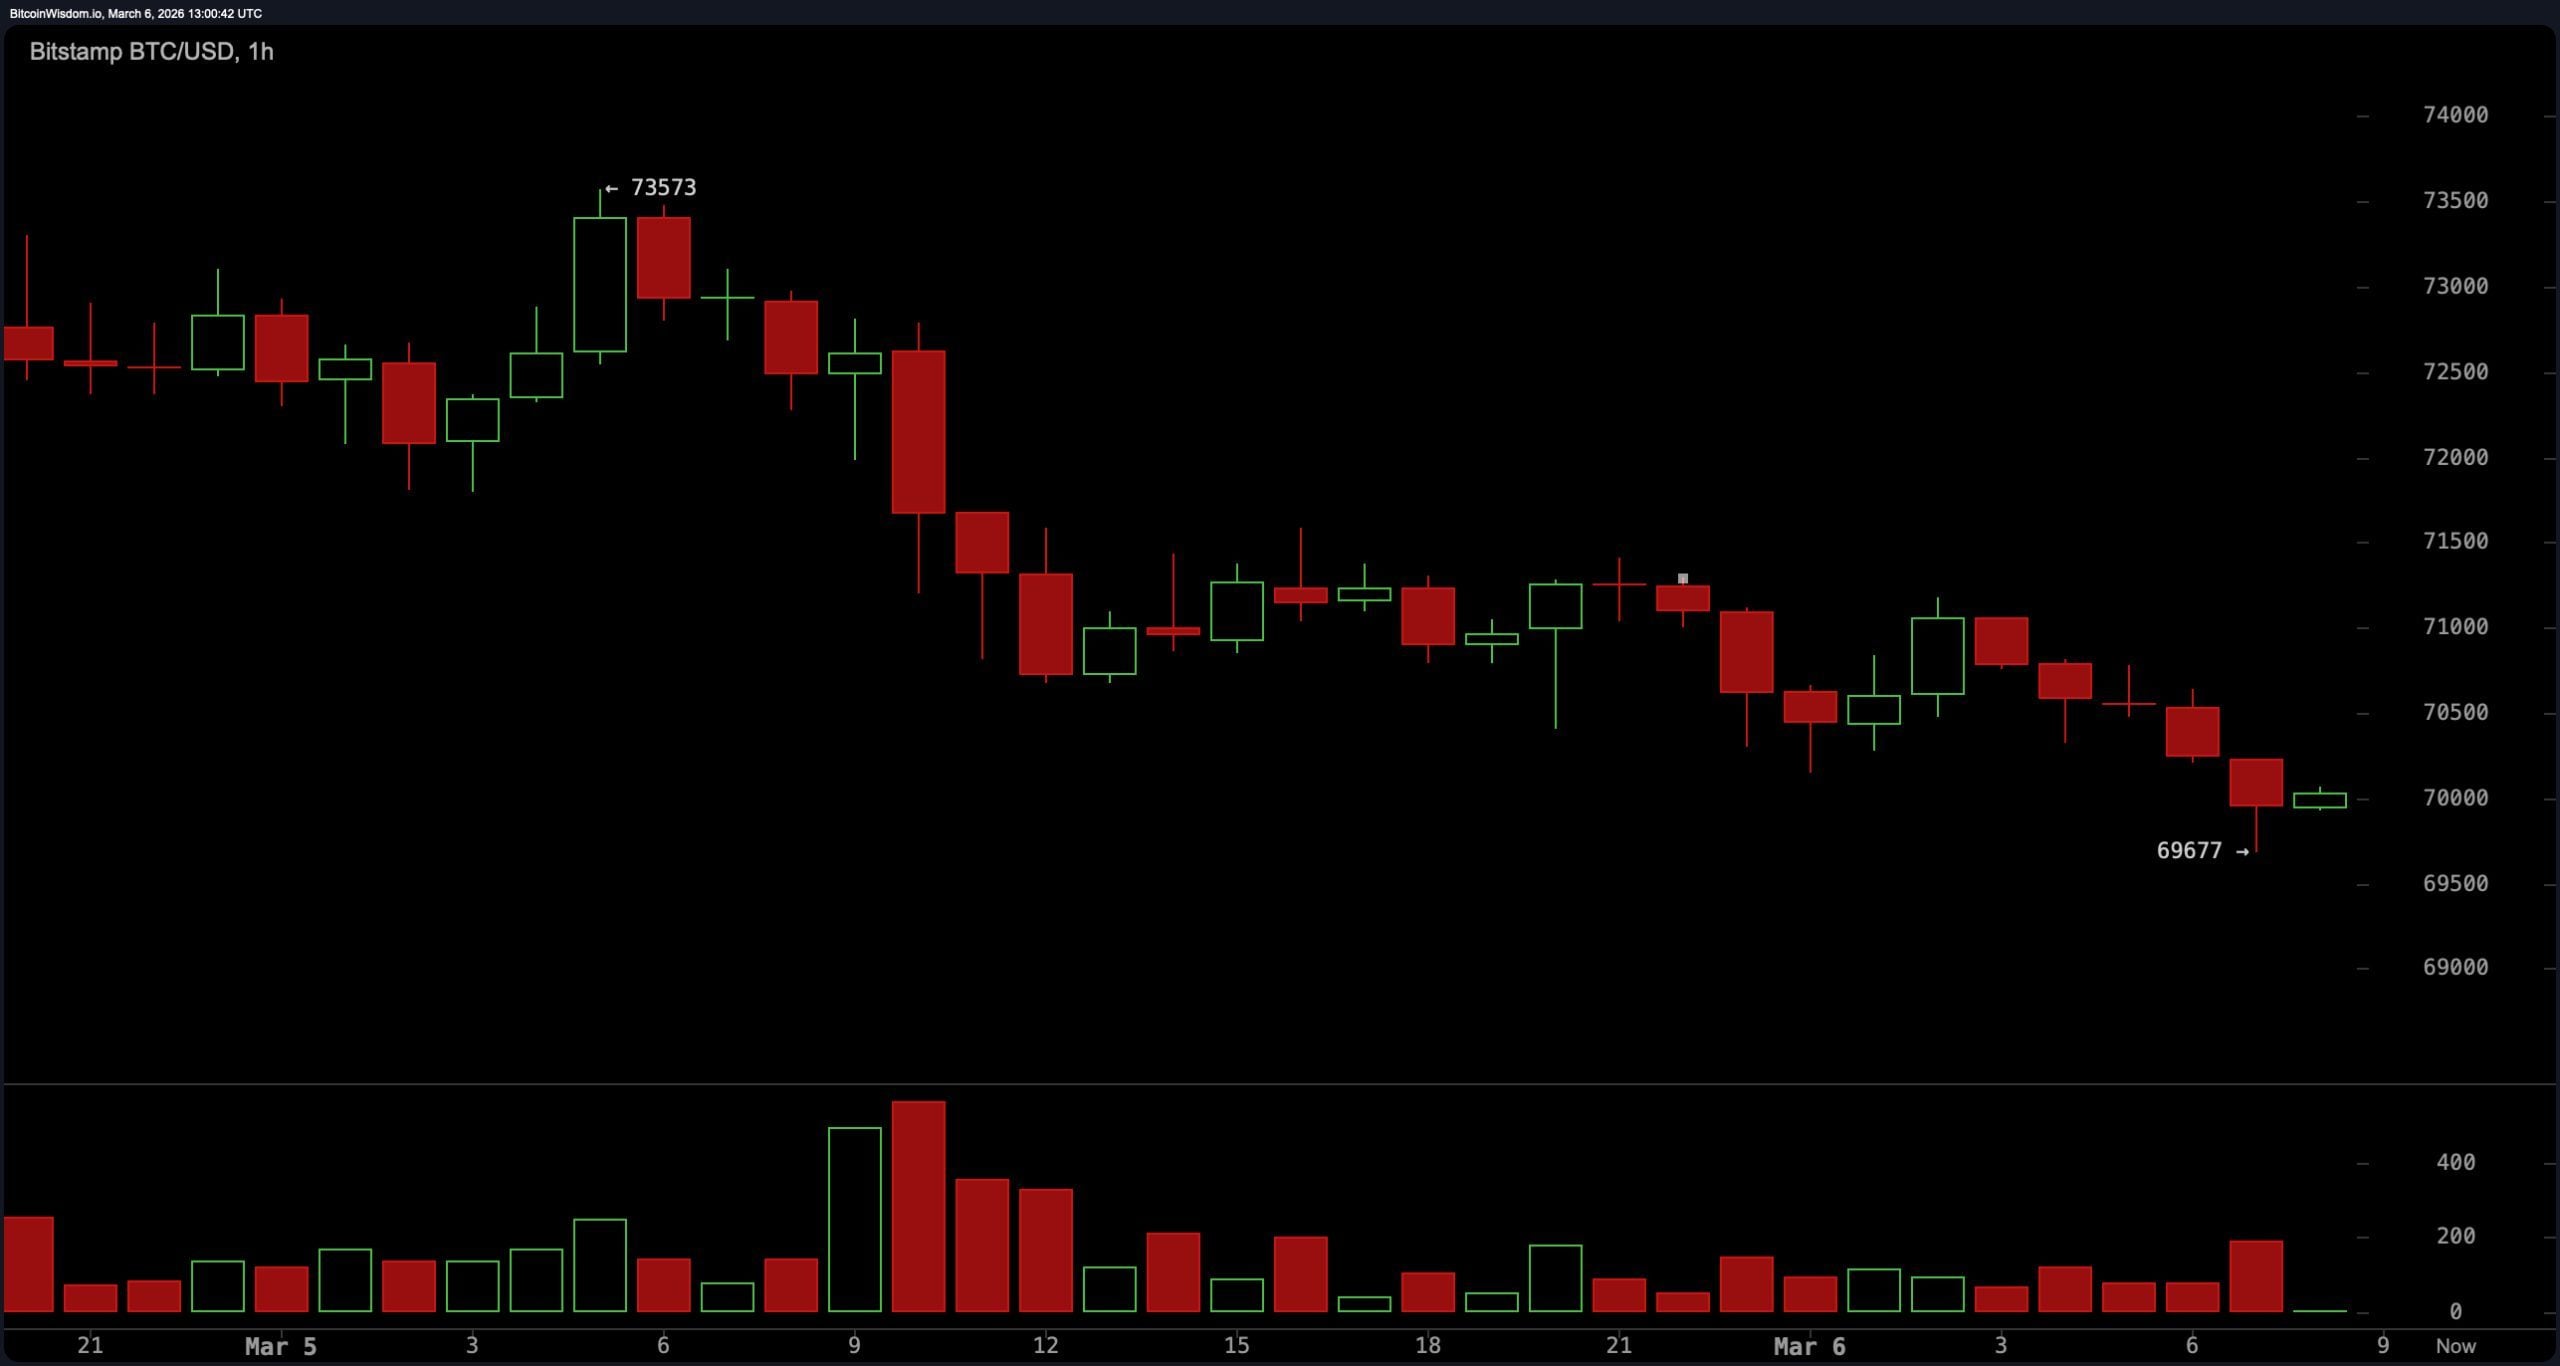
The one-hour bitcoin chart sharpens the picture further and shows a short-term bearish structure characterized by lower highs and lower lows. The most recent high printed near $73,500, while the price has since rotated down toward roughly $70,000, with a recent local low around $69,600. Momentum on this timeframe remains slightly negative, reinforcing the idea that the market is leaning downward in the very short term. That said, the $69,000 region remains the pivotal level: holding above it could allow a rebound toward $72,000 to $74,000, while a break could expose the $67,000 liquidity pocket.
Momentum indicators are delivering a mixed technical message. The relative strength index ( RSI) reads 50, reflecting neutral momentum. The Stochastic oscillator today sits near 75, which is also neutral. The commodity channel index (CCI) prints 129 with a negative bias, while the average directional index (ADX) reads 38 with downside pressure indicated.
The Awesome oscillator registers 850 with a positive signal, whereas the momentum indicator at 5,952 tilts negative. Meanwhile, the moving average convergence divergence ( MACD) level at −1,072 shows a positive crossover signal. In other words, oscillators are arguing among themselves, which usually happens when the price is stuck inside a range.
Trend gauges from moving averages (MAs) reveal a similarly split landscape. Short-term averages lean constructive, with the exponential moving average (10) at $69,001, simple moving average (10) at $68,486, exponential moving average (20) at $69,125, and simple moving average (20) at $67,782, all indicating upward pressure relative to the current price.
Okay, so I’ve been looking at the moving averages, and things are a little mixed. My 30-day exponential average just dipped below current prices, around $70,572, which is a short-term bearish signal. The simple moving average is still positive, though, at $67,975. But here’s the bigger picture: all the longer-term averages – 50, 100, and 200-day – are way up above current prices, and they’re all trending downwards. Basically, we’re seeing some stabilization around $70,000 in the short term, but there’s still a significant downtrend looming overhead. It suggests the longer-term trend is still very much in control.
Bull Verdict:
If bitcoin continues to defend the $69,000 support zone, the technical setup favors a rebound toward $72,000 and potentially a retest of the $73,000–$74,000 resistance band. Short-term moving averages remain supportive, the moving average convergence divergence ( MACD) shows a positive signal despite negative territory, and the awesome oscillator is also flashing upward momentum. In a range-bound market, strong support often acts like a springboard; hold the floor long enough and price typically makes another run at the ceiling.
Bear Verdict:
If bitcoin loses the $69,000 level with momentum, the chart structure suggests a move toward the $67,000 liquidity area and possibly a deeper probe of the $65,000 support zone. The one-hour chart already shows lower highs and lower lows, the commodity channel index (CCI), average directional index (ADX), and momentum indicator lean negative, and several higher-timeframe moving averages remain above price. Translation: if the floor cracks, gravity tends to do the rest.
FAQ 🧭
- What is bitcoin’s price on March 6, 2026?
Bitcoin is trading around $69,926 after moving within a $69,732–$72,956 intraday range. - What are the key bitcoin support and resistance levels right now?
Technical charts show support near $69,000 and $65,000, with resistance around $73,000–$74,000. - Is bitcoin trending up or down in the short term?
Short-term charts show slightly bearish momentum with lower highs and lower lows on the 1-hour timeframe. - What could move bitcoin’s price next?
A break above $73,000 could push price toward $78,000, while losing $69,000 may open the door to $67,000 or $65,000.
2026-03-06 17:27