Bitcoin is having trouble breaking past the $82,000 mark as trading activity increases. Buyers are trying to gain enough traction to overcome a strong resistance level, but have been unsuccessful after three tries. The price is moving slowly, and analyst Axel Adler believes he’s found the reason for this resistance – it’s not just a technical issue, but also how traders are behaving that’s keeping the price down.
As a crypto investor, I’ve been looking at this chart, and it seems Bitcoin is currently stuck between a couple of key price levels. Around $77,900 is where recent buyers start to break even, and historically, that’s been a point where selling slows down because people don’t want to lock in losses. But on the upside, around $82,100 is a major resistance level – the 200-day moving average – and Bitcoin hasn’t been able to consistently break above that since April. It feels like we’re in a tight spot until we see a decisive move past either of those points.

Bitcoin has tried to rise above $82,100 three times in recent weeks, but each attempt failed and the price fell back down. These rallies weren’t supported by strong buying pressure – trading volume didn’t increase significantly – suggesting there wasn’t enough demand to overcome the existing sellers at that price level. Essentially, the price hit a ceiling and lacked the momentum to break through.
The $82,100 price level is proving to be a strong barrier. Adler’s research explains why it’s stopped price increases three times already, and identifies what conditions would need to shift for the next attempt to break through it.
The Resistance at $82K Is Not Just a Line on a Chart. It Is a Behavior
Adler’s latest chart helps explain why Bitcoin has repeatedly failed to break through the $82,100 resistance level. The Short-Term Holder SOPR, an indicator of whether recent buyers are profitable or taking losses, has bounced back from a low point in February 2026, but hasn’t consistently stayed above the point where those buyers break even.
As I’ve been tracking Bitcoin, I’ve noticed a consistent pattern. Every time the price tries to go up, the Spent Output Profit Ratio (SOPR) will briefly approach 1.0, but then quickly drops back down. What this tells me is short-term holders are consistently using any price increase as an opportunity to sell and break even, rather than holding on hoping for further gains.

Adler points out a clear connection between Bitcoin’s price chart and its SOPR (Spent Output Profit Ratio) data. Each time the price tried and failed to break through a key resistance level, the SOPR showed a matching pattern: a quick rise towards 1.0, immediately followed by a drop. This isn’t just happening by chance; it’s the same thing occurring repeatedly. When Bitcoin nears $82,100, short-term holders who previously bought at a higher price finally reach a point where they can sell without a loss. This surge of selling offsets the buying interest pushing the price up, ultimately stopping it from breaking through the resistance.
According to Adler, a clear sign that the recent market pattern is changing is when the seven-day SOPR average stays above 1.0 for multiple days in a row. This would indicate that short-term holders are no longer selling during price increases, but are instead holding onto their investments through those gains. Until this shift in behavior is observed, attempts to reach $82,100 will likely continue to face the same selling pressure that has halted previous advances.
Bitcoin Holds Above Key Moving Averages While Facing Heavy Resistance
Bitcoin is currently trading around $80,400. It recently tried to break past $82,000 but faced resistance, meaning that price level is proving difficult to surpass. Looking at the daily chart, Bitcoin’s overall trend still looks positive, as the price remains above its 100-day moving average. It’s now trying to stabilize below the 200-day moving average, which is around the recent high.
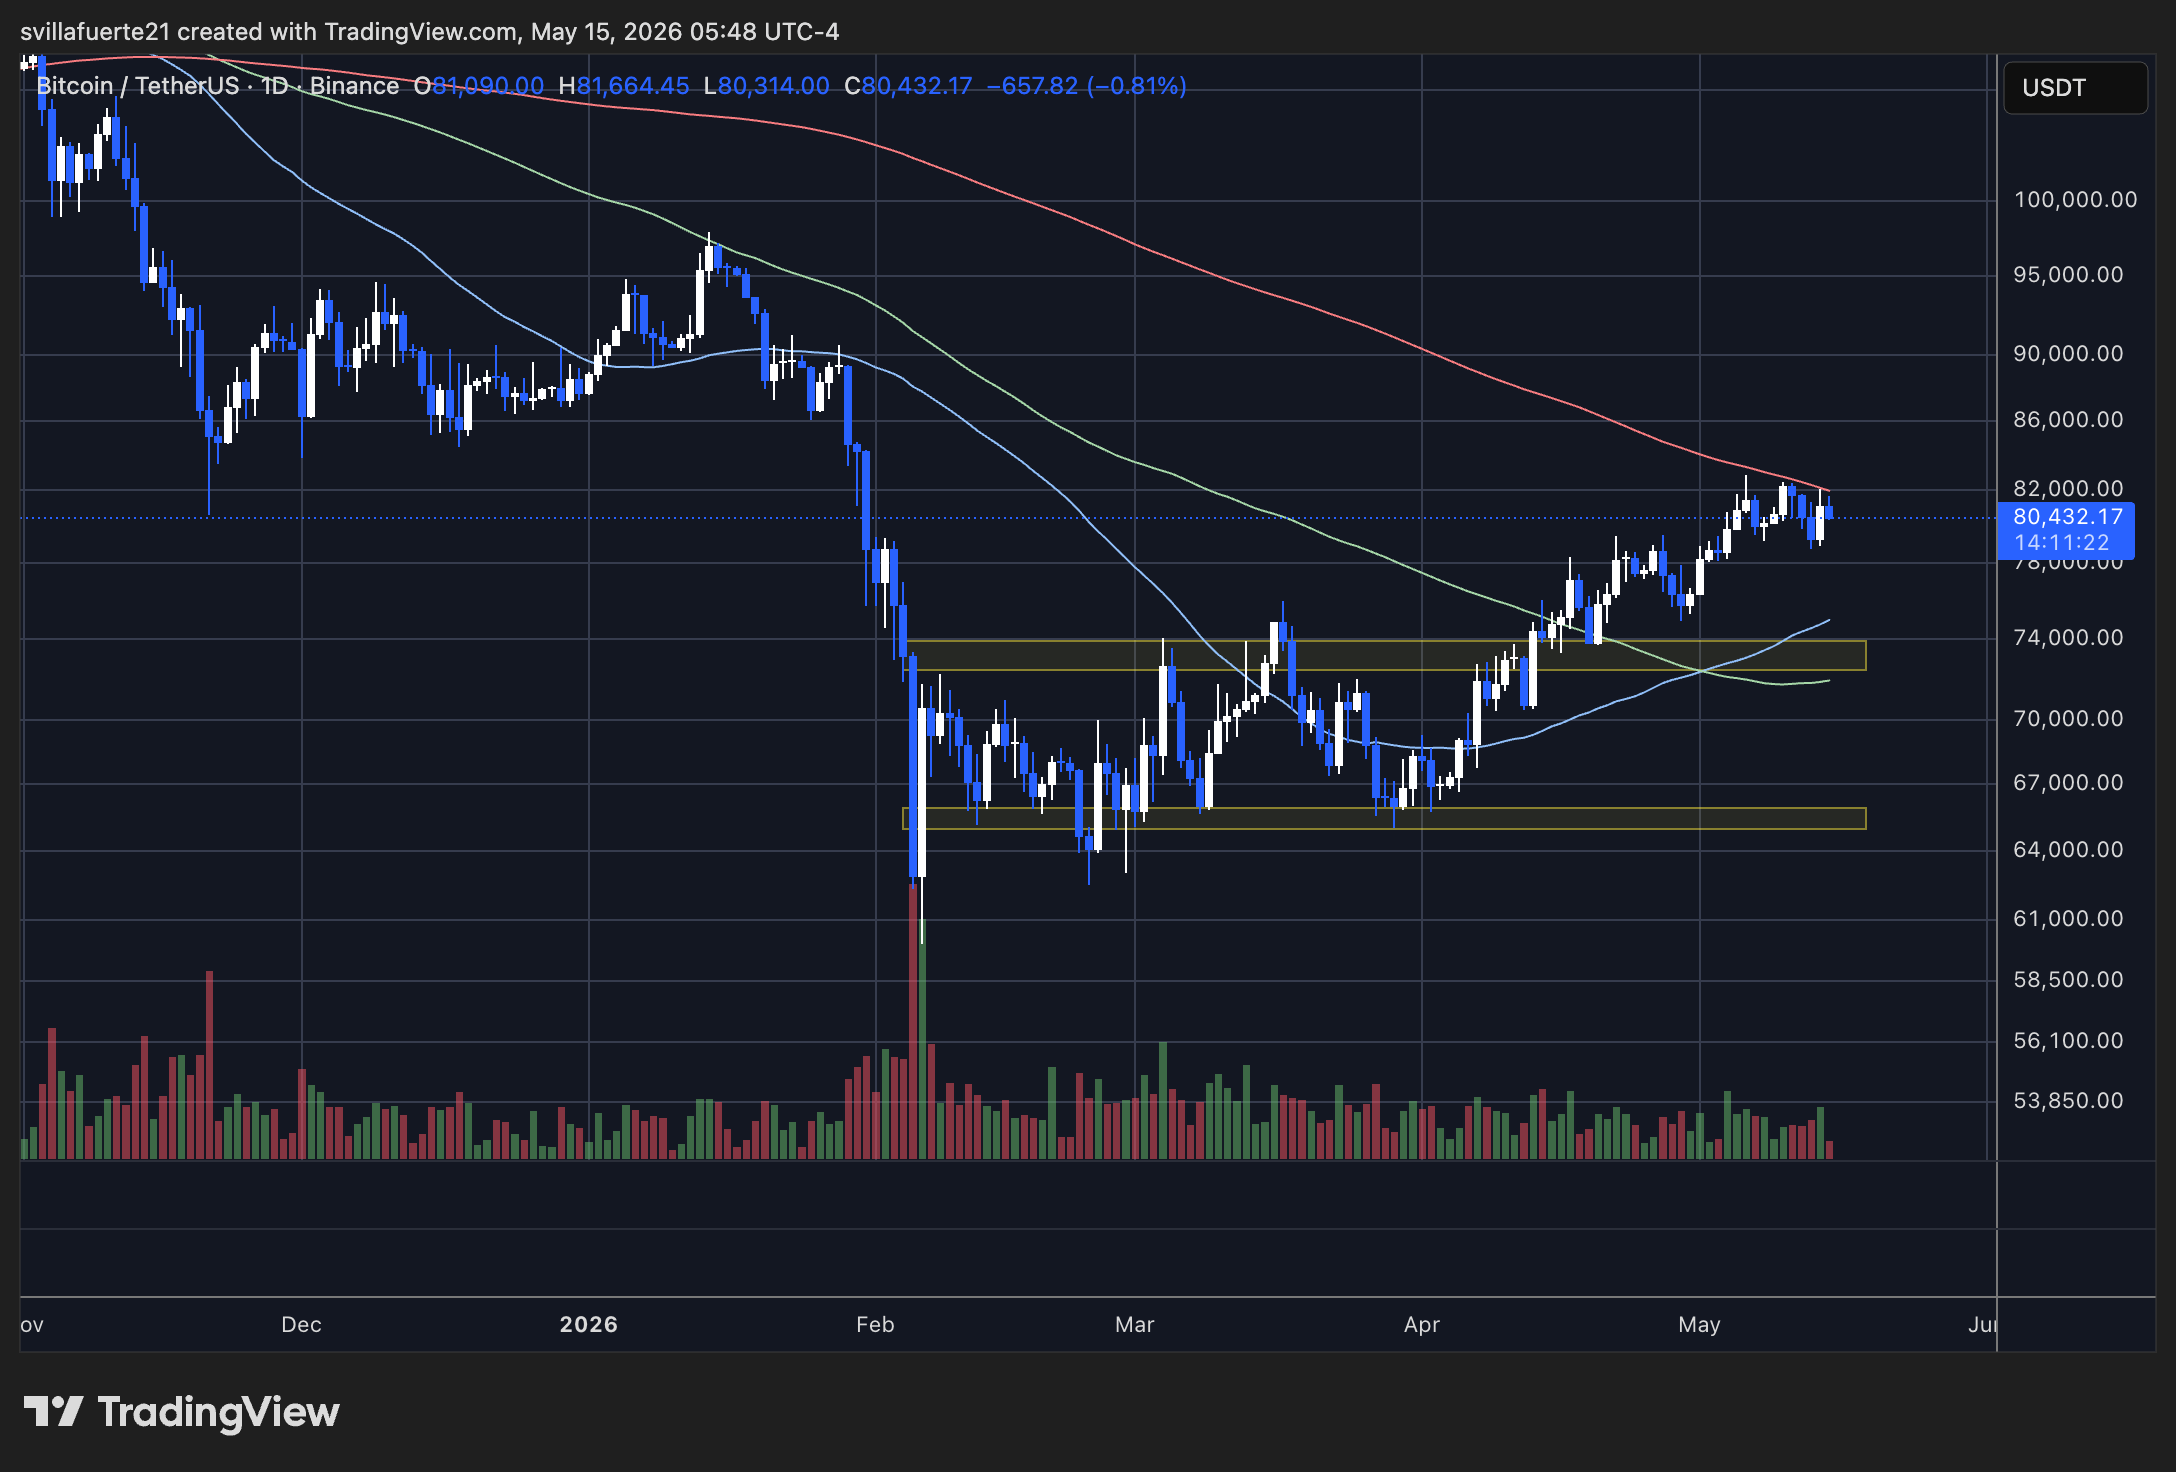
The chart shows Bitcoin has bounced back strongly after a sharp drop in February, which briefly brought its price down to around $60,000. Since then, the price has been consistently making higher highs and higher lows, suggesting growing demand and a healthier market. However, Bitcoin’s upward momentum seems to be weakening as it nears a major resistance level around $82,000.
Trading volume hasn’t increased much during recent attempts to break higher, indicating that buyers aren’t yet strongly committed to pushing the price above the 200-day moving average. Key support levels to watch if the price falls further are between $72,000 and $73,000, and between $64,000 and $65,000, as these areas could attract buying interest.
Bitcoin is currently stabilizing below a key resistance level while still showing signs of a positive upward trend. This suggests a major price movement – either up or down – could happen in the next few weeks.
2026-05-16 01:00