Ah, XRP, the cryptocurrency that dances like a bear with two left feet. On October 12, 2025, at 11:50 a.m., it stumbled to $2.49, its market cap a mere $148.7 billion, and its 24-hour trading volume a paltry $8.49 billion. It wobbled between $2.32 and $2.52 intraday, while its weekly range stretched from $2.32 to $3.05-a yawn-inducing performance, if ever there was one.
XRP Price and Chart Outlook: A Tale of Hesitation and Indecision 😓
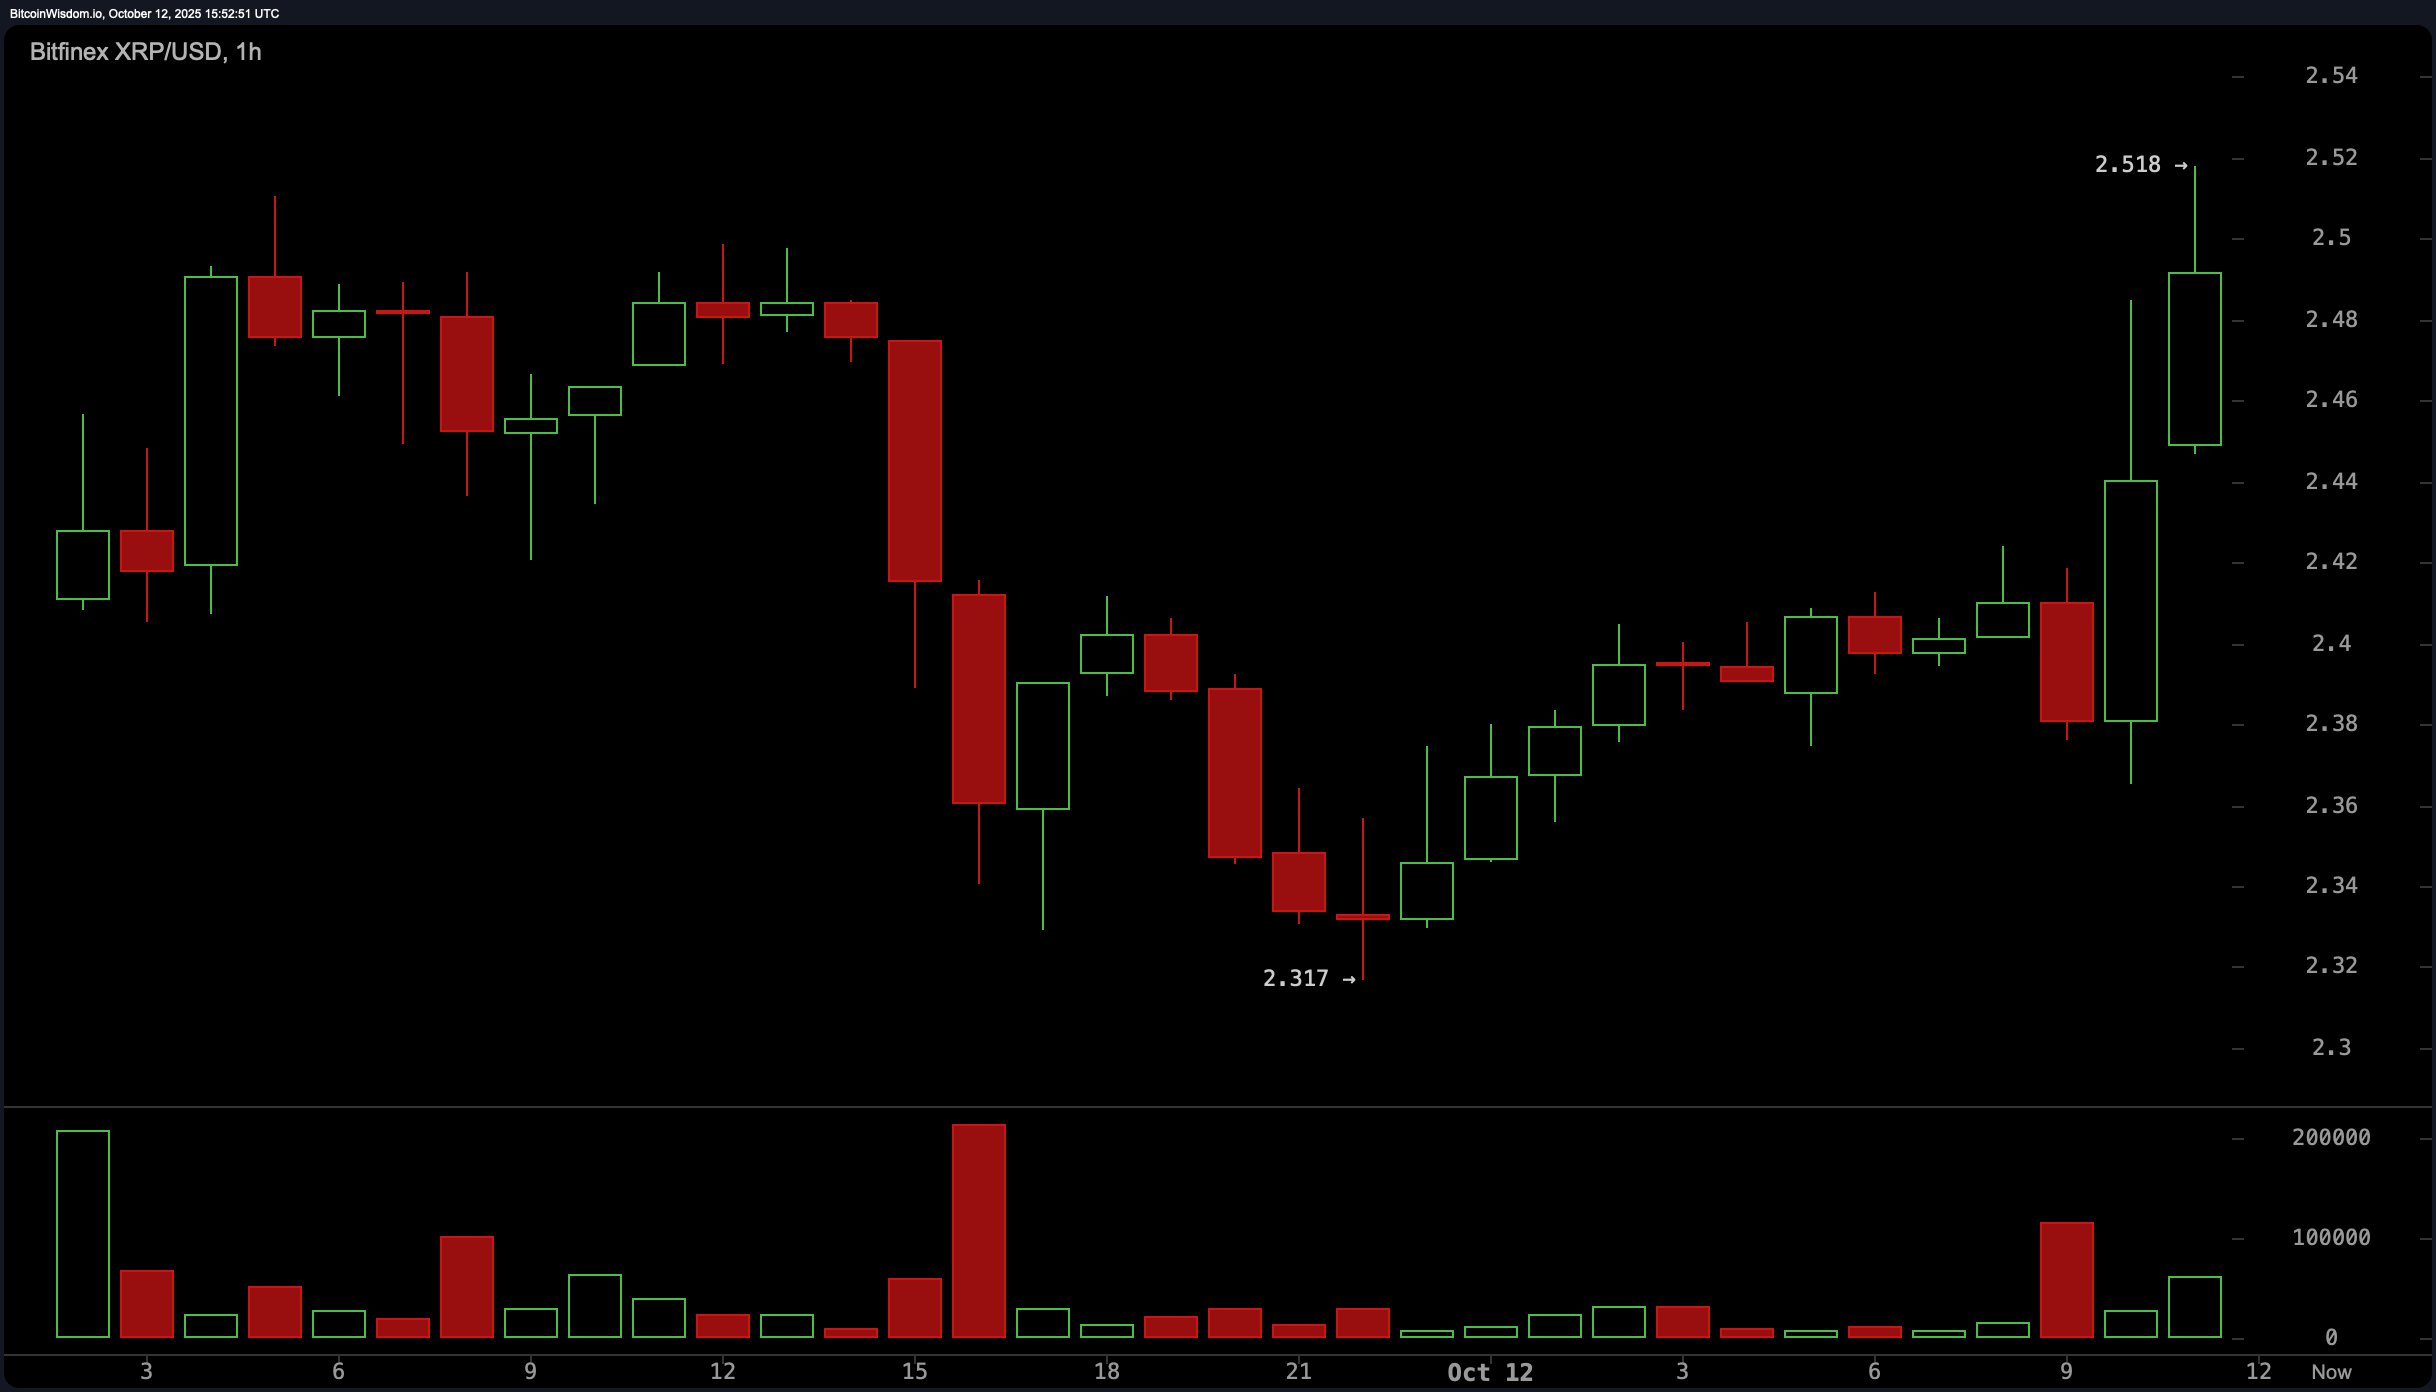
The 1-hour chart for XRP is a masterpiece of indecision, a ballet of lower highs and lower lows. It’s consolidated between $2.35 and $2.50, as if it’s waiting for a bus that may never come. Trading volume? Shrinking faster than a cheap suit in the rain. Narrow-range candles? Oh, they’re there, whispering sweet nothings of apathy. Swing positions? Avoid them like a bad first date.
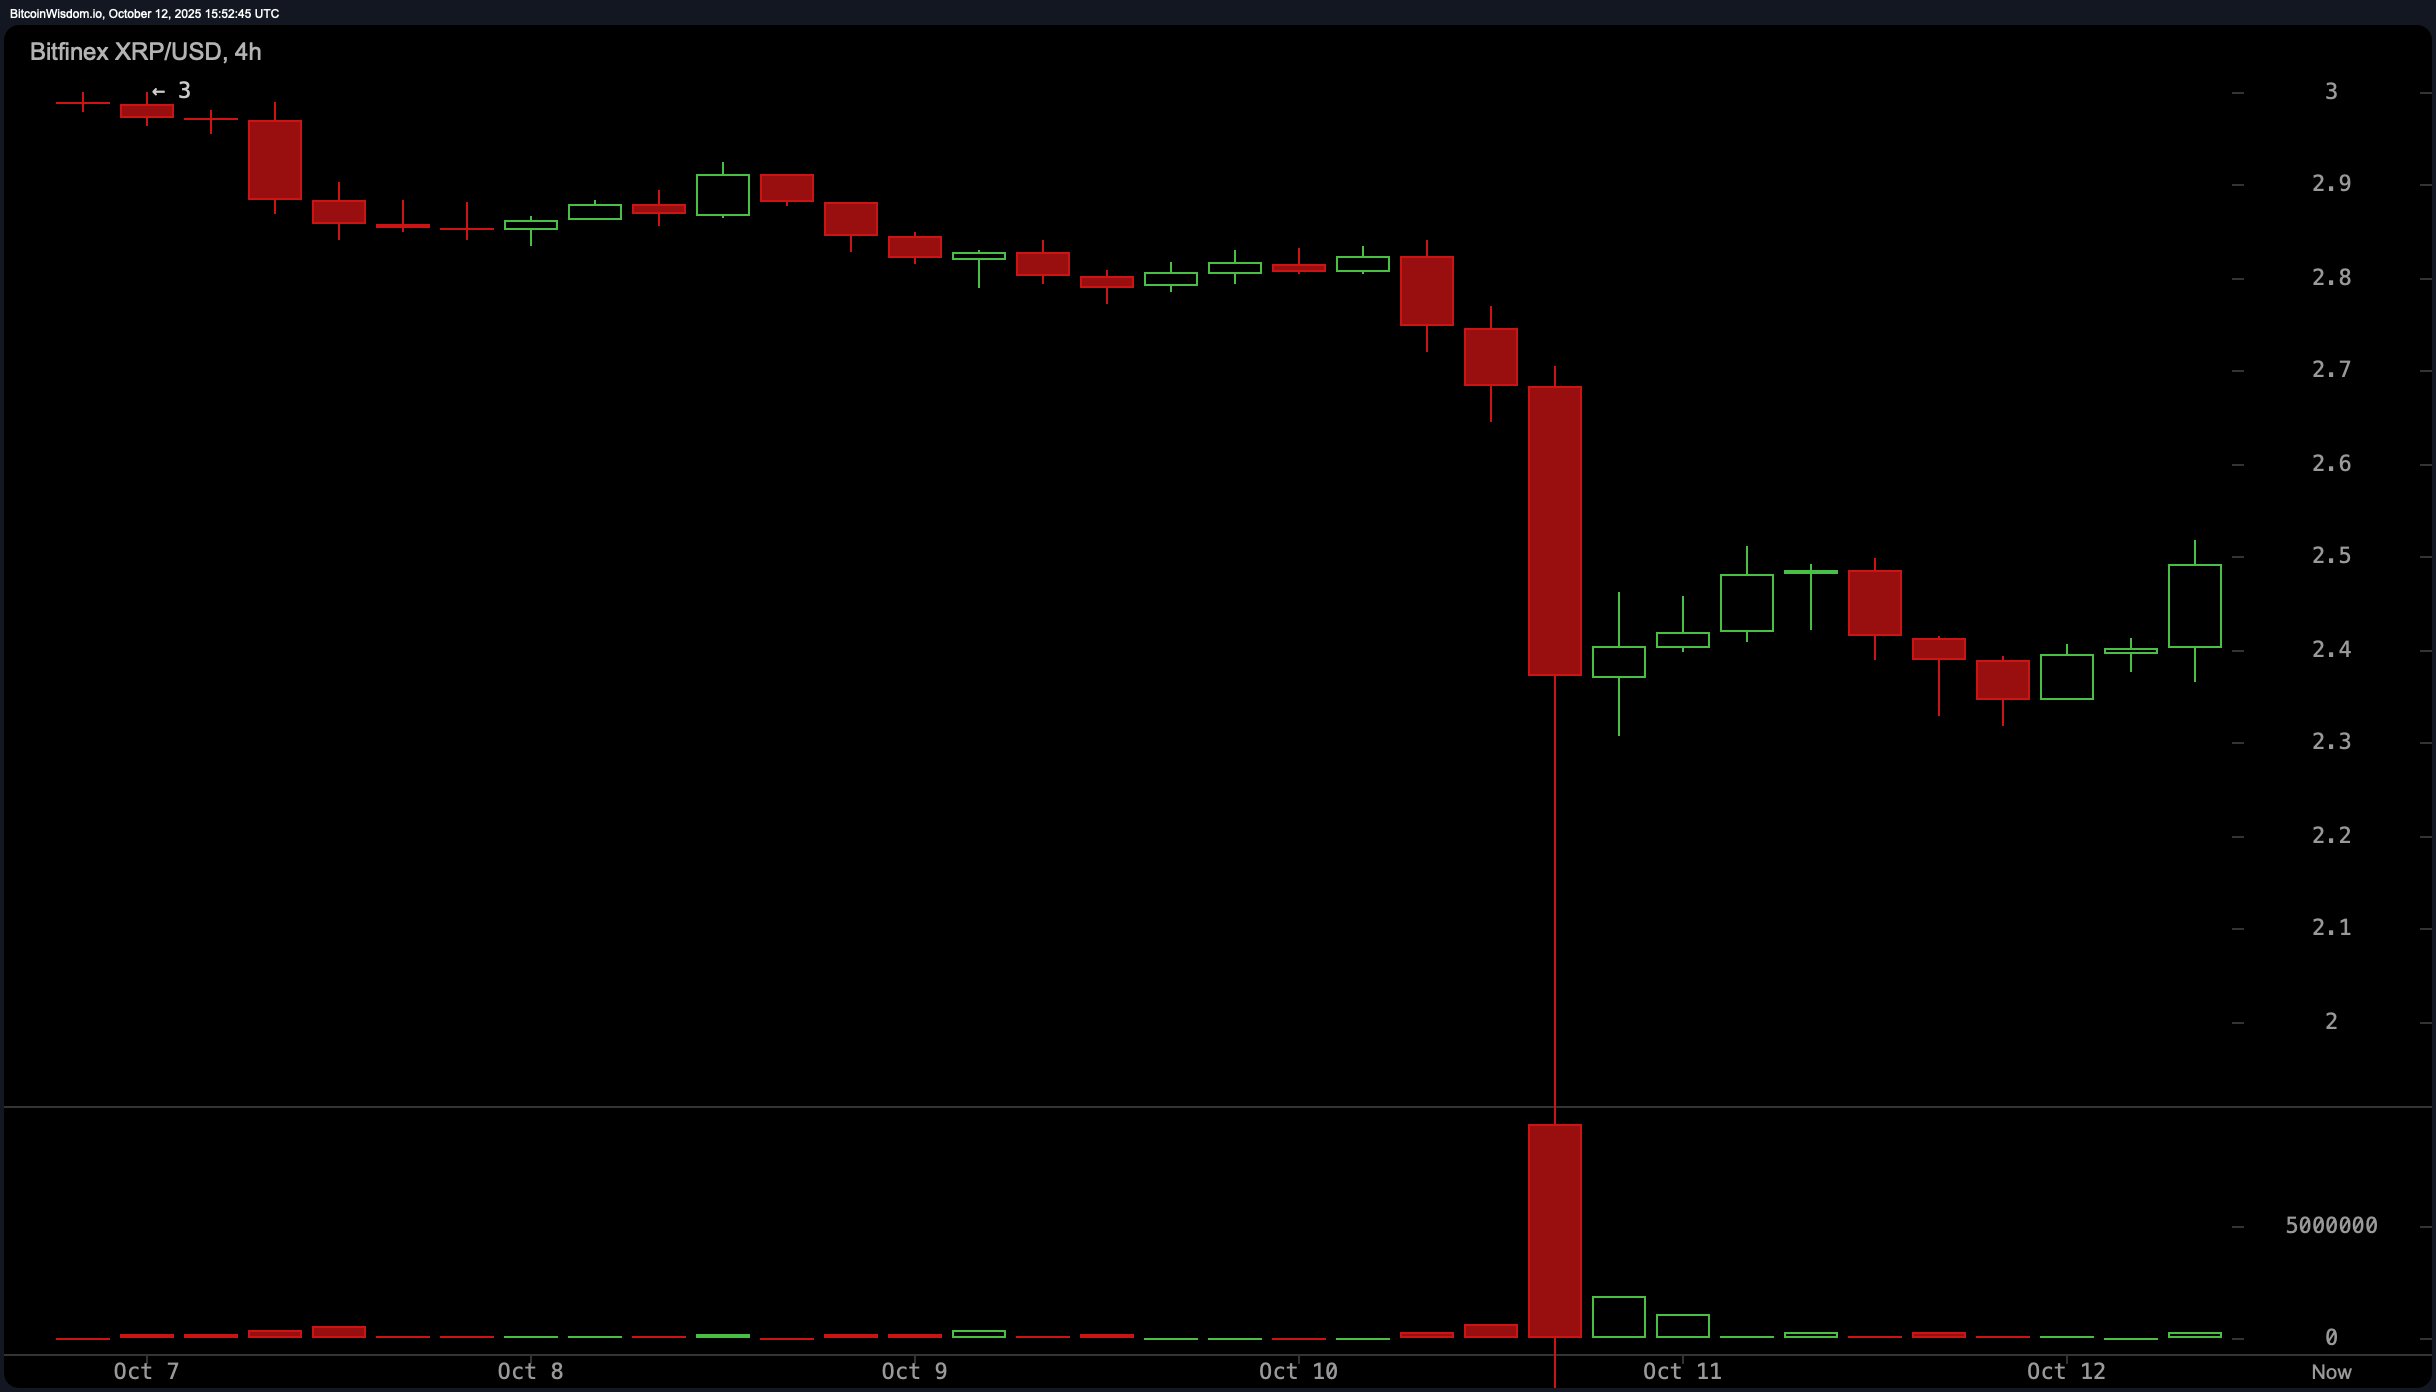
On the 4-hour chart, XRP’s trajectory is as inspiring as a wet noodle. It’s stabilizing around $2.49 after a half-hearted recovery attempt, but bullish momentum? As absent as a sense of humor in a tax audit. Sell-side volume surged like a teenager at a buffet, and now it’s tapering off-a market shrugging its shoulders. A close above $2.60 with volume could signal a reversal, but don’t hold your breath. Below $2.30? Expect a trip to $2.15 or even $2.00. Life’s tough, isn’t it?
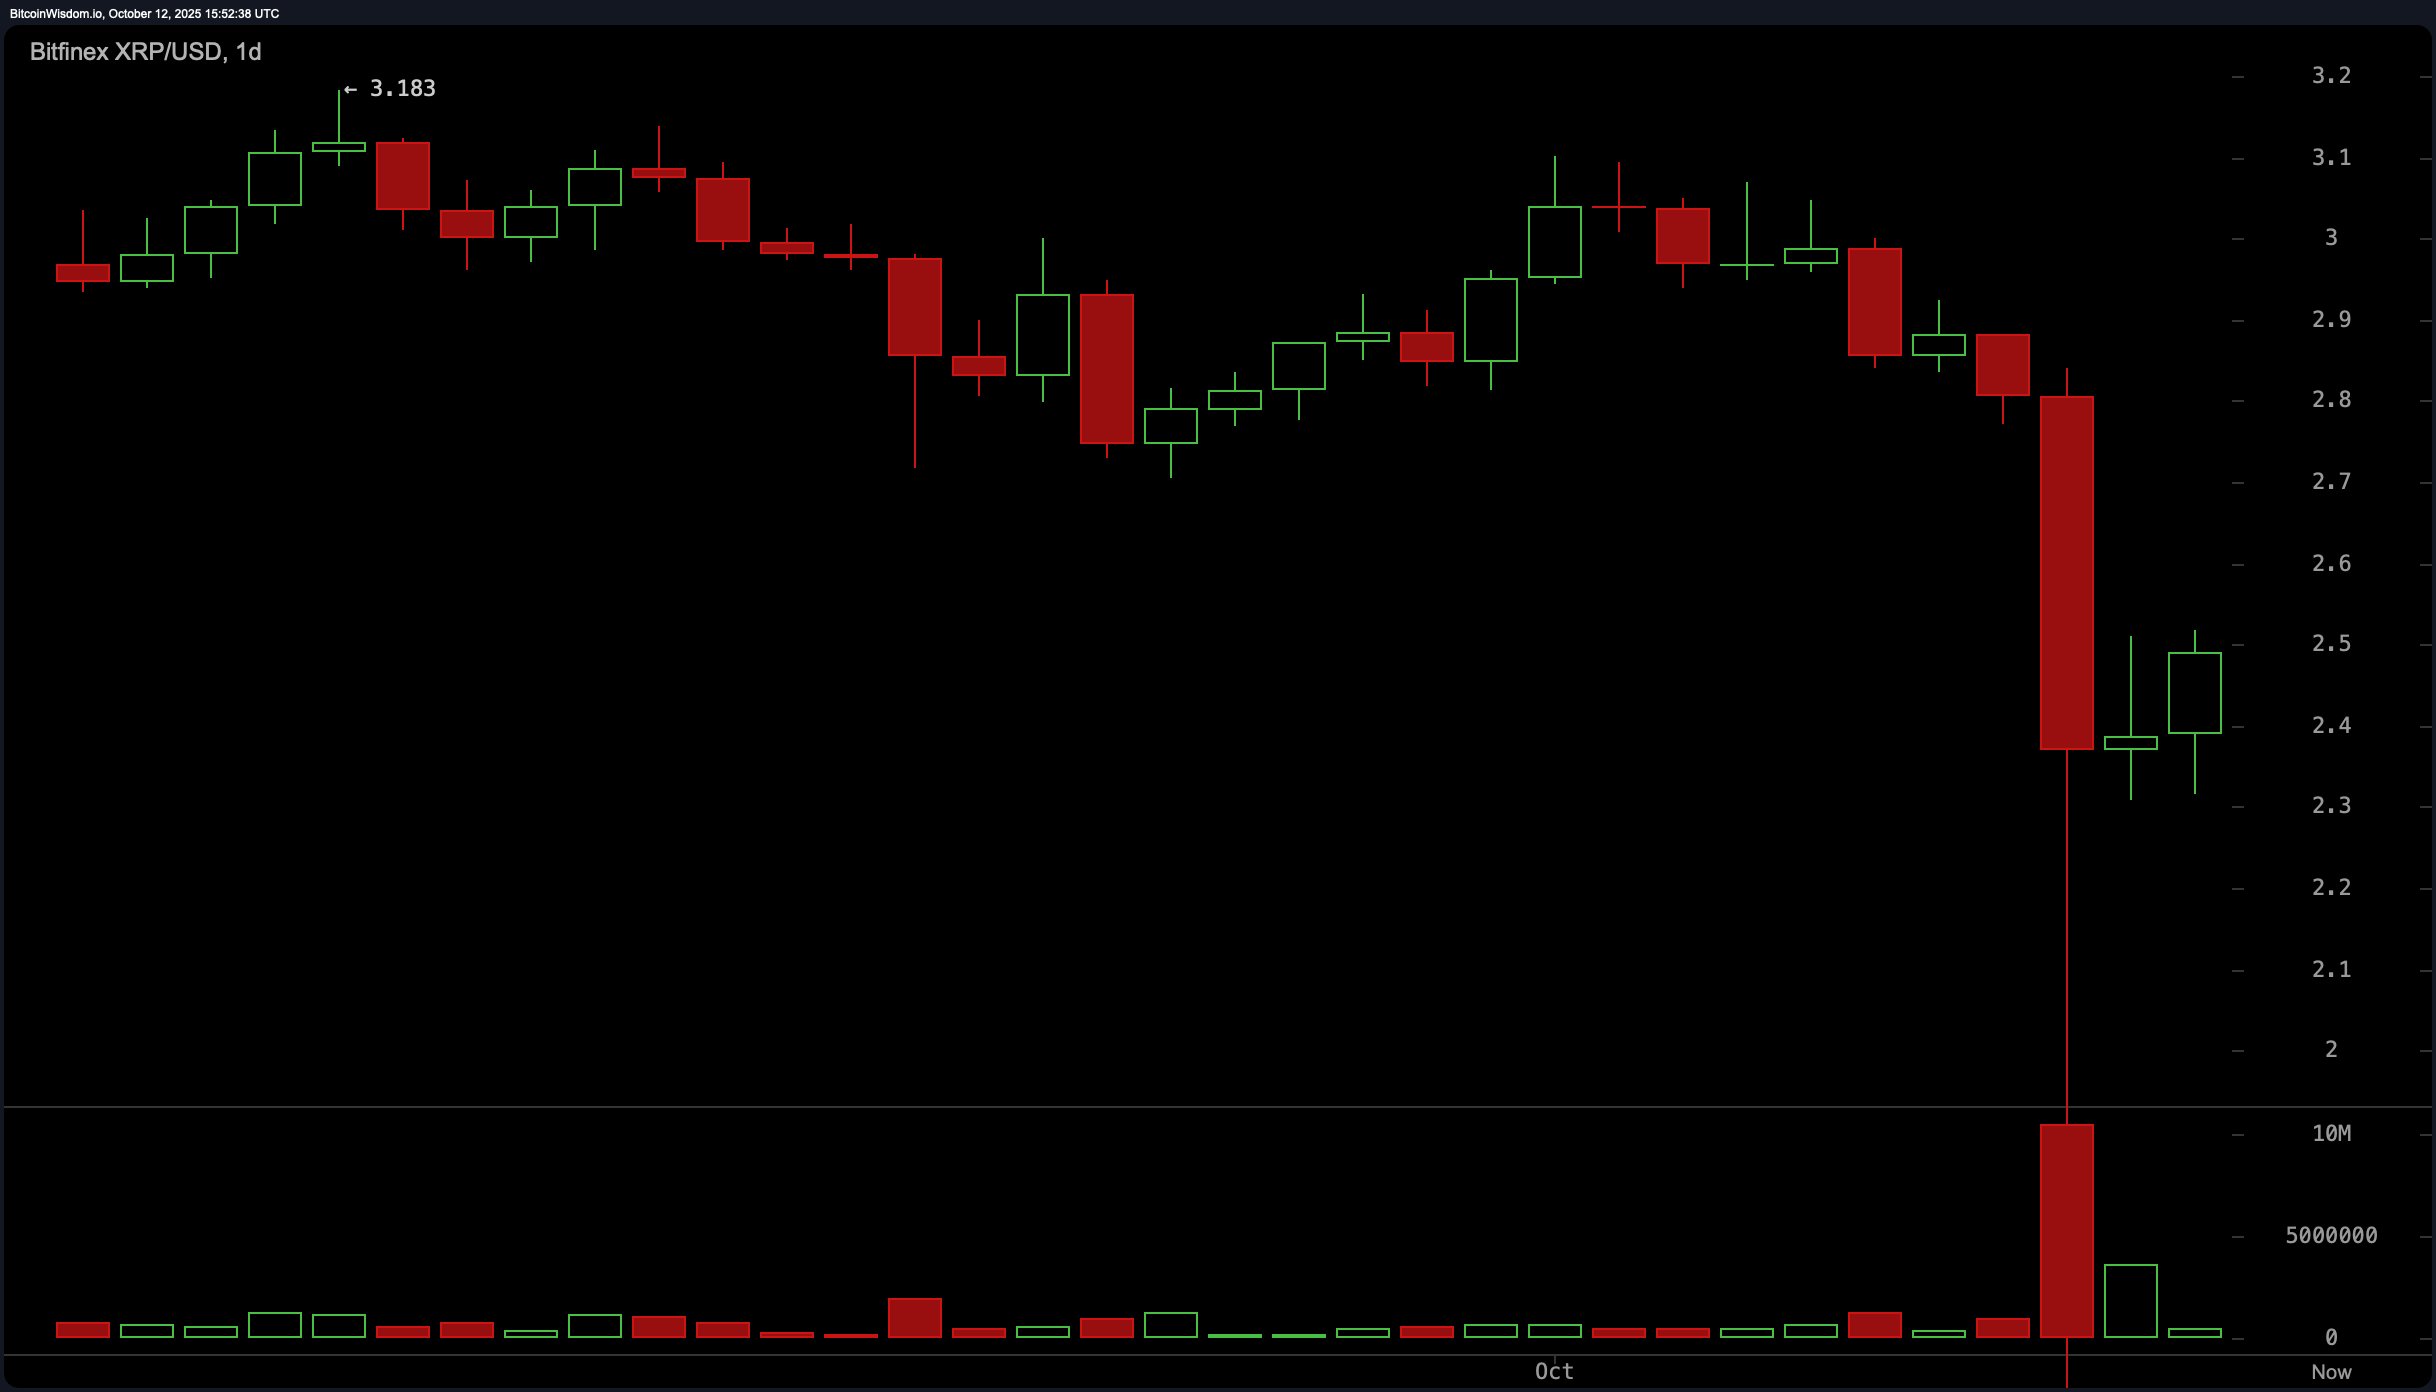
The daily chart? A tragedy in three acts. After peaking near $3.19, it plummeted like a forgotten balloon, breaching $2.80 with a high-volume red candle. A minor bounce, but follow-up volume? As weak as a kitten’s meow. Traders, stay on the sidelines unless $2.60 is breached with gusto. Short opportunities? They might emerge if it revisits $2.70-$2.80 and fails-again.
Oscillators are as cautious as a cat in a room full of rocking chairs. RSI at 26.77? Oversold, but no direction. Stochastic at 52.34? Neutral, like Switzerland. CCI at -199.36? Undervalued, perhaps, but who’s buying? ADX at 24.55? Weak trend, weak tea. Awesome Oscillator at -0.36? Not awesome. Momentum at -0.67? Downside inertia. MACD at -0.11? Weakening momentum. It’s a symphony of meh.
Moving averages are all pointing down, like a chorus of doom. EMAs and SMAs across the board are above the current price, reinforcing the bearish trend. It’s a funeral march, and XRP is the guest of honor.
Bull Verdict: 🌈✨
For the eternally optimistic, a breakout above $2.55-$2.60 on strong volume could signal a recovery. Reclaiming $2.60-$2.80 might validate upward momentum, leading to a retest of $2.90-$3.00. But let’s be honest-that’s about as likely as a snowball surviving in hell.
Bear Verdict: 🐻⚰️
For the realists, XRP’s inability to hold above $2.50, coupled with weak indicators, suggests further downside. A close below $2.30 could open the gates to $2.15 or even $2. It’s a slow descent into the abyss, with no parachute in sight.
🧠 FAQ
- ❓Why is XRP showing bearish signals right now?
Because it’s as directionless as a tourist without a map. Lower highs, weak momentum, and shrinking volume-buyers are as scarce as honesty in politics. - ❓What key price levels should XRP traders watch next?
Above $2.60? Maybe a rebound. Below $2.30? A freefall to $2.15-$2.00. Choose your adventure wisely. - ❓Are there any opportunities for short-term XRP traders?
Scalpers might nibble between $2.30-$2.40, but it’s like dancing on a tightrope-thrilling, but one wrong step… - ❓What’s the overall market sentiment for XRP?
Bearish, like a Monday morning. Moving averages and momentum indicators are singing the same sad song across all time frames.
Read More
- Clash Royale Best Boss Bandit Champion decks
- Vampire’s Fall 2 redeem codes and how to use them (June 2025)
- Mobile Legends January 2026 Leaks: Upcoming new skins, heroes, events and more
- World Eternal Online promo codes and how to use them (September 2025)
- How to find the Roaming Oak Tree in Heartopia
- Best Arena 9 Decks in Clast Royale
- Clash Royale Season 79 “Fire and Ice” January 2026 Update and Balance Changes
- Clash Royale Furnace Evolution best decks guide
- Clash Royale Witch Evolution best decks guide
- Best Hero Card Decks in Clash Royale
2025-10-12 20:31