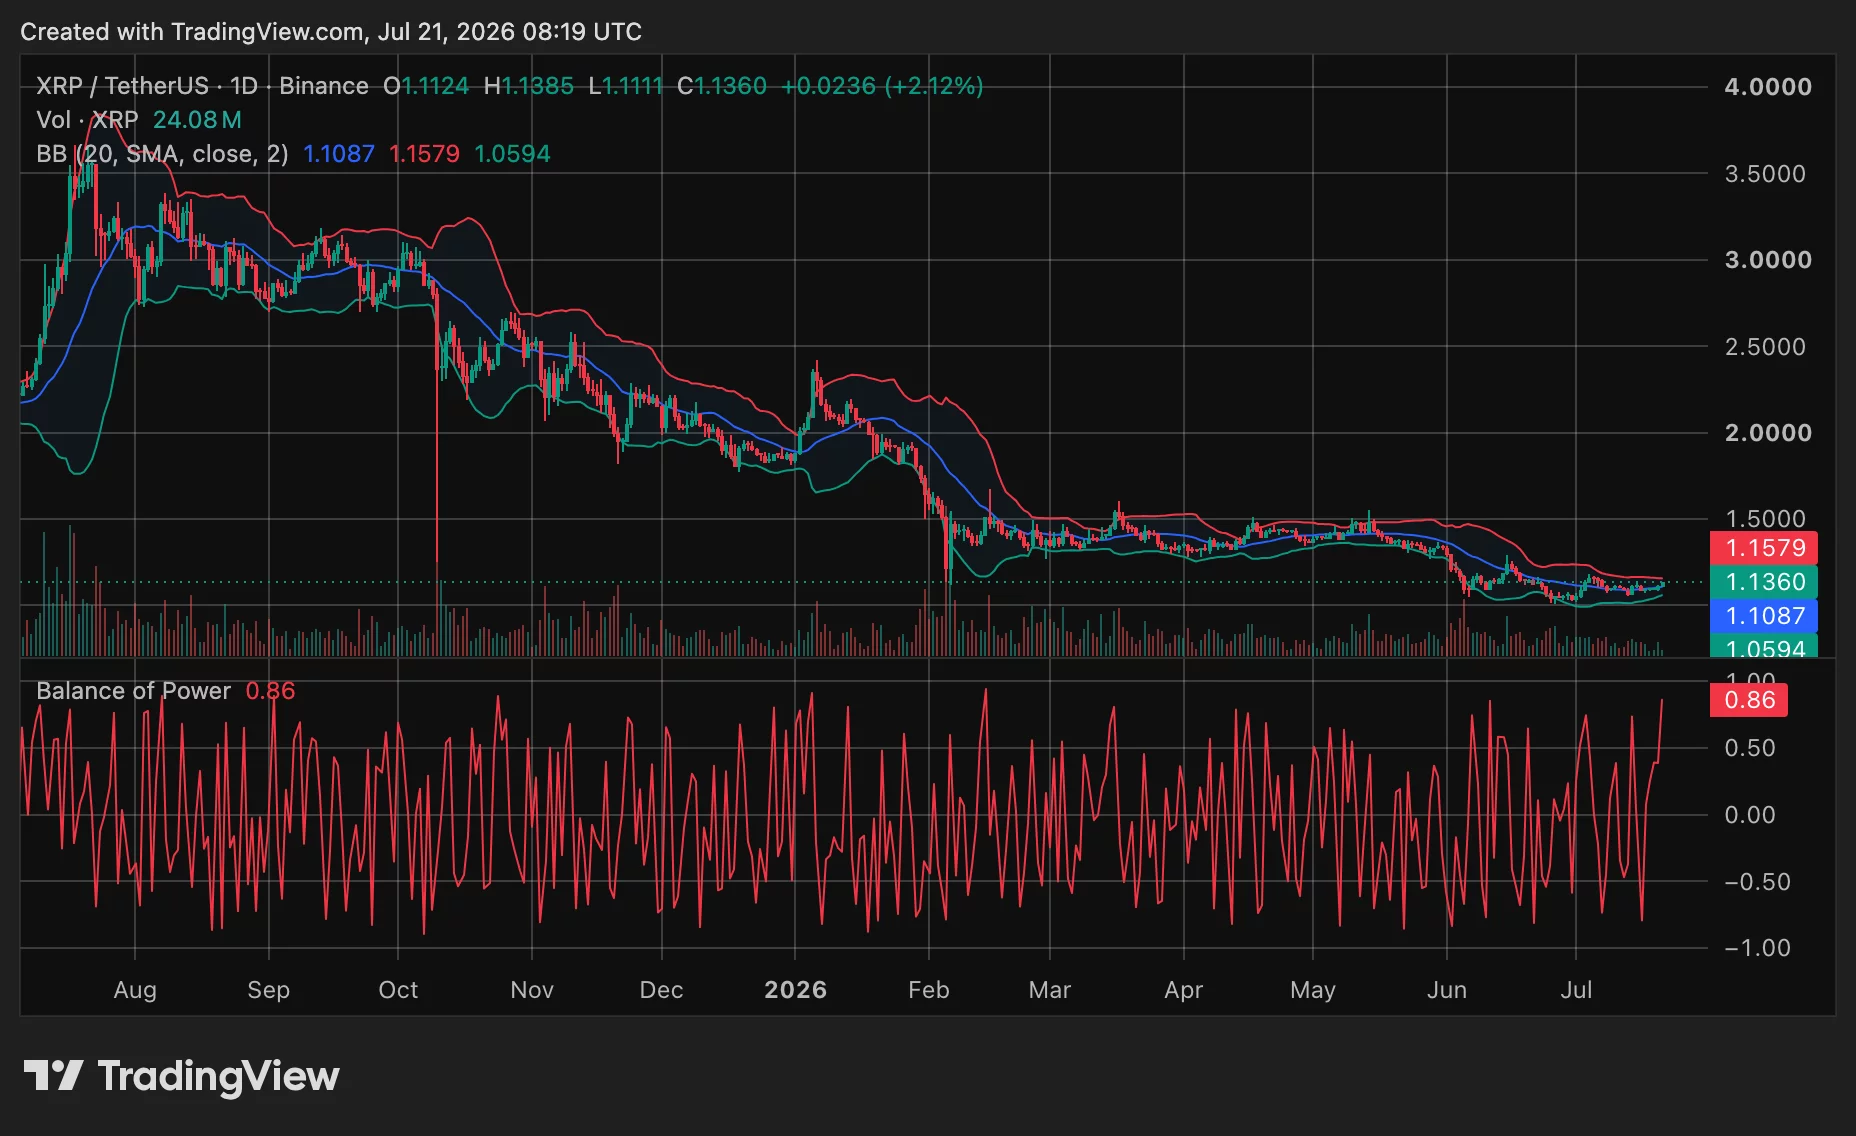
On Tuesday, Ripple‘s cryptocurrency climbed back towards $1.13 as investors stepped in to support prices between $1.08 and $1.10, attempting to build on a recent upward trend.
Summary
- XRP reclaimed $1.13 as short-term momentum improved, though its broader descending channel remains firmly intact.
- Spot XRP ETFs added $2.49 million, extending institutional demand despite persistent weakness in the token.
- Analysts see $1.35 upside after breakout confirmation, while longer-term resistance keeps downside risks clearly active.
At press time, crypto.news market data showed XRP near $1.13, up about 4.1% over 24 hours.
The price has recently shown some positive movement, but the overall trend is still concerning. It’s currently moving within a pattern that tends to restrict gains. This creates a mixed signal – we could see a short-term increase, but it’s too early to say if the long-term direction is changing towards an upward trend.
XRP tests $1.13 as traders watch $1.35
According to crypto analyst Ali Martinez, XRP is showing promising signs on its price charts. A monthly analysis revealed a potential ‘buy’ signal, and an hourly chart indicates the price is stabilizing within a symmetrical triangle pattern. If XRP can break above $1.13, it could potentially rally around 20% to reach $1.35. This outlook gained traction as XRP’s price recently began to rise from its lowest point.
While XRP has initially tested $1.13, analysts at crypto.news suggest further resistance lies ahead at $1.17, $1.27, and $1.37 if the price continues to rise. Currently, XRP is trading above the $1.11 mark, positioned within the middle range of the Bollinger Bands, but still below the $1.16 upper limit. Breaking above $1.16 could signal a stronger recovery, whereas falling below $1.11 might indicate weakening price movement.
The Balance of Power is currently at 0.86, suggesting significant buying activity in the most recent trading period. However, a single strong reading isn’t enough to say XRP is definitely starting to rise again. XRP has seen temporary price increases even while generally falling, so buyers need to maintain these gains and show increased trading volume above resistance levels to confirm a true turnaround.
ETF inflows support the rebound
Spot XRP ETFs listed in the U.S. saw $2.49 million in net inflows on July 20, according to data from SoSoValue. Bitwise’s ETF was the only one experiencing net buying that day, bringing its total inflows to approximately $501 million. Total assets held by all XRP ETFs were close to $1.017 billion, with cumulative net inflows reaching about $1.489 billion.
XRP exchange-traded funds (ETFs) saw a total of $2.49 million in new investments yesterday, July 20th. All of this increase came from Bitwise’s XRP ETF (BWXRP), bringing its total inflows to $501 million. Currently, the total value of all XRP ETFs is $1.017 billion, with a combined $1.489 billion invested since their launch.
— 𝗕𝗮𝗻𝗸XRP (@BankXRP) July 21, 2026
As a crypto investor, I’ve been watching XRP closely, and the demand for it through 2026 has been consistent with what we’ve seen for a while now. These new XRP ETFs have soaked up almost a billion tokens, and the amount of XRP held on exchanges is the lowest it’s been in years. But honestly, despite this shrinking supply, the price hasn’t really taken off. It’s still quite a bit below where it was at its high point back in July 2025, even with the ETFs consistently buying up tokens.
Recent U.S. XRP exchange-traded funds (ETFs) saw $6.78 million in investments last week and currently hold around 971 million XRP tokens. This consistent interest is a positive sign, but analysts say the price needs a definitive upward swing to confirm this is a lasting recovery rather than just a temporary bounce within an ongoing downward trend.
Analysts split over the larger trend
Recent price increases have led to varied predictions for XRP’s future. EGRAG CRYPTO suggests the price might be nearing a new low between $0.90 and $1.00, with support from key long-term indicators. Their analysis points to $1.23 as a first target for price recovery, and $1.56 as a stronger signal before potentially much larger gains.
These predictions are still uncertain. According to EGRAG, it’s not definitively clear if the lowest point has been reached, and their price targets of $9, $15, and $31 are based on technical analysis using Fibonacci extensions and the expectation of a significant market upswing.
Looking at the XRP chart, I often get a sense of where it might be headed by identifying its overall pattern. This analysis suggests a potential three-stage rise, with price targets of $9, $15, and $31, based on a pattern of increasing lows and XRP’s long-term trends.
— EGRAG CRYPTO (@egragcrypto) July 21, 2026
Chart analyst ChartNerd now believes XRP is still trending downwards overall. This assessment comes after key moving averages – the 20-week and 50-week EMAs – recently crossed below each other, a signal that occurred earlier in 2026.
According to ChartNerd, XRP might encounter strong selling pressure if it rises to around $1.29 or $1.60, unless it can overcome its overall downward trend. While the price has improved recently, the overall technical outlook for XRP remains cautious, as it’s still trading below a key downward-sloping resistance level.
If XRP rises to $1.35, it will likely confirm a short-term breakout pattern identified by Martinez. However, for a significant upward trend to begin, XRP needs to break through key resistance levels on the weekly chart. Currently, the main challenge is balancing increasing positive momentum with its existing long-term weakness.
XRP bulls need to clear $1.16
Looking at short-term price movements, key levels are near where the price is now. The first support level is around $1.11, which coincides with the middle of the Bollinger Bands. Resistance can be found near $1.16, which aligns with the upper band. If the price breaks above $1.16 and stays there, it could signal further increases toward $1.20, then $1.27, and potentially up to $1.35.
If the price falls by $1.11, it could slow down the current recovery and bring the $1.08-$1.10 range back into view. A further drop might lead traders to focus on the $1.05-$1.00 level, which has recently seen buying activity.
Demand from institutions is still helping to support prices, but it hasn’t yet created a strong, definitive surge.
2026-07-21 11:40