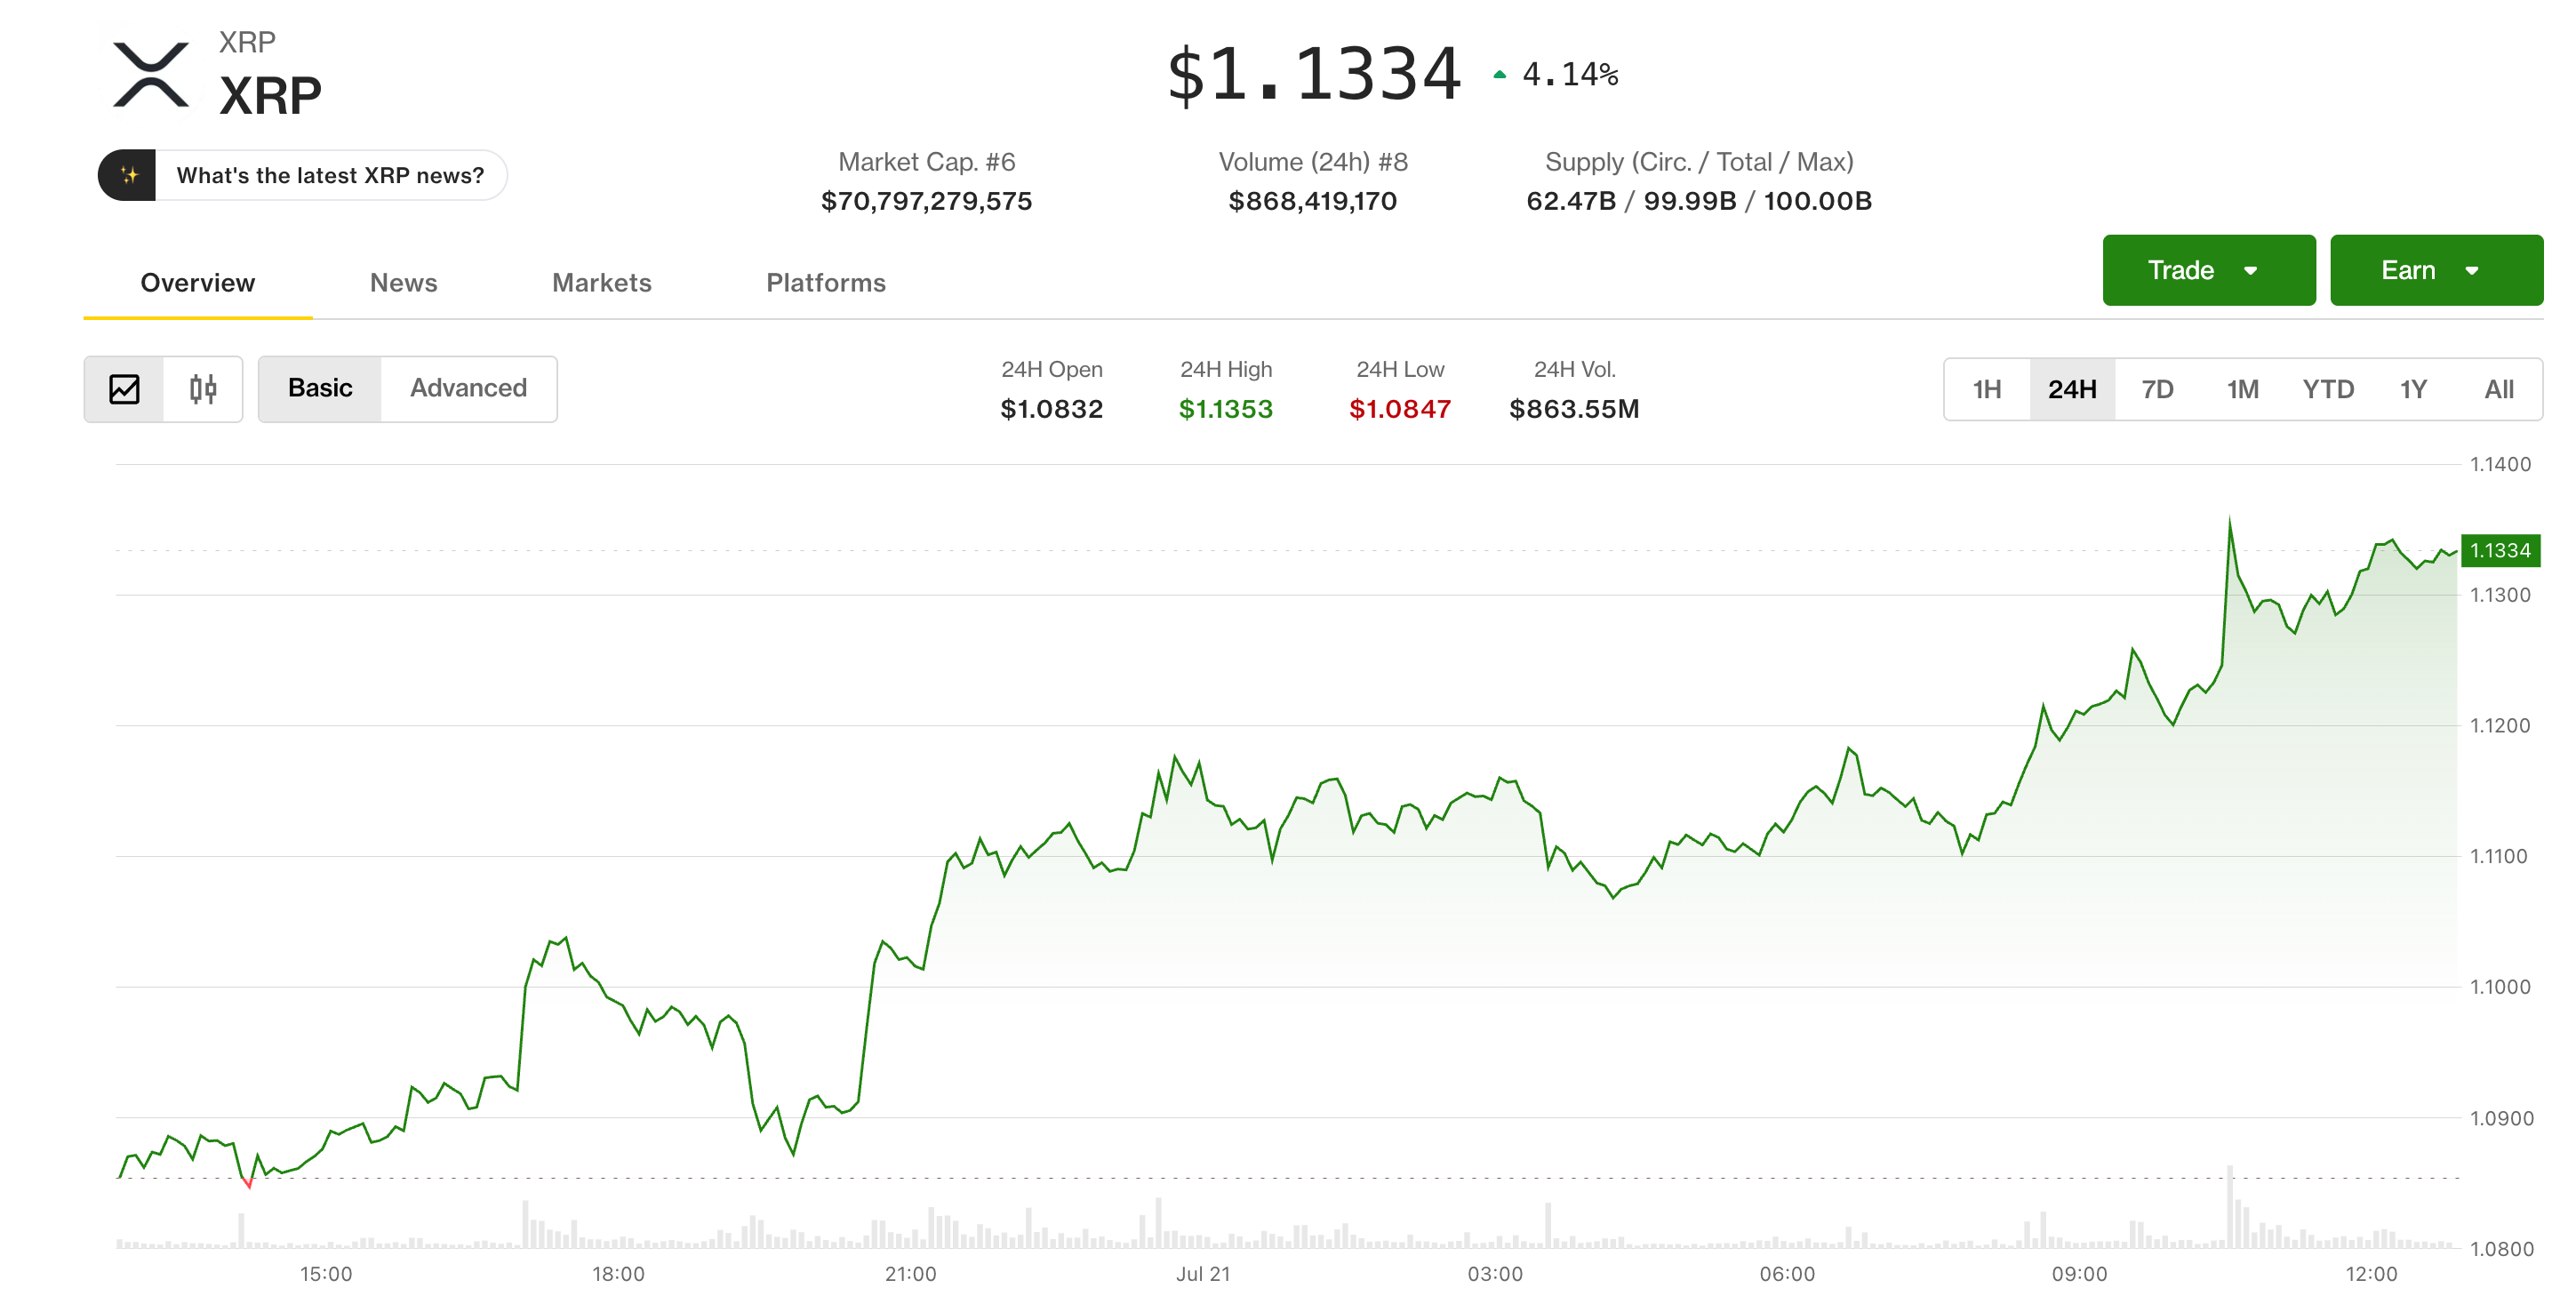
XRP is attempting to move past a key support level and potentially break out to higher prices. Over the last 24 hours, the token increased by over 4%, approaching $1.13 – a price point traders are closely monitoring after a period of consolidation within a symmetrical triangle pattern.
XRP might rise to $1.35 if it breaks through its current level, however, its overall trend remains within a downward pattern that has limited significant price increases over the past few months.
News Background
• XRP traded near $1.13 on Monday, up about 4.6% over 24 hours, according to CoinGecko data.
Over the past 24 hours, the token’s price fluctuated between $1.08 and $1.14. Its market value is approximately $70.85 billion, with $1.27 billion worth of the token traded during that period.
According to analyst Ali Martinez, XRP’s price action suggests a potential buying opportunity. His analysis of the monthly chart indicates a ‘TD Sequential’ buy signal, and the hourly chart reveals the price is currently stabilizing within a symmetrical triangle pattern.
• Martinez said a breakout above $1.13 could open the door to a roughly 20% rally toward $1.35.
Price Action Summary
XRP started the day around $1.09, then rose to a peak of $1.11 according to CoinDesk data, and later reached nearly $1.13 as shown on CoinGecko.
After a period of stable trading between $1.09 and $1.11, the price increased as more buyers entered the market this morning.
Trading activity picked up when the price tried to break higher, reaching around $1.27 billion in volume over the past 24 hours, according to CoinGecko.
XRP remained stable, trading above $1.08 to $1.10 throughout the day, suggesting its recent gains are likely to continue.
Technical Analysis
The price of $1.13 is a crucial level to watch. If the price rises above this point and stays there, it would likely confirm a breakout pattern that traders have been anticipating, potentially leading to a price increase towards $1.35.
The price chart now shows a symmetrical triangle pattern, meaning it’s been fluctuating between increasingly smaller peaks and valleys before recently starting to rise.
Looking at the daily chart, the outlook for XRP is still somewhat negative. The price continues to move within a downward trend, and key long-term moving averages are positioned above it, also trending downwards.
The price faces significant resistance between $1.24 and $1.28, as this range aligns with both the top of the current trading channel and key moving averages.
The price continues to find strong support between $1.02 and $1.06, as buyers have consistently intervened in this range over the past few weeks.
What traders should watch
The price needs to stay above $1.13 to confirm an upward trend in the short term.
• $1.14 is the next nearby level after marking the top of the latest 24-hour range.
As a crypto investor watching XRP, I’m keeping a close eye on the $1.24 to $1.28 range. If we can break through that level, it would be a really positive sign and suggest a sustained upward trend for XRP on the daily chart.
• $1.02-$1.06 remains the key demand zone. Losing it would expose $0.88-$0.92.
Until XRP’s price consistently stays above $1.24 to $1.28, it’s likely just testing a temporary upward move within a longer-term downward trend.
- 1Live markets: Bitcoin ETFs post a fifth straight day of inflows in a first since April
52 minutes ago
- 2UK Parliament begins inquiry into banking chokepoint for crypto businesses
1 hour ago
- 3Bitcoin hits a two-week high near $65,500 as the chip trade turns back into a tailwind
2 hours ago
- 4Inside Cardano‘s ‘Van Rossum’ hard fork, and what it means for users
17 hours ago
- 5Exodus to cut 25% of global workforce in payments shift
17 hours ago
- 6AI compute stocks bounce as Hut 8, IREN land billions in new contracts
17 hours ago
- 7Tom Lee’s Bitmine slowed ether purchases as it bought back $86 million in stock
18 hours ago
- 8Saylor’s Strategy raises cash reserves to $3.2 billion, leaving bitcoin holdings unchanged
19 hours ago
- 9Brazil’s securities regulator sets up task force with 60-day deadline for tokenization proposal
19 hours ago
- 10A bitcoin ‘volmageddon’ may be brewing, key indicator suggests
20 hours ago
Gate Leads Spot Market Share Gains as CEX Volumes Rise for First Time in Five Months

Gate Leads Spot Market Share Gains as CEX Volumes Rise for First Time in Five Months
After a five-month decline, trading activity on centralized exchanges (CEXs) increased in June. Spot trading rose 15.3% to $1.11 trillion, and trading in Real World Asset (RWA) perpetual contracts reached a new high of $311 billion.
After a five-month decline, trading activity on centralized exchanges (CEXs) increased in June. Spot trading rose 15.3% to $1.11 trillion, and trading in Real World Asset (RWA) perpetual contracts hit a new high of $311 billion.
Why it matters:
After a five-month decline, trading activity on centralized exchanges (CEXs) increased in June. Spot trading rose 15.3% to $1.11 trillion, and trading in Real World Asset (RWA) perpetual contracts reached a new high of $311 billion.
Bitcoin hits a two-week high near $65,500 as the chip trade turns back into a tailwind

Inside Cardano’s ‘Van Rossum’ hard fork, and what it means for users
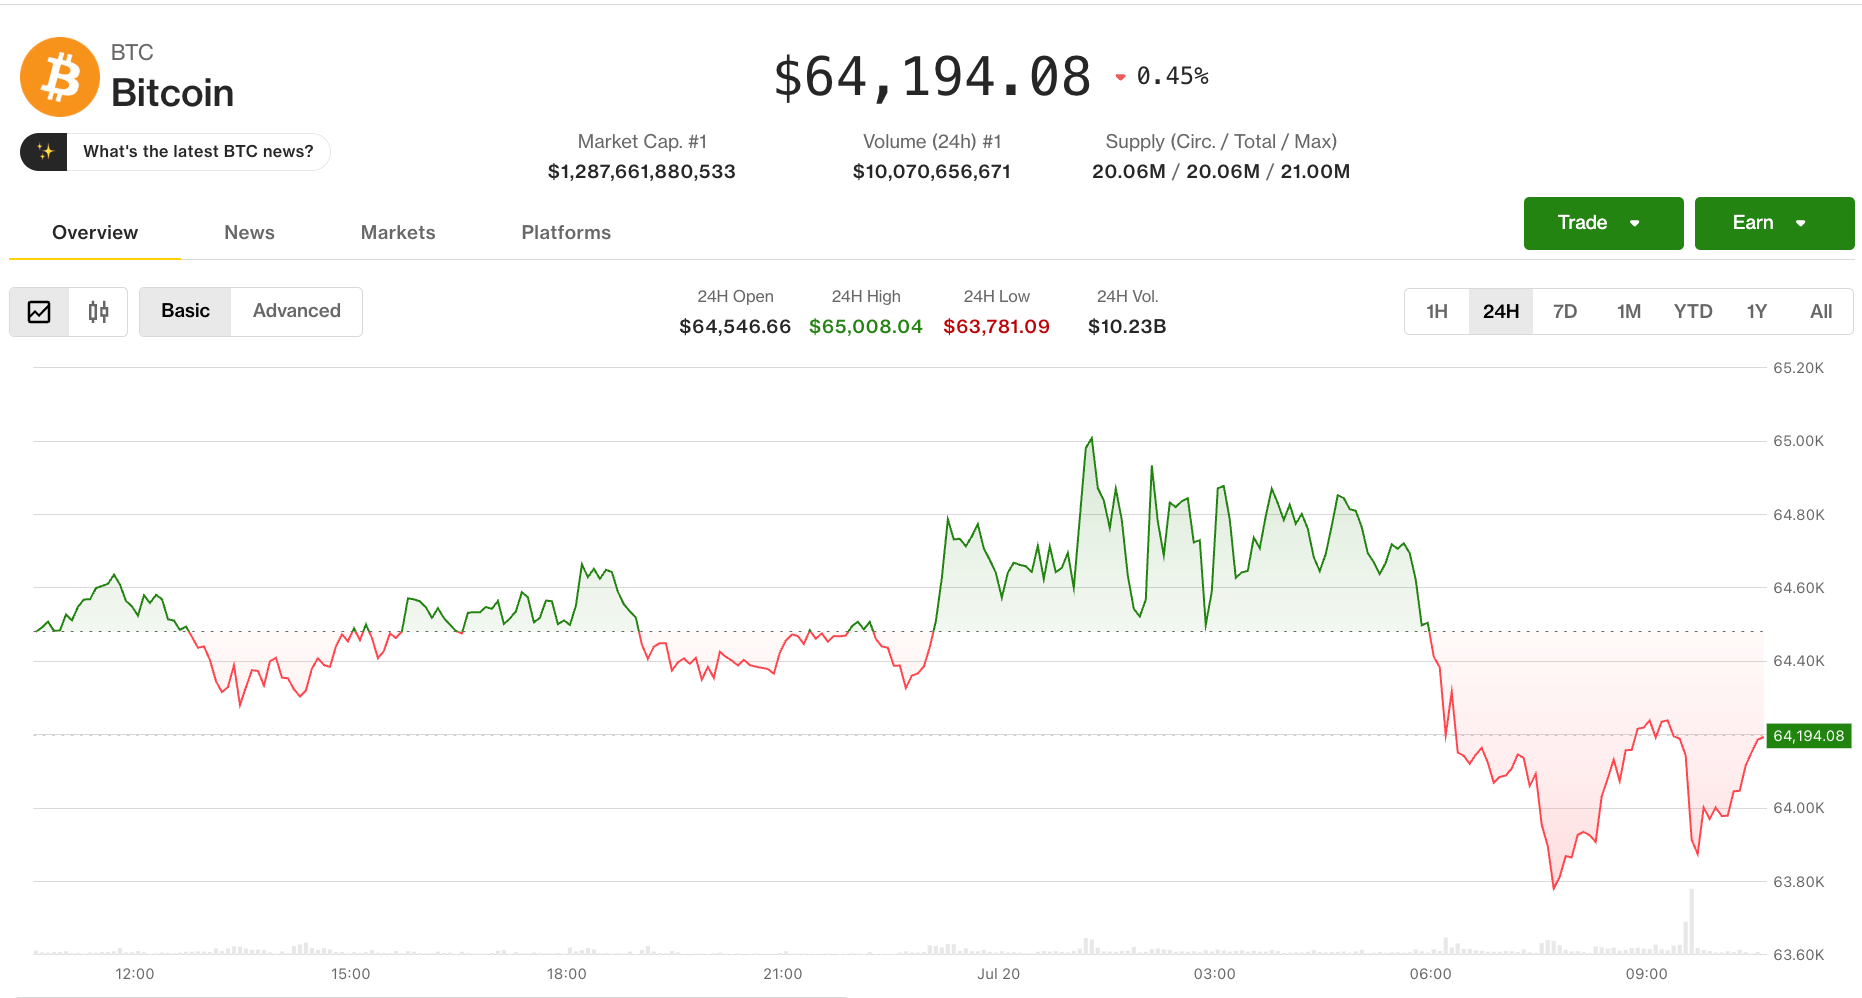
Crypto market slips even as equities advance. Pump surges on social-media chatter
2026-07-21 10:39