Well, now, let me tell you a tale about the curious price action of Shiba Inu, which is currently dancing around the $0.0000134 mark like a cat chasing its own tail. SHIB had a go at reclaiming the $0.000015 territory after a wild ride earlier this month, but it got slapped back by the 200-day moving average, which seems to be saying, “Not today, little doggy.” 🐶
Now, SHIB is trying its best to stand firm above the 100-day EMA, which is acting like a gentle nudge to keep things from getting too rough. But with the volume drying up faster than a puddle on a hot summer day, the excitement has certainly cooled off. The RSI, that ever-so-wise indicator, is sitting right in the middle, not giving us a clue which way this puppy is headed. It’s a classic SHIB moment, folks—will it be a moonshot or a nosedive? 🚀Descending
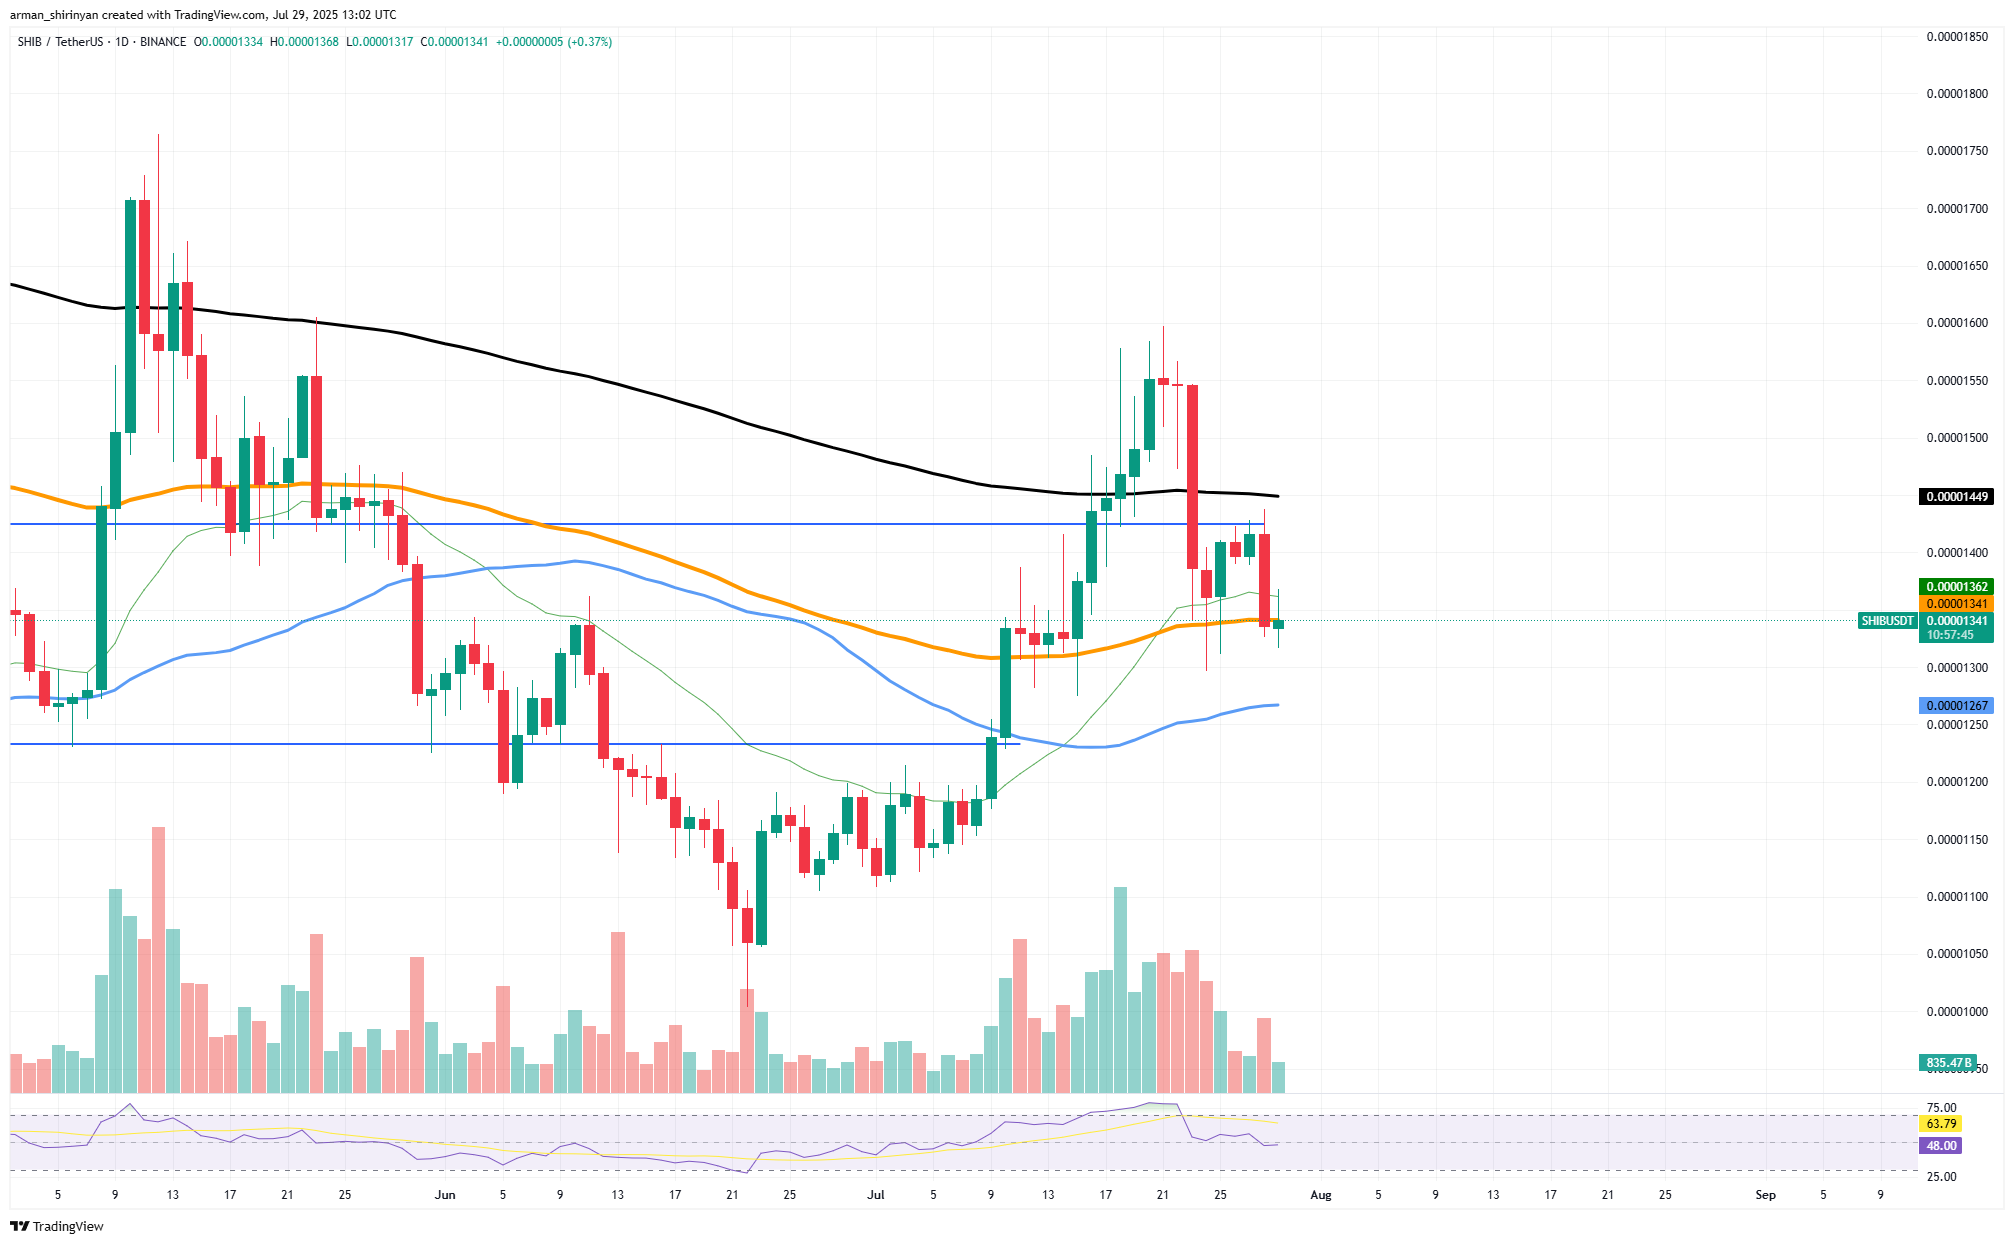
If the bulls can’t muster enough energy to push SHIB past the $0.00001449 mark, we might see it sliding down to $0.00001267 or even the psychologically important $0.000012. That would pretty much cancel out any hopes of a July breakout. However, if SHIB can break free with a fresh wave of buying, we might see it hitting $0.000016 and aiming for the stars at $0.00002. A bullish continuation pattern would be confirmed, and the speculation train would be ready to roll. 🚂
But for now, SHIB is stuck in a tight spot, caught between support and resistance lines, and major moving averages. Both retail traders and the big fish are waiting for something—anything—to tip the scales. 🎤💰
Solana’s Small Boost
Speaking of Solana, it’s been on quite a tear, breaking through resistance zones like they’re made of paper and heading straight for the $200 mark. As of now, it’s chilling around $184, showing signs of consolidation above $175, like a runner taking a quick breather before the final sprint. 🏃♂️💨
Even more interesting is the looming golden cross, a technical pattern that usually signals good news. When the 50-day moving average crosses above the 200-day moving average, it’s often seen as a bullish sign. For SOL, this crossover is practically a done deal, whether the price keeps climbing or holds steady. 📈✨
But here’s the kicker: this golden cross is about as useful as a screen door on a submarine. It’s forming after a massive rally, and anyone betting on it now is just late to the party. Traders who jumped on the trend early have already cashed in. The golden cross, being a lagging indicator, is more of a confirmation of what’s already happened than a predictor of future glory. 🕵️♂️🧐
The volume is starting to dwindle, and the RSI has come down from its overbought levels, suggesting that the momentum is slowing. If SOL can’t hold $175, we might see a drop to the $162-164 zone, where all the important EMAs are stacked up. A break below that could lead to a more serious correction. ⚠️📉
Bitcoin Can Blow Up
Bitcoin, that old reliable, is coiling tighter and tighter, like a spring ready to pop. It’s been hovering just below the critical $120,000 resistance, which it’s tried to breach multiple times but hasn’t managed yet. Currently, it’s trading around $119,000, and each passing day feels like a ticking time bomb. 💣💥
This is a classic volatility squeeze, a setup that often leads to a sharp move in one direction or the other. Back in July, Bitcoin broke out of a descending triangle and started a slow but steady climb, but the momentum has slowed down. Low volume, compressed volatility, and smaller daily candles are all signs that a breakout is on the horizon. The RSI is still above 60, indicating that the bulls are still in control. 🐻🐂
The multi-layered support beneath Bitcoin makes the potential move even more explosive. The 20-day EMA is comfortably at $116,000, and the 50-day isn’t far behind. These moving averages are providing a strong foundation, making it less likely for a significant drop unless a black swan event swoops in. 🦢🌪️
Add to that the macro factors: historically bullish Q4 setups, declining exchange balances, and ETF inflows. If Bitcoin can convincingly break above $120,000, especially on a daily close with a volume spike, we might see a sharp rise toward the $125,000-$130,000 range and beyond. The longer Bitcoin stays flat, the more violent the move will be. It’s not a question of if, but when and how high. 🌠🚀
Read More
- Clash Royale Best Boss Bandit Champion decks
- Vampire’s Fall 2 redeem codes and how to use them (June 2025)
- Mobile Legends January 2026 Leaks: Upcoming new skins, heroes, events and more
- World Eternal Online promo codes and how to use them (September 2025)
- Clash Royale Season 79 “Fire and Ice” January 2026 Update and Balance Changes
- Best Arena 9 Decks in Clast Royale
- Best Hero Card Decks in Clash Royale
- Clash Royale Furnace Evolution best decks guide
- FC Mobile 26: EA opens voting for its official Team of the Year (TOTY)
- How to find the Roaming Oak Tree in Heartopia
2025-07-30 03:27