On May 20, 2025, Bitcoin stood proud at $105,311, with a market cap of $2.09 trillion—yes, trillion!—and a 24-hour trade volume of $36.50 billion. The intraday swings? Between $102,425 and $106,704—basically a rollercoaster no amusement park would dare to host. The chaos suggests heightened volatility, but hey, at least we’re trending upward, right? 😅
Bitcoin: The Digital Gold or Fool’s Gold? 🤔
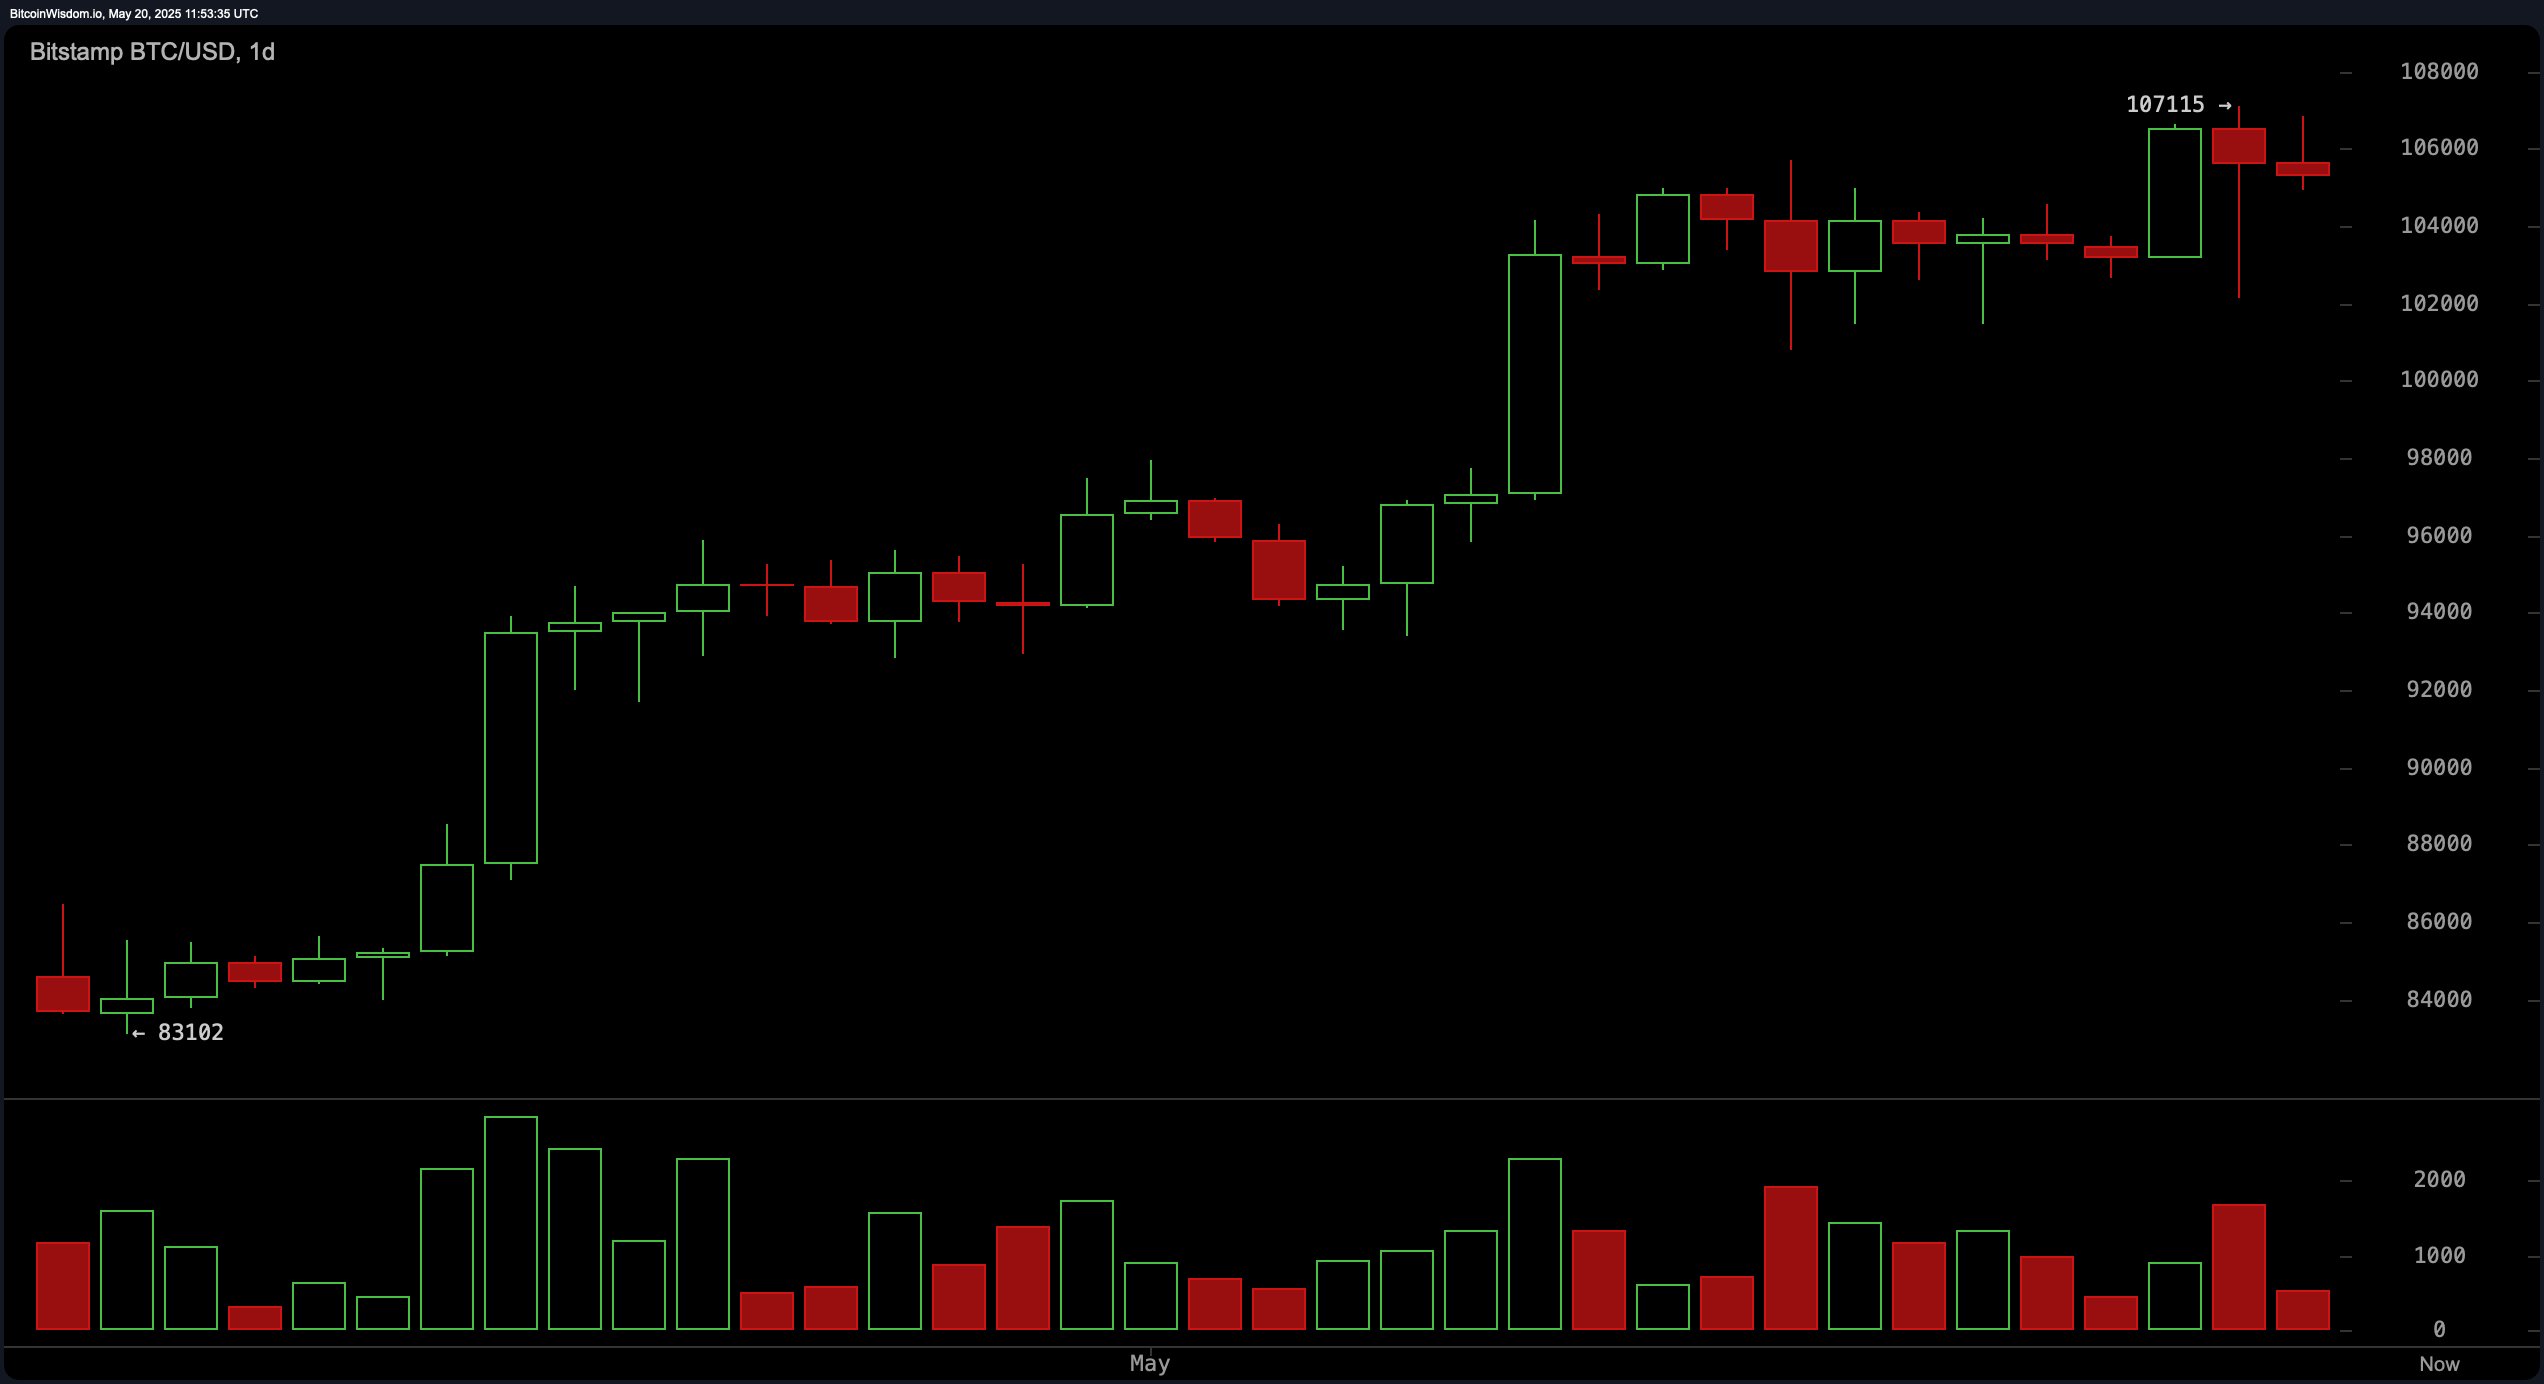
The daily chart screams “uptrend”—a relentless march from a humble $83,102 to a lofty $107,115. Volume analysis reveals green candles with expanding volume, hinting at sustained buying. But wait, what’s this? Recent candles sport upper wicks and less momentum—buyer fatigue setting in? It’s like running up the stairs only to gasp at the top, wondering if you should jump or hold on for dear life. Serious traders might consider jumping in around $100,000 to $102,000—because support here is pretty solid, especially if a bullish pattern confirms it with healthy volume. Or so the story goes. 😏
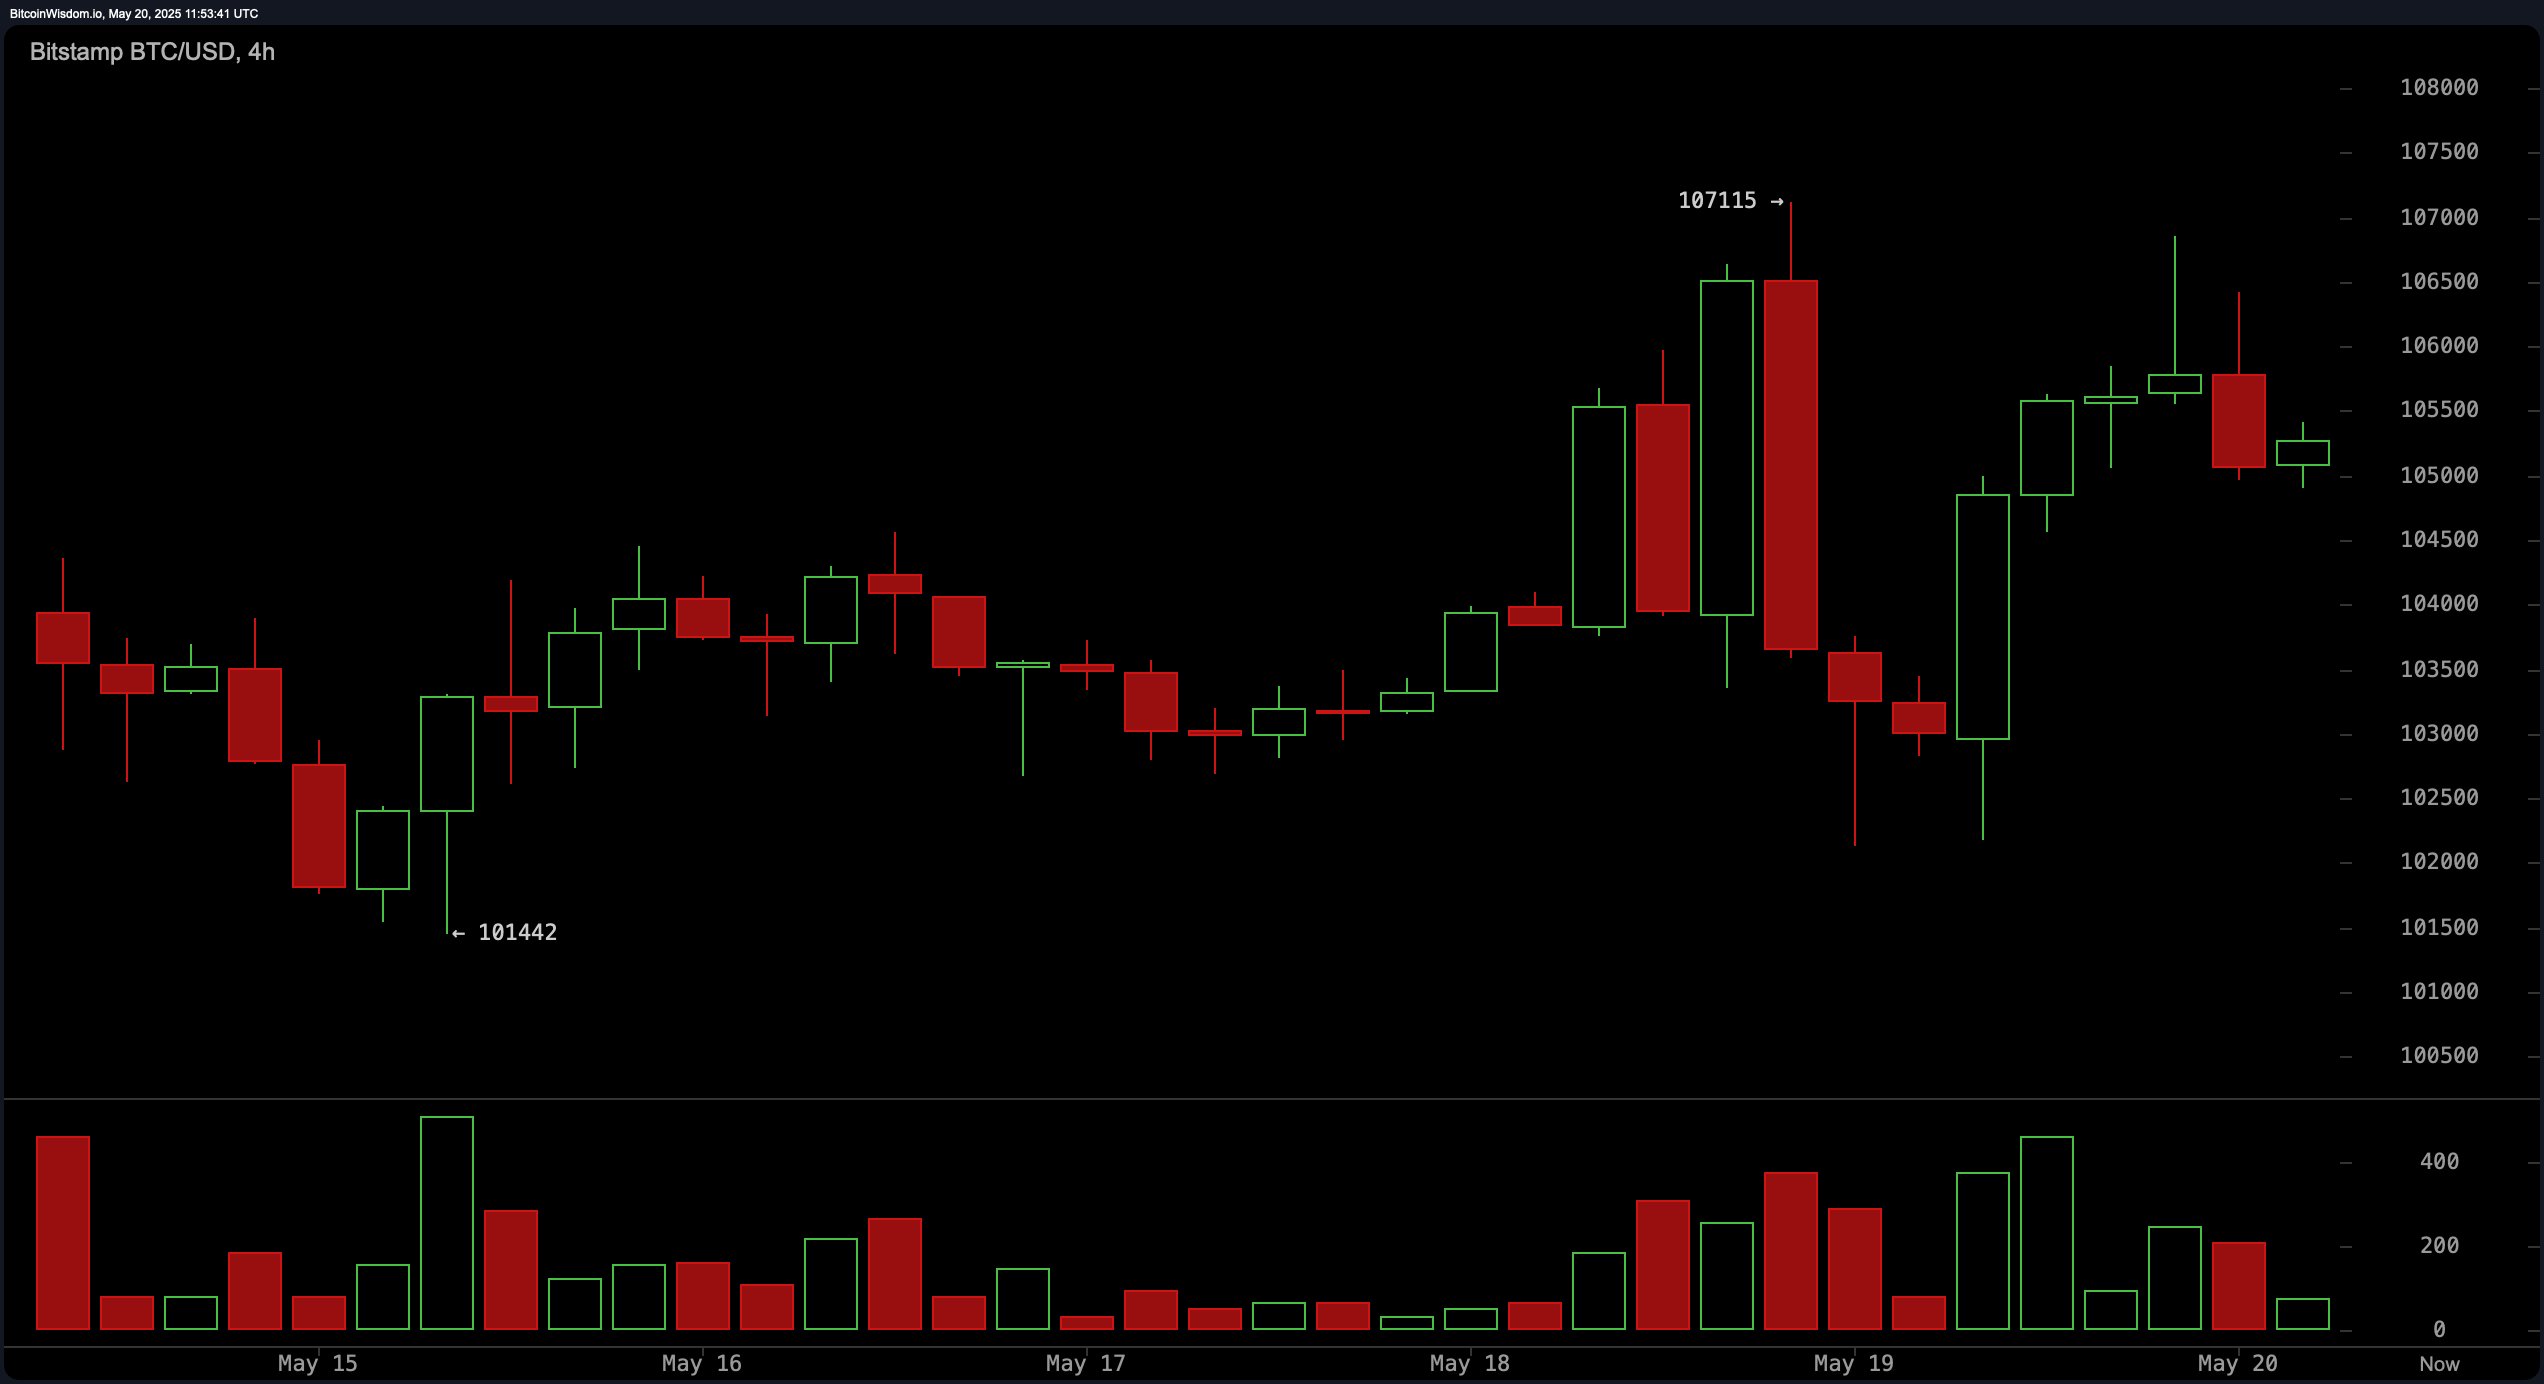
Looking short-term on the four-hour chart, Bitcoin took a breather from its recent high—dropping from near $107,115 to $102,126. A lower high pattern emerges, whispering not all is well in paradise. The reckless charge at $107k on May 19, with volume spiking like a fireworks show, hints resistance at this peak. Support? Found around $102,500, solid enough but not impenetrable. Between $101,000 and $101,500, lies the calm before the next storm? Watch these levels—if bullish signals appear (morning star, bullish engulfing), maybe, just maybe, it’s a buy. Or not. 🤷♂️
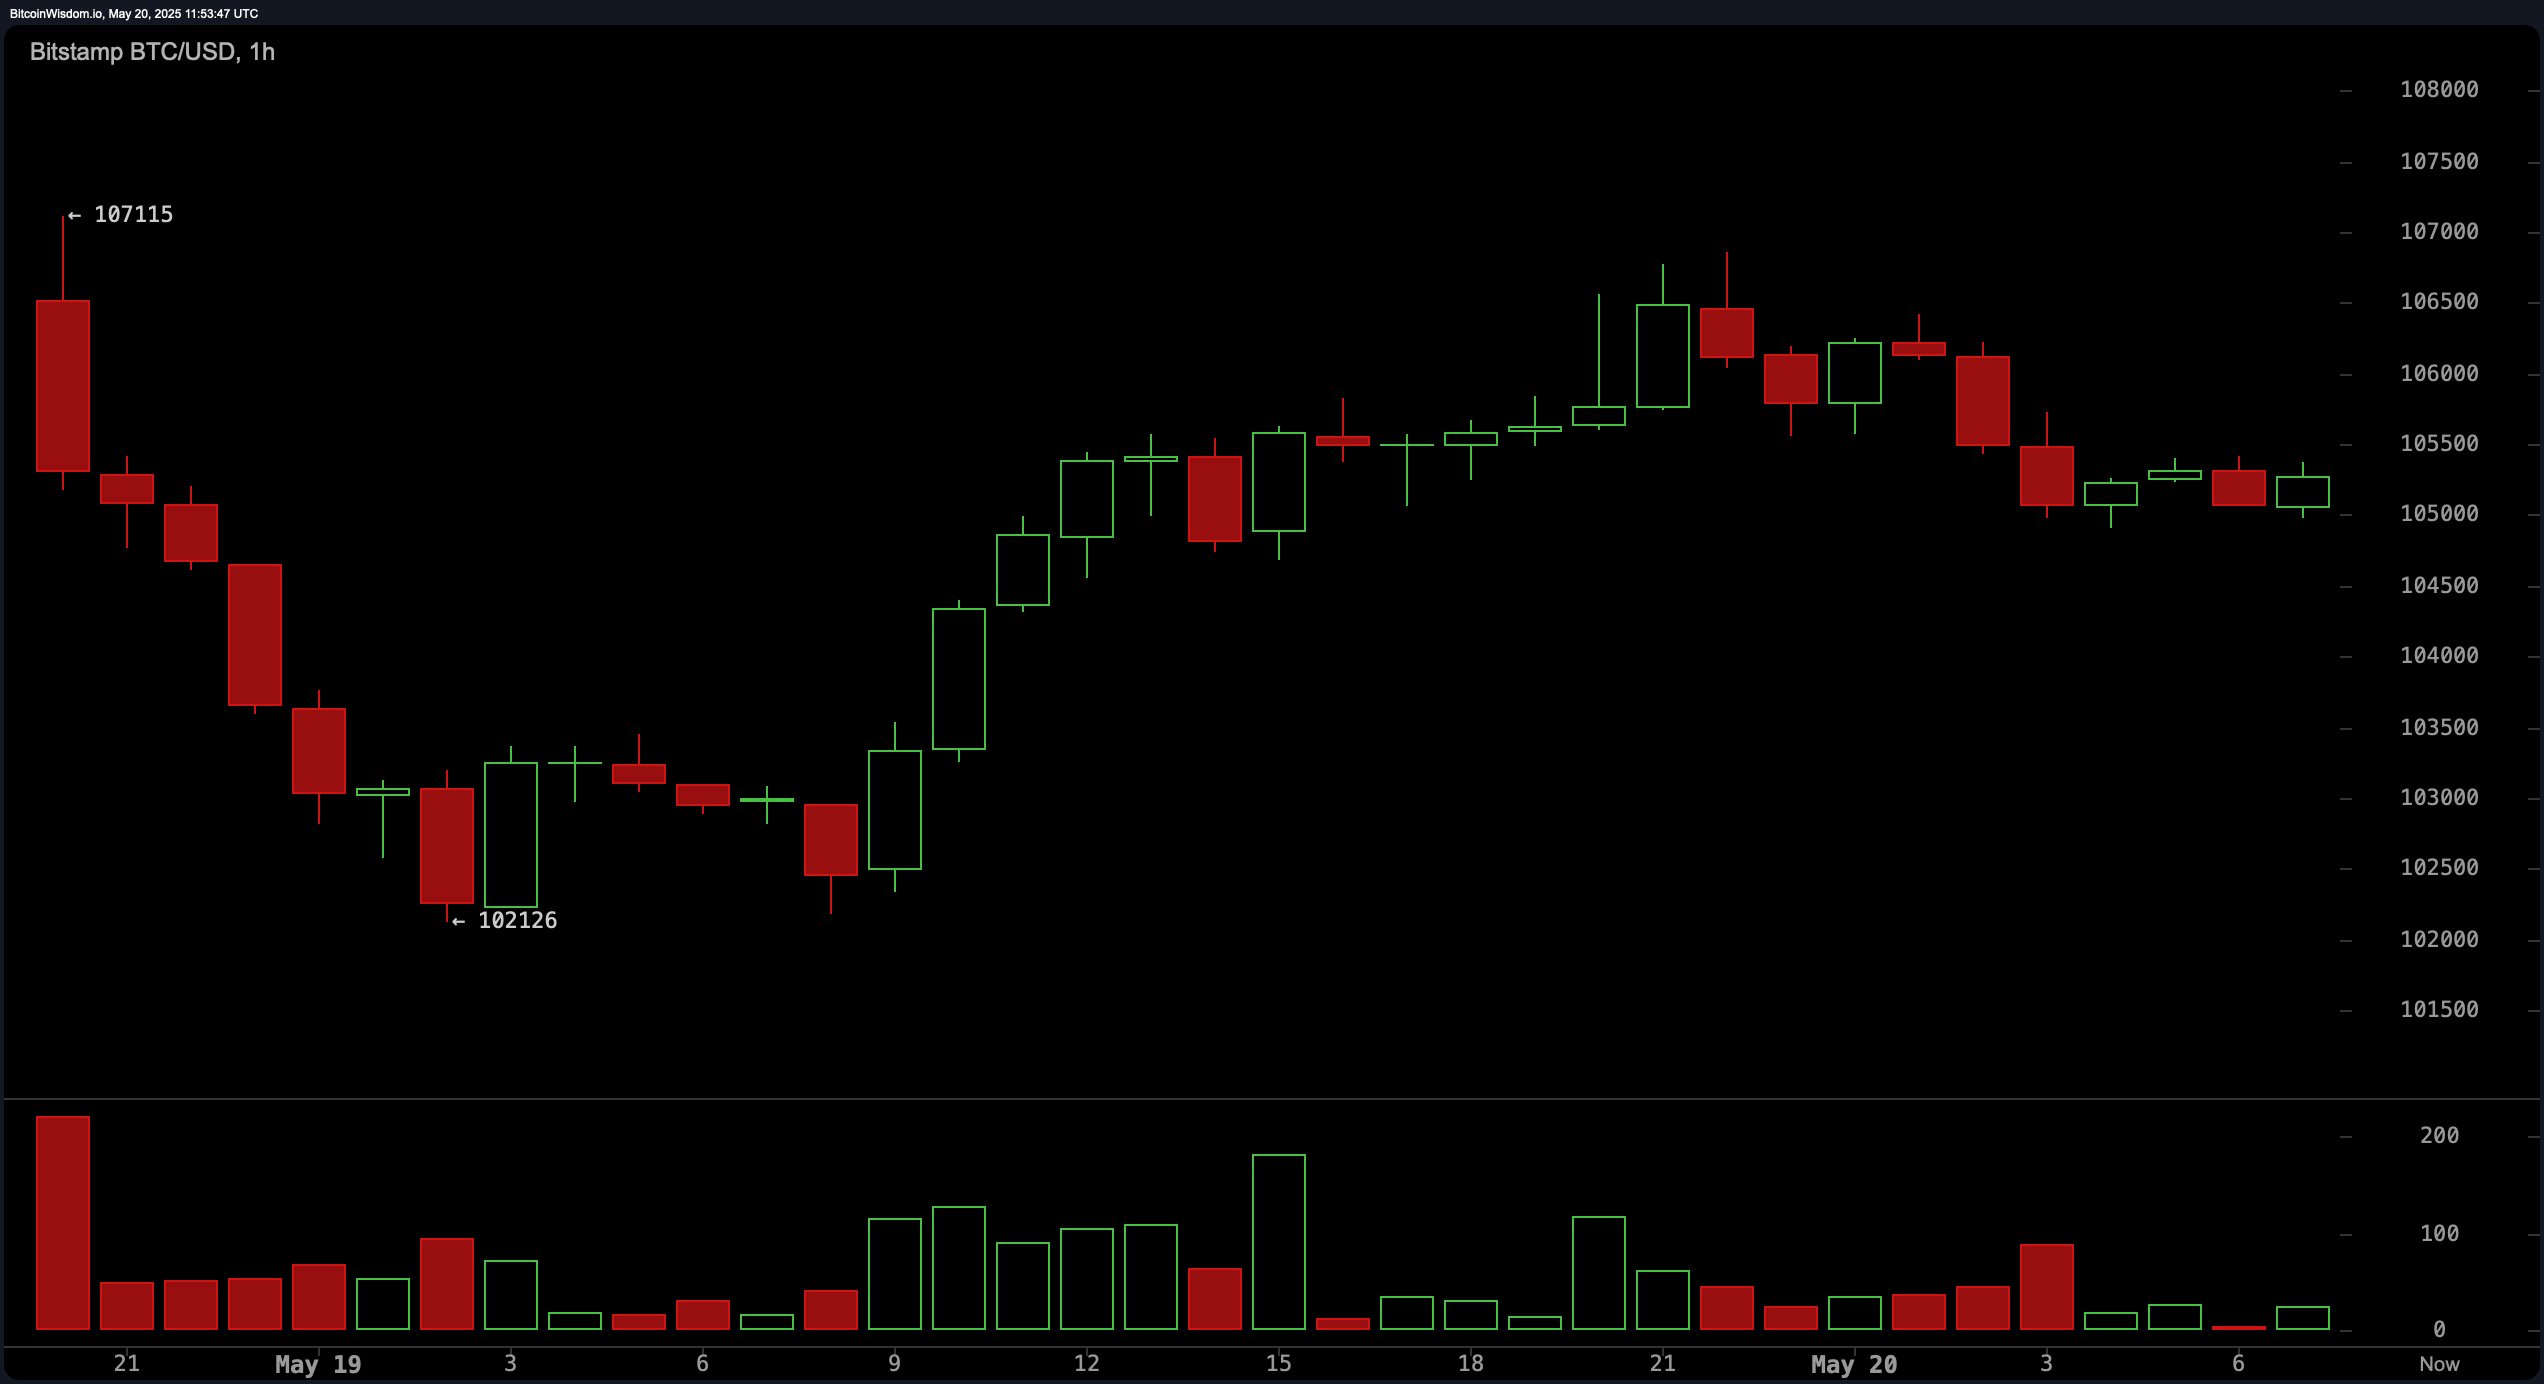
The one-hour chart is a story of its own—ripped from $107,115 to roughly $102,126, then a limp recovery. Looks like a bearish flag or pennant—great for sailors, terrible for traders. Volume’s decreasing, hinting that a breakdown might be lurking. The critical support? $105,000. Break below and it’s a free fall back toward $101,500. Stay cautious—intraday positions? Better to sit tight or dance around support levels, waiting for a more promising moment. 😉
Oscillators? Ah yes, those bits and bobs that traders use to scare themselves silly. RSI, Stochastic, CCI, ADX, Awesome oscillator—messy neutral territory. Momentum and MACD? Signal a sell, folks. Basically, the market’s in a “maybe, I guess” mood. But don’t forget the moving averages—EMA, SMA from 10 to 200—they all point “go for it.” So, despite the chaos, the bigger picture hints at a bullish trend… until it doesn’t. Typical trader’s dilemma. 😬
In conclusion: Bitcoin’s posture remains somewhat optimistic—if it holds support around $101,000–$102,000. But beware of fading momentum and intraday dumps. The wise approach? Play it safe—don’t chase shiny rallies, wait for dips near key support zones to get in on the joke/party/train.
Bullish Verdict:
If Bitcoin keeps support above $101,000 and busts through $107,000, the bullish party isn’t over yet. All key moving averages point north, making any brief dip a potential buy-opportunity—because everyone loves a comeback story. 🎉
Bearish Verdict:
If support drops below $101,000 with momentum fading faster than a mirage, then the bear parade begins. A clear breach with high sell volume? That’s just the beginning of a correction, folks. Time to tighten the imaginary seatbelt. 🚨
Read More
- Clash Royale Best Boss Bandit Champion decks
- Vampire’s Fall 2 redeem codes and how to use them (June 2025)
- Mobile Legends January 2026 Leaks: Upcoming new skins, heroes, events and more
- How to find the Roaming Oak Tree in Heartopia
- World Eternal Online promo codes and how to use them (September 2025)
- Best Arena 9 Decks in Clast Royale
- Clash Royale Season 79 “Fire and Ice” January 2026 Update and Balance Changes
- Clash Royale Furnace Evolution best decks guide
- Clash Royale Witch Evolution best decks guide
- Best Hero Card Decks in Clash Royale
2025-05-20 15:59