The market, that capricious beast, rises and falls with the whims of unseen forces. You, the humble observer, stand perplexed, unsure of its next move. And then, like a bolt from the blue, it appears—a single candlestick, devouring its predecessor whole. This, dear reader, is the engulfing candlestick pattern, a harbinger of market reversals. Master it, and you may yet tame the wild beast of trading. 🕯️
Ah, the engulfing pattern! So simple, yet so profound. It whispers tales of market sentiment in just two candles. But beware, for spotting it is but the first step. To truly harness its power, you must know when and where it matters. Let us embark on this journey together, with a dash of humor and a pinch of sarcasm. 😏
What Is an Engulfing Candlestick Pattern?
An engulfing candlestick pattern, my dear friend, is a two-candle formation that screams, “The winds of change are blowing!” It occurs when a second candle, with its larger body, swallows the previous one whole, signaling a shift in momentum. A dramatic turn of events, indeed.
There are two types of these patterns, each with its own flair:
- Bullish Engulfing Pattern: Appears in a downtrend. The second candle, a bullish green giant, engulfs the previous bearish red candle. It’s as if the buyers have stormed the castle, and the sellers are in retreat. 🏰
- Bearish Engulfing Pattern: Emerges in an uptrend. The second candle, a bearish red behemoth, engulfs the previous bullish green candle. The sellers have crashed the party, and the buyers are left nursing their drinks. 🍻
Let us delve deeper into these patterns, shall we?
The Bullish Engulfing Pattern: Catching a Reversal Early
How It Works
Picture this: the market has been in a downtrend, a parade of red candles marching lower and lower. Then, out of nowhere, a green candle rises, not just closing higher but engulfing the previous red candle entirely. This, my friend, is the bullish engulfing pattern—a sign that the downtrend may be on its last legs. 🐂
What It Means
- Sellers were in control, but buyers have staged a coup.
- It hints at a possible trend reversal from bearish to bullish.
- The larger the second candle, the more convincing the signal.
Example
Imagine Bitcoin, that digital enigma, has been sliding from $50,000 to $45,000. On the last red candle, it closes at $45,000. The next day, a green candle opens at $44,800 and rockets to $46,200, engulfing the previous red candle. A bullish engulfing pattern! Traders might see this as a sign that the downtrend is losing steam and that prices could climb higher. 🚀
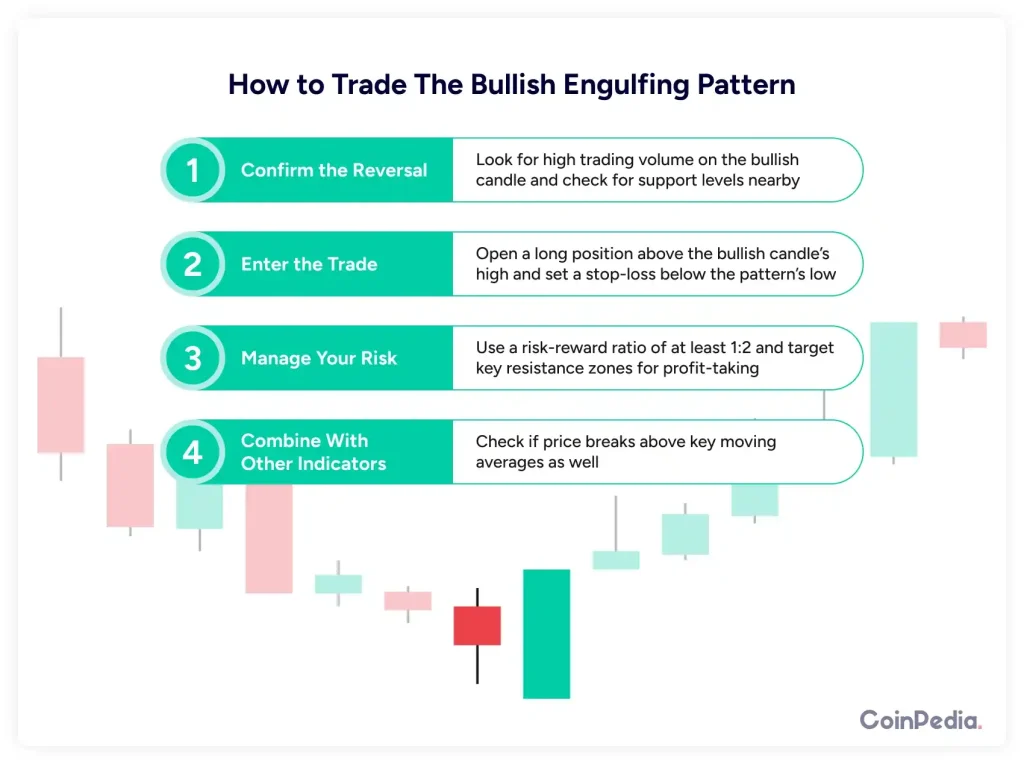
How to Trade It
- Confirm the signal: Look for additional confirmation, like increased volume or a key support level.
- Entry point: Consider entering the trade near the close of the engulfing candle.
- Stop-loss: Place your stop below the low of the engulfing candle.
Profit target: Aim for the next resistance level or use a risk-to-reward ratio of at least 2:1.
The Bearish Engulfing Pattern: Spotting the Drop Before It Happens
How It Works
This is the bullish engulfing pattern’s evil twin. The market is in an uptrend, a series of green candles climbing higher. Then, a massive red candle appears, engulfing the previous green one. It’s as if the sellers have thrown a wrench into the buyers’ plans. 🛠️
What It Means
- Buyers were pushing prices up, but sellers have taken the reins.
- It signals a potential trend reversal from bullish to bearish.
- A stronger engulfing candle means a stronger bearish signal.
Example
Imagine Apple stock, that tech titan, has been rallying from $150 to $160. One day, it opens at $161 but then plummets to $158, engulfing the previous day’s green candle. This could be a sign that the uptrend is running out of steam, and traders might expect a pullback. 📉
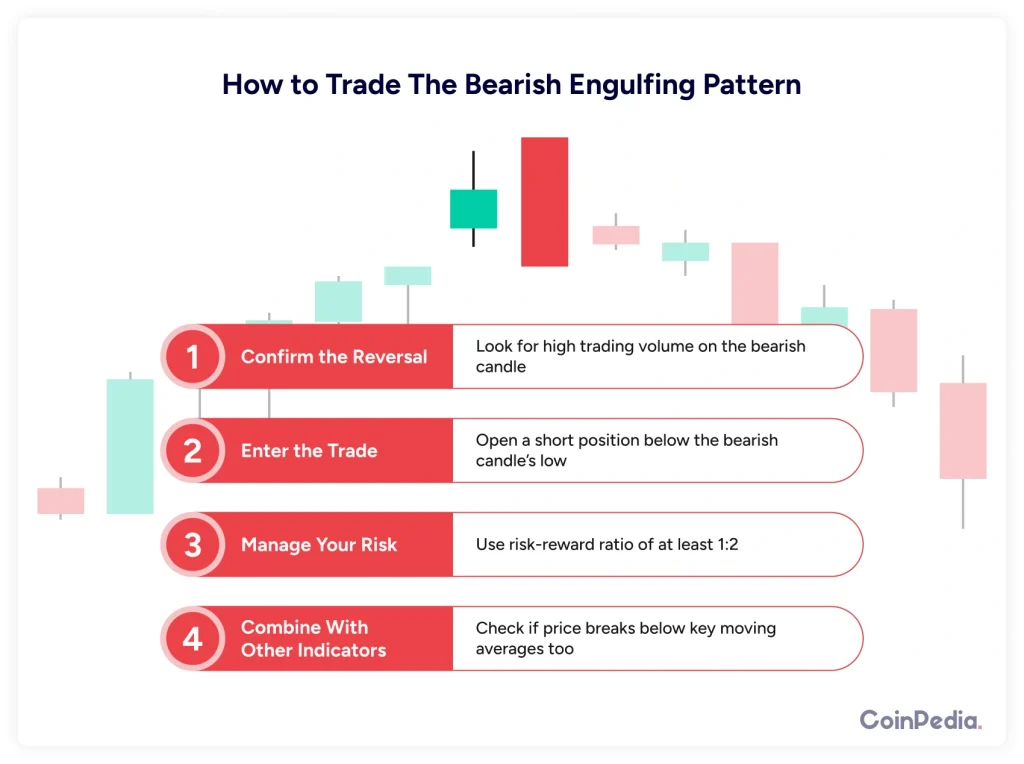
How to Trade It
- Confirm the pattern: Check if it appears near a strong resistance level or if volume increases.
- Entry point: Consider entering a short trade near the close of the engulfing candle.
- Stop-loss: Place your stop above the high of the engulfing candle.
Profit target: Look for the next support level or use a risk-to-reward ratio of 2:1.
When Engulfing Patterns Matter the Most
Not every engulfing pattern is worth your time. Here’s how to separate the wheat from the chaff:
- Check the Trend – Engulfing patterns work best at the end of a strong trend. A bullish engulfing in a downtrend or a bearish engulfing in an uptrend is more meaningful.
- Look at Support and Resistance – A bullish engulfing at a key support level or a bearish engulfing at a strong resistance level is more likely to succeed.
- Check the Volume – Higher volume on the engulfing candle strengthens the signal. It shows that more traders are backing the move.
- Combine with Other Indicators – Use moving averages, RSI, or Fibonacci levels to confirm your trades.
Common Mistakes to Avoid
- Trading Every Engulfing Pattern – Not every engulfing candle is a golden ticket. Context is key.
- Ignoring the Bigger Picture – Always consider overall market trends and other technical indicators before making a move.
- Not Using Stop-Losses – No pattern is foolproof. Always protect your trades with stop-loss orders.
Forgetting to Wait for Confirmation – Let the market confirm the reversal before entering a trade. A strong follow-up candle can help validate the signal.
Final Thoughts: Mastering the Engulfing Pattern
Engulfing candlestick patterns are a powerful tool in any trader’s arsenal. They offer clear signals of trend reversals and can help you make better trading decisions. But remember, they work best when combined with other technical analysis tools and proper risk management.
Next time you spot an engulfing candle, don’t just rush in. Check the trend, look at key levels, confirm with volume, and always have a solid plan. That’s how you go from recognizing a pattern to actually making it work for you. 🎯
FAQs
What is an engulfing candlestick pattern?
An engulfing candlestick pattern is a two-candle formation signaling a trend reversal, where the second candle fully engulfs the first one.
How do you trade a bullish engulfing pattern?
Confirm the pattern near support, enter near the candle’s close, set a stop-loss below its low, and aim for the next resistance level.
What does a bearish engulfing pattern indicate?
A bearish engulfing pattern signals a potential downtrend, showing that sellers have overtaken buyers and prices may drop.
Can engulfing patterns be used for crypto trading?
Yes, engulfing patterns work well in crypto markets, especially when combined with volume analysis and key support/resistance levels.
Read More
- Clash Royale Best Boss Bandit Champion decks
- Vampire’s Fall 2 redeem codes and how to use them (June 2025)
- World Eternal Online promo codes and how to use them (September 2025)
- How to find the Roaming Oak Tree in Heartopia
- Mobile Legends January 2026 Leaks: Upcoming new skins, heroes, events and more
- Best Arena 9 Decks in Clast Royale
- ATHENA: Blood Twins Hero Tier List
- Brawl Stars December 2025 Brawl Talk: Two New Brawlers, Buffie, Vault, New Skins, Game Modes, and more
- Clash Royale Furnace Evolution best decks guide
- What If Spider-Man Was a Pirate?
2025-03-29 10:35