The rejection at higher zones has left bulls in a state of existential dread, while the sellers are sipping champagne and watching the chaos unfold. 🍾 At $7.49, the token is hovering just above a key support band-like a tightrope walker with a parachute made of confetti. 🪂
Sellers Dominate Short-Term Outlook
The UNI/USDT chart shows a decisive bearish breakdown, with lower highs forming since price failed to sustain momentum in the $10.00-$12.00 range. Attempts to reclaim supply zones in the $8.20-$8.50 band have been unsuccessful, underscoring fading bullish conviction. 🐺
These repeated rejections leave the market vulnerable, with $7.18 identified as the next critical liquidity wall where buyers are expected to defend aggressively. Or, as I like to call it, “the last stand of the desperate.” 🛡️
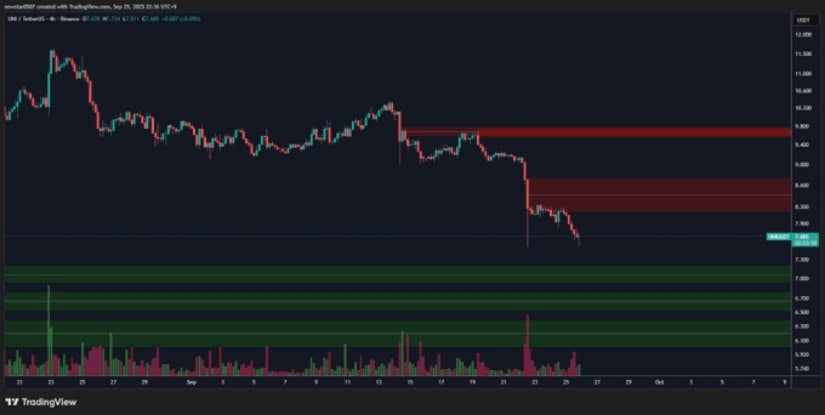
If this support holds, the coin could stage a rebound, potentially retesting resistance near $8.20. Market analysts suggest that high-volume activity around this level signals accumulation by larger players, who may be preparing for a short-term countertrend rally… or just a very expensive game of chicken. 🎲
However, if $7.18 fails, the risk of a breakdown into the $6.50-$6.80 range grows significantly, where the next pool of demand lies. The balance between these zones will likely decide whether the token stabilizes for a bounce or continues its decline deeper into bearish territory. 🐻❄️
Market Data Reflects Ongoing Pressure
Additional data from BraveNewCoin provides a chart of the current landscape. The crypto is trading at $7.49, reflecting a daily decline of 5.58%, with a market capitalization of $4.48 billion. Trading volume over the past 24 hours stands at $373 million, indicating strong activity but skewed toward selling rather than buying. 💸
The asset ranks #42 globally, with a circulating supply of just over 600 million tokens, reinforcing its position as a leading DeFi asset despite ongoing weakness. 🚀
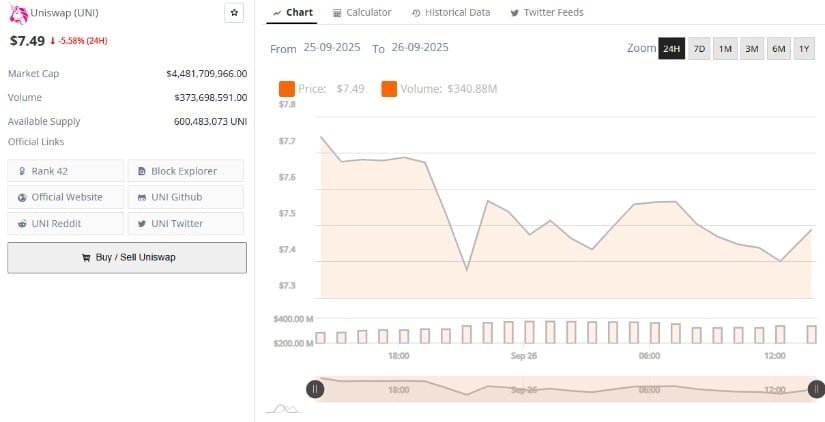
Liquidity remains healthy, but the lack of bullish follow-through raises concerns. While volume inflows suggest traders are actively engaging with UNI, the prevailing bias remains negative. Analysts point out that stability above $7.20 is essential to prevent the token from drifting into lower support levels that could trigger broader capitulation. 🧠
Indicators Highlight Bearish Momentum
On the other hand, technical readings add further weight to the bearish picture. The MACD indicator shows a confirmed bearish crossover, with the MACD line at -0.565 trailing below the signal line at -0.360, accompanied by a negative histogram of -0.205. 📉
This setup illustrates that selling momentum outweighs buying strength, and no bullish divergence has yet appeared to suggest a reversal is imminent. Traders often interpret this as a continuation signal, implying that downside risks remain until the MACD curve begins to flatten or cross back upward. 🔄
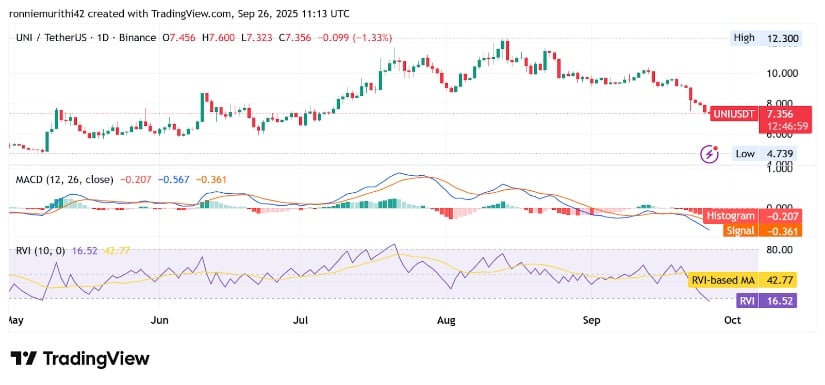
The Relative Vigor Index (RVI) paints a similar story, registering at 16.53 compared to its moving average of 42.77. Such depressed readings typically signal oversold conditions but also highlight extreme weakness in bullish conviction. 🌫️
While oversold levels can sometimes trigger relief rallies, the lack of strong recovery signals suggests that the coin may remain under pressure in the near term. Only a sustained move back above $7.50, followed by a break of $8.20, would begin to shift the tone toward stabilization. 🔄
Read More
- Clash Royale Best Boss Bandit Champion decks
- Vampire’s Fall 2 redeem codes and how to use them (June 2025)
- World Eternal Online promo codes and how to use them (September 2025)
- Best Arena 9 Decks in Clast Royale
- How to find the Roaming Oak Tree in Heartopia
- Country star who vanished from the spotlight 25 years ago resurfaces with viral Jessie James Decker duet
- Mobile Legends January 2026 Leaks: Upcoming new skins, heroes, events and more
- M7 Pass Event Guide: All you need to know
- Solo Leveling Season 3 release date and details: “It may continue or it may not. Personally, I really hope that it does.”
- ATHENA: Blood Twins Hero Tier List
2025-09-28 00:17