Ladies and gentlemen, the UNI price is doing what all confused adults do best: sitting on the fence near $10.40, pretending it knows where it’s going. Technical analysis? Oh, that’s just the market’s way of saying, “I’ll have another coffee… maybe.” Support zones are holding like a toddler gripping a juice box-tight, but one wrong move and *splat*. Momentum indicators? They’re whispering, “There’s room for upside!” as if the market isn’t already over here *yelling* for a nap.
Breaking News (It’s Just a Chart)! The Bulls Are Back… Maybe? 🐂💥
A 1-hour chart of UNI/USDT, analyzed by Barry | ChartMonkey via SwallowAcademy, reveals a “break of structure” (BOS) that sounds fancy but really means, “Hey, look at me! I climbed over that hill! Now let’s see if I fall back down.” The retest zone? That’s the market’s version of a “do-over” on a first date. Buyers better defend this support like it’s the last slice of pizza at a family reunion. Otherwise, we’re all eating cold leftovers.

The Relative Strength Index (RSI) is chilling in neutral territory, sipping a margarita and ignoring the chaos. No overbought conditions? Phew! That gives the price *just enough* room to pretend it’s not a total disaster. Moving averages are aligning for a “bullish crossover,” which is code for, “We’re not sure, but let’s act surprised if it goes up.” Consolidating above these averages? That’s the market’s way of saying, “I’m not lost… I’m *strategizing*.”
If support holds, we might hit $11.20-perfect for traders to high-five and then immediately panic-sell. But if it fails? Buckle up for a rollercoaster to nowhere, folks.
Market Overview: Trading Like a Toddler With a Piggy Bank 💸👶
BraveNewCoin’s 24-hour chart shows UNI trading at $10.39, down 1.12% because apparently, even crypto needs a “bad hair day.” Market cap? A cool $6.22 billion. Active volume? $356 million. That’s enough to buy *one* expensive yacht… for a whale who’s definitely not you. Circulating supply? 600 million UNI. Liquidity is “healthy,” but don’t ask us how-it’s magic.
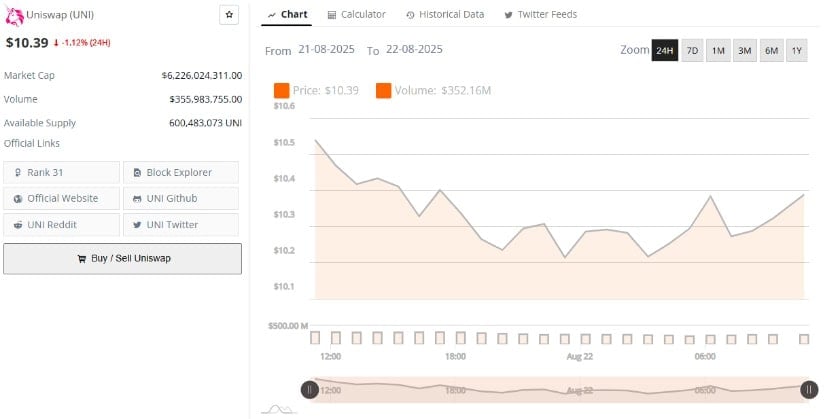
Price action is stuck in a $10.10-$10.60 loop, like a broken record screaming, “I’m trying to get to $10.50!” But every attempt ends with the market shrugging and saying, “Nah, let’s play it safe.” Early selling pressure gave way to a recovery? Sounds like a breakup story. Volume support above $10.30? Bulls better bring snacks. If they drop below $10.20, it’s “see you later, loser.”
Consolidation: The Art of Doing Nothing While Looking Busy 🤵♂️💤
Daily charts show UNI hovering near $10.43, with Bollinger Bands tighter than a cheap suit. Support at $9.22? That’s the market’s “Plan B” after a bad day. Resistance at $11.94? Let’s call it the “I-dare-you-to-fall” wall. And the middle band at $10.58? That’s where indecision goes to die… slowly.

The MACD oscillator? It’s basically a tired old man shuffling his feet. MACD line below the signal line? Negative histogram? That’s the market’s way of saying, “I’m not slowing down… I’m *recharging*.” But sideways price action? That’s just the bull and bear playing “I’m not mad, I’m just disappointed in you.” If bulls hold above $10.20, they might get another shot at glory. Otherwise, it’s nap time for everyone.
A breakout above $11.94? That’d be the plot twist we never saw coming. But if it fails? Welcome to the $9.80-$10.60 “theme park of mediocrity.”
pretending it has a plan. Consolidating near $10.40, hinting at $12.30 like it’s a dare. Traders, keep an eye on $10.20-because if that breaks, we’re all buying popcorn for the next crash. And remember: the market doesn’t care if you’re ready. It’s crypto. It’s chaos. It’s *art*.
Read More
- Clash Royale Best Boss Bandit Champion decks
- Vampire’s Fall 2 redeem codes and how to use them (June 2025)
- Mobile Legends January 2026 Leaks: Upcoming new skins, heroes, events and more
- World Eternal Online promo codes and how to use them (September 2025)
- How to find the Roaming Oak Tree in Heartopia
- Clash Royale Season 79 “Fire and Ice” January 2026 Update and Balance Changes
- Clash Royale Furnace Evolution best decks guide
- Best Arena 9 Decks in Clast Royale
- Best Hero Card Decks in Clash Royale
- FC Mobile 26: EA opens voting for its official Team of the Year (TOTY)
2025-08-22 21:30