Bitcoin has apparently decided it just can’t sit still, hovering melodramatically between $96,869 and $97,057 the past hour. Is it chill? Is it stressed? We may never know. Still, with a 24-hour see-saw from $95,925 to $97,341 and a delightfully chunky $1.92 trillion cap (that’s right, with a “T”) and $27.81 billion being flung about in daily trades, Bitcoin continues to main-character energy in the world of finance. Investors everywhere: “Don’t look at me, I’m just here to HODL.”
Bitcoin
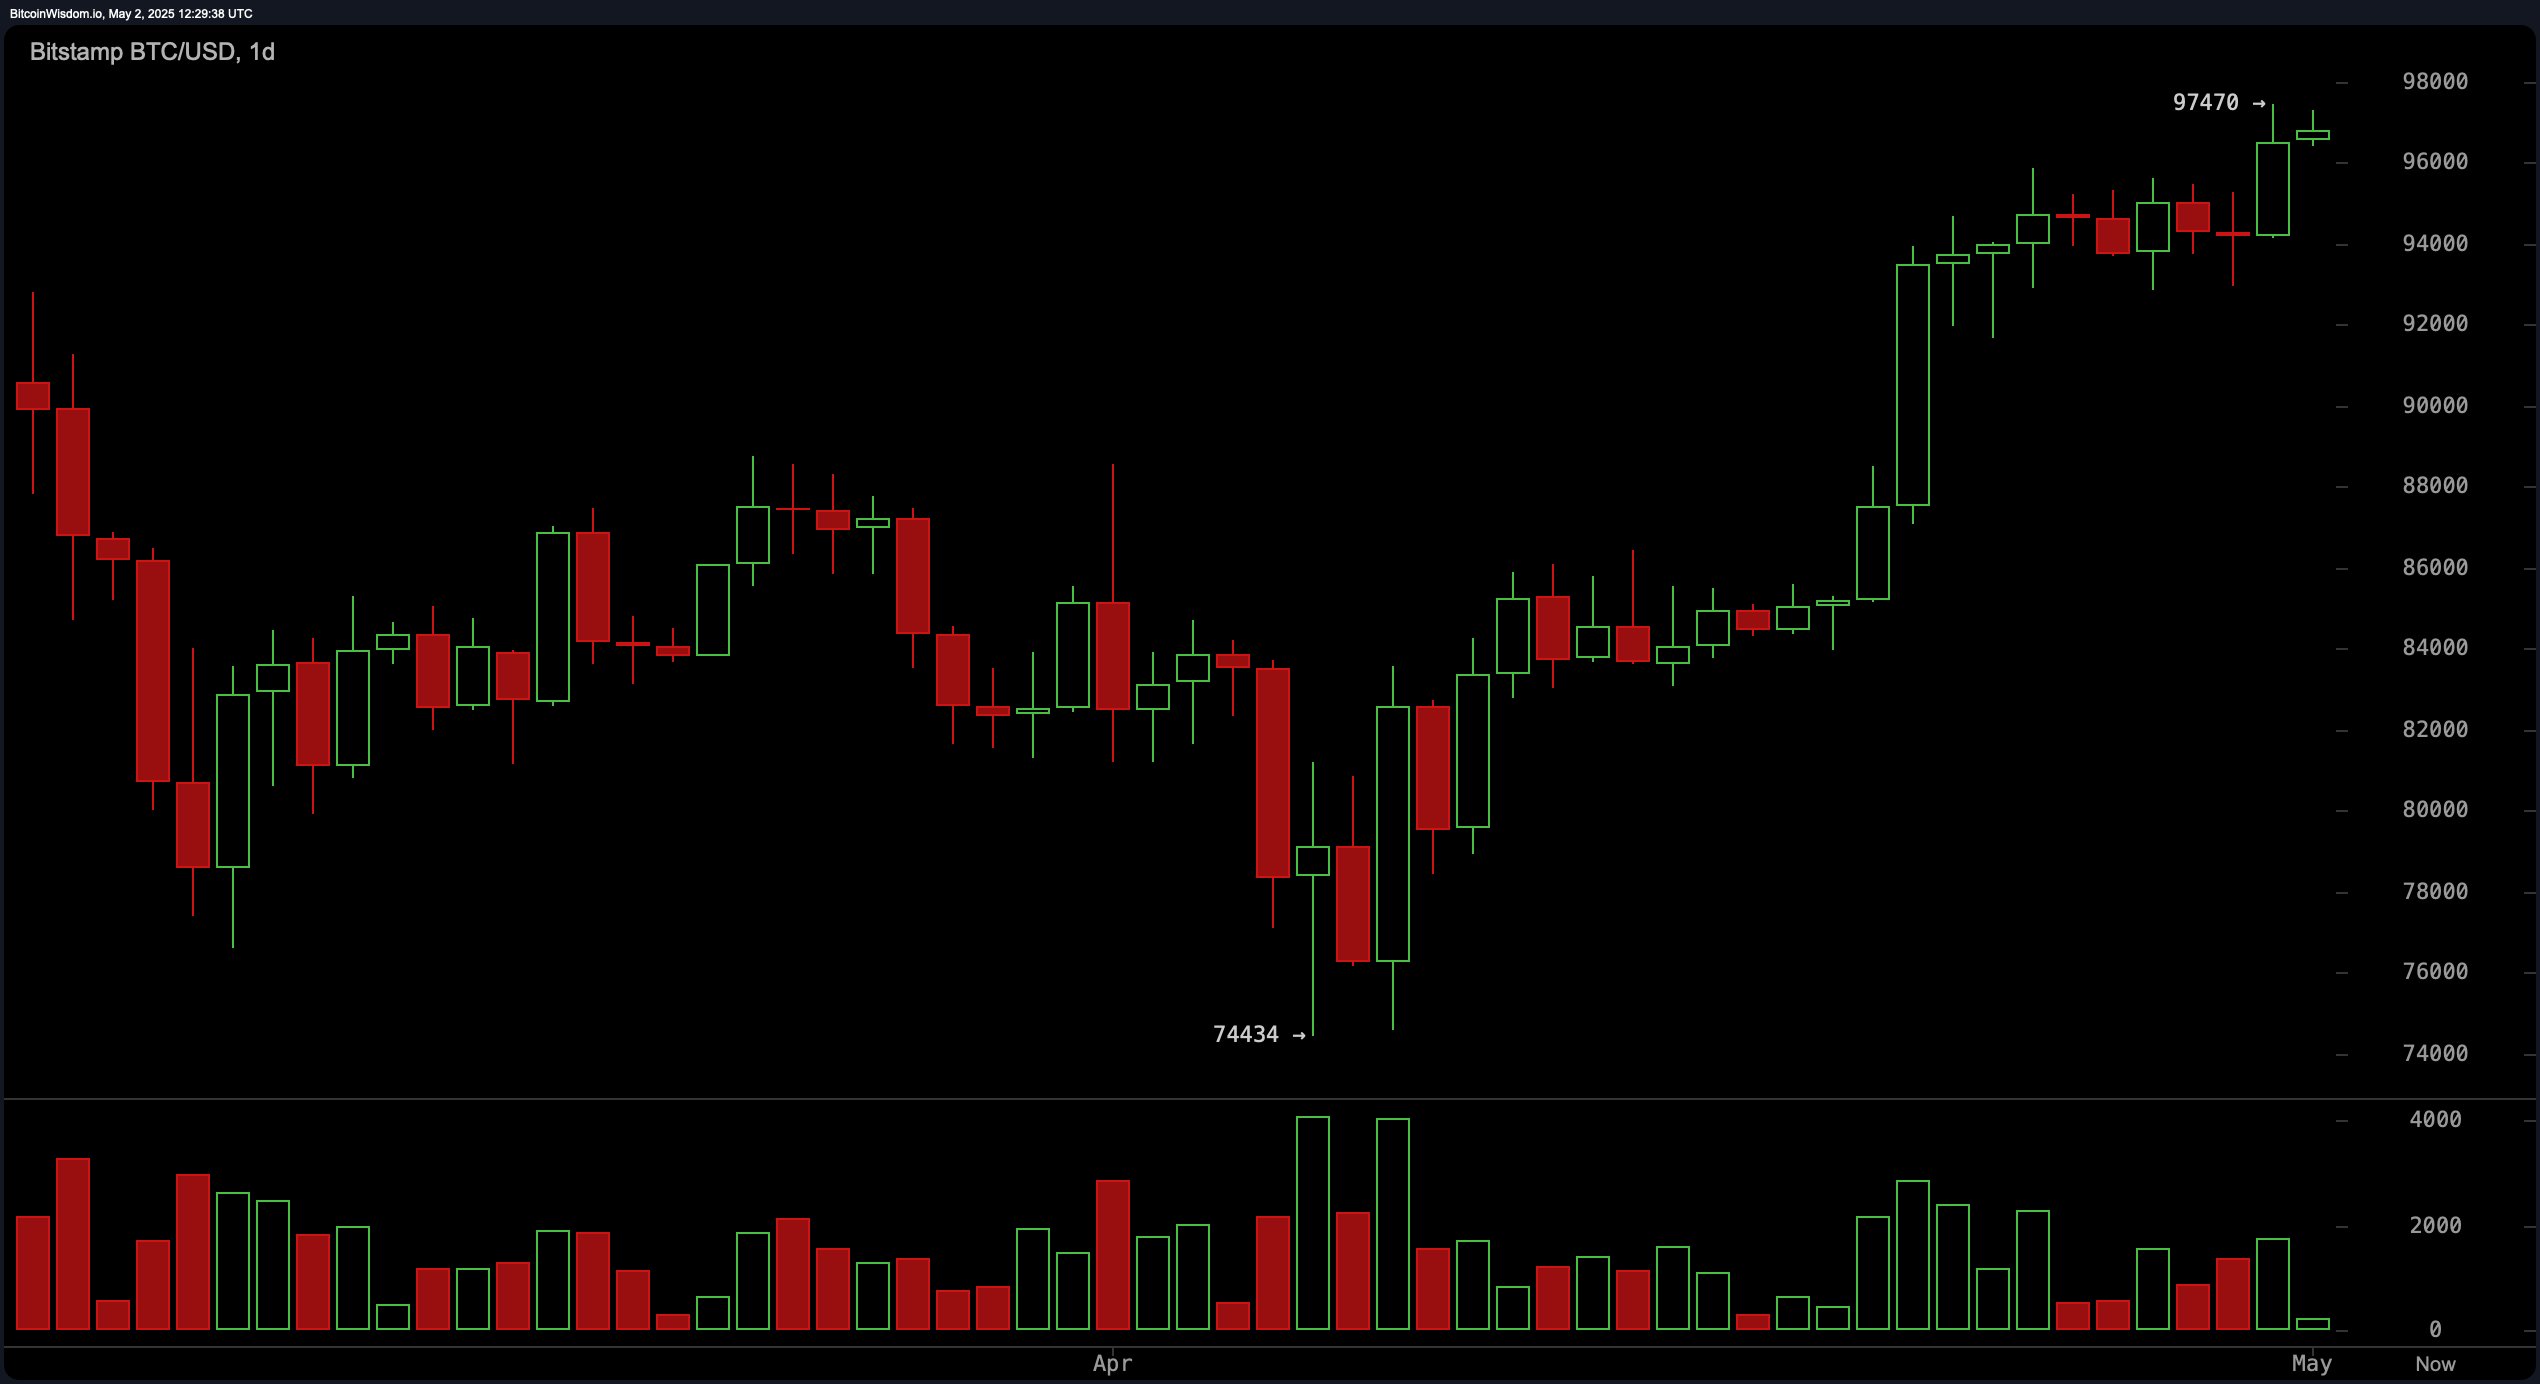
The daily BTC/USD chart is showing all the subtlety of Bridget Jones after two vodkas: breaking free from the old $74k–$84k “I swear I’m happy here” rut and bolting up to $97,470. This, it seems, is what happens when there’s actual market support—plus the emotional support of thousands of Twitter traders yelling “TO THE MOON 🚀!” Price action is already flirting with its next ascending triangle (that’s a technical formation, not a yoga pose). Floor is pretty firm at $88,000, ceiling getting wobbly at $97,500. Apparently, all the cool traders are waiting for a dip to the $90,000–$92,000 zone—where buying Bitcoin is, theoretically, less terrifying—targeting a fast dash to $97,500 and enough bravado to imagine $100,000. As one does.
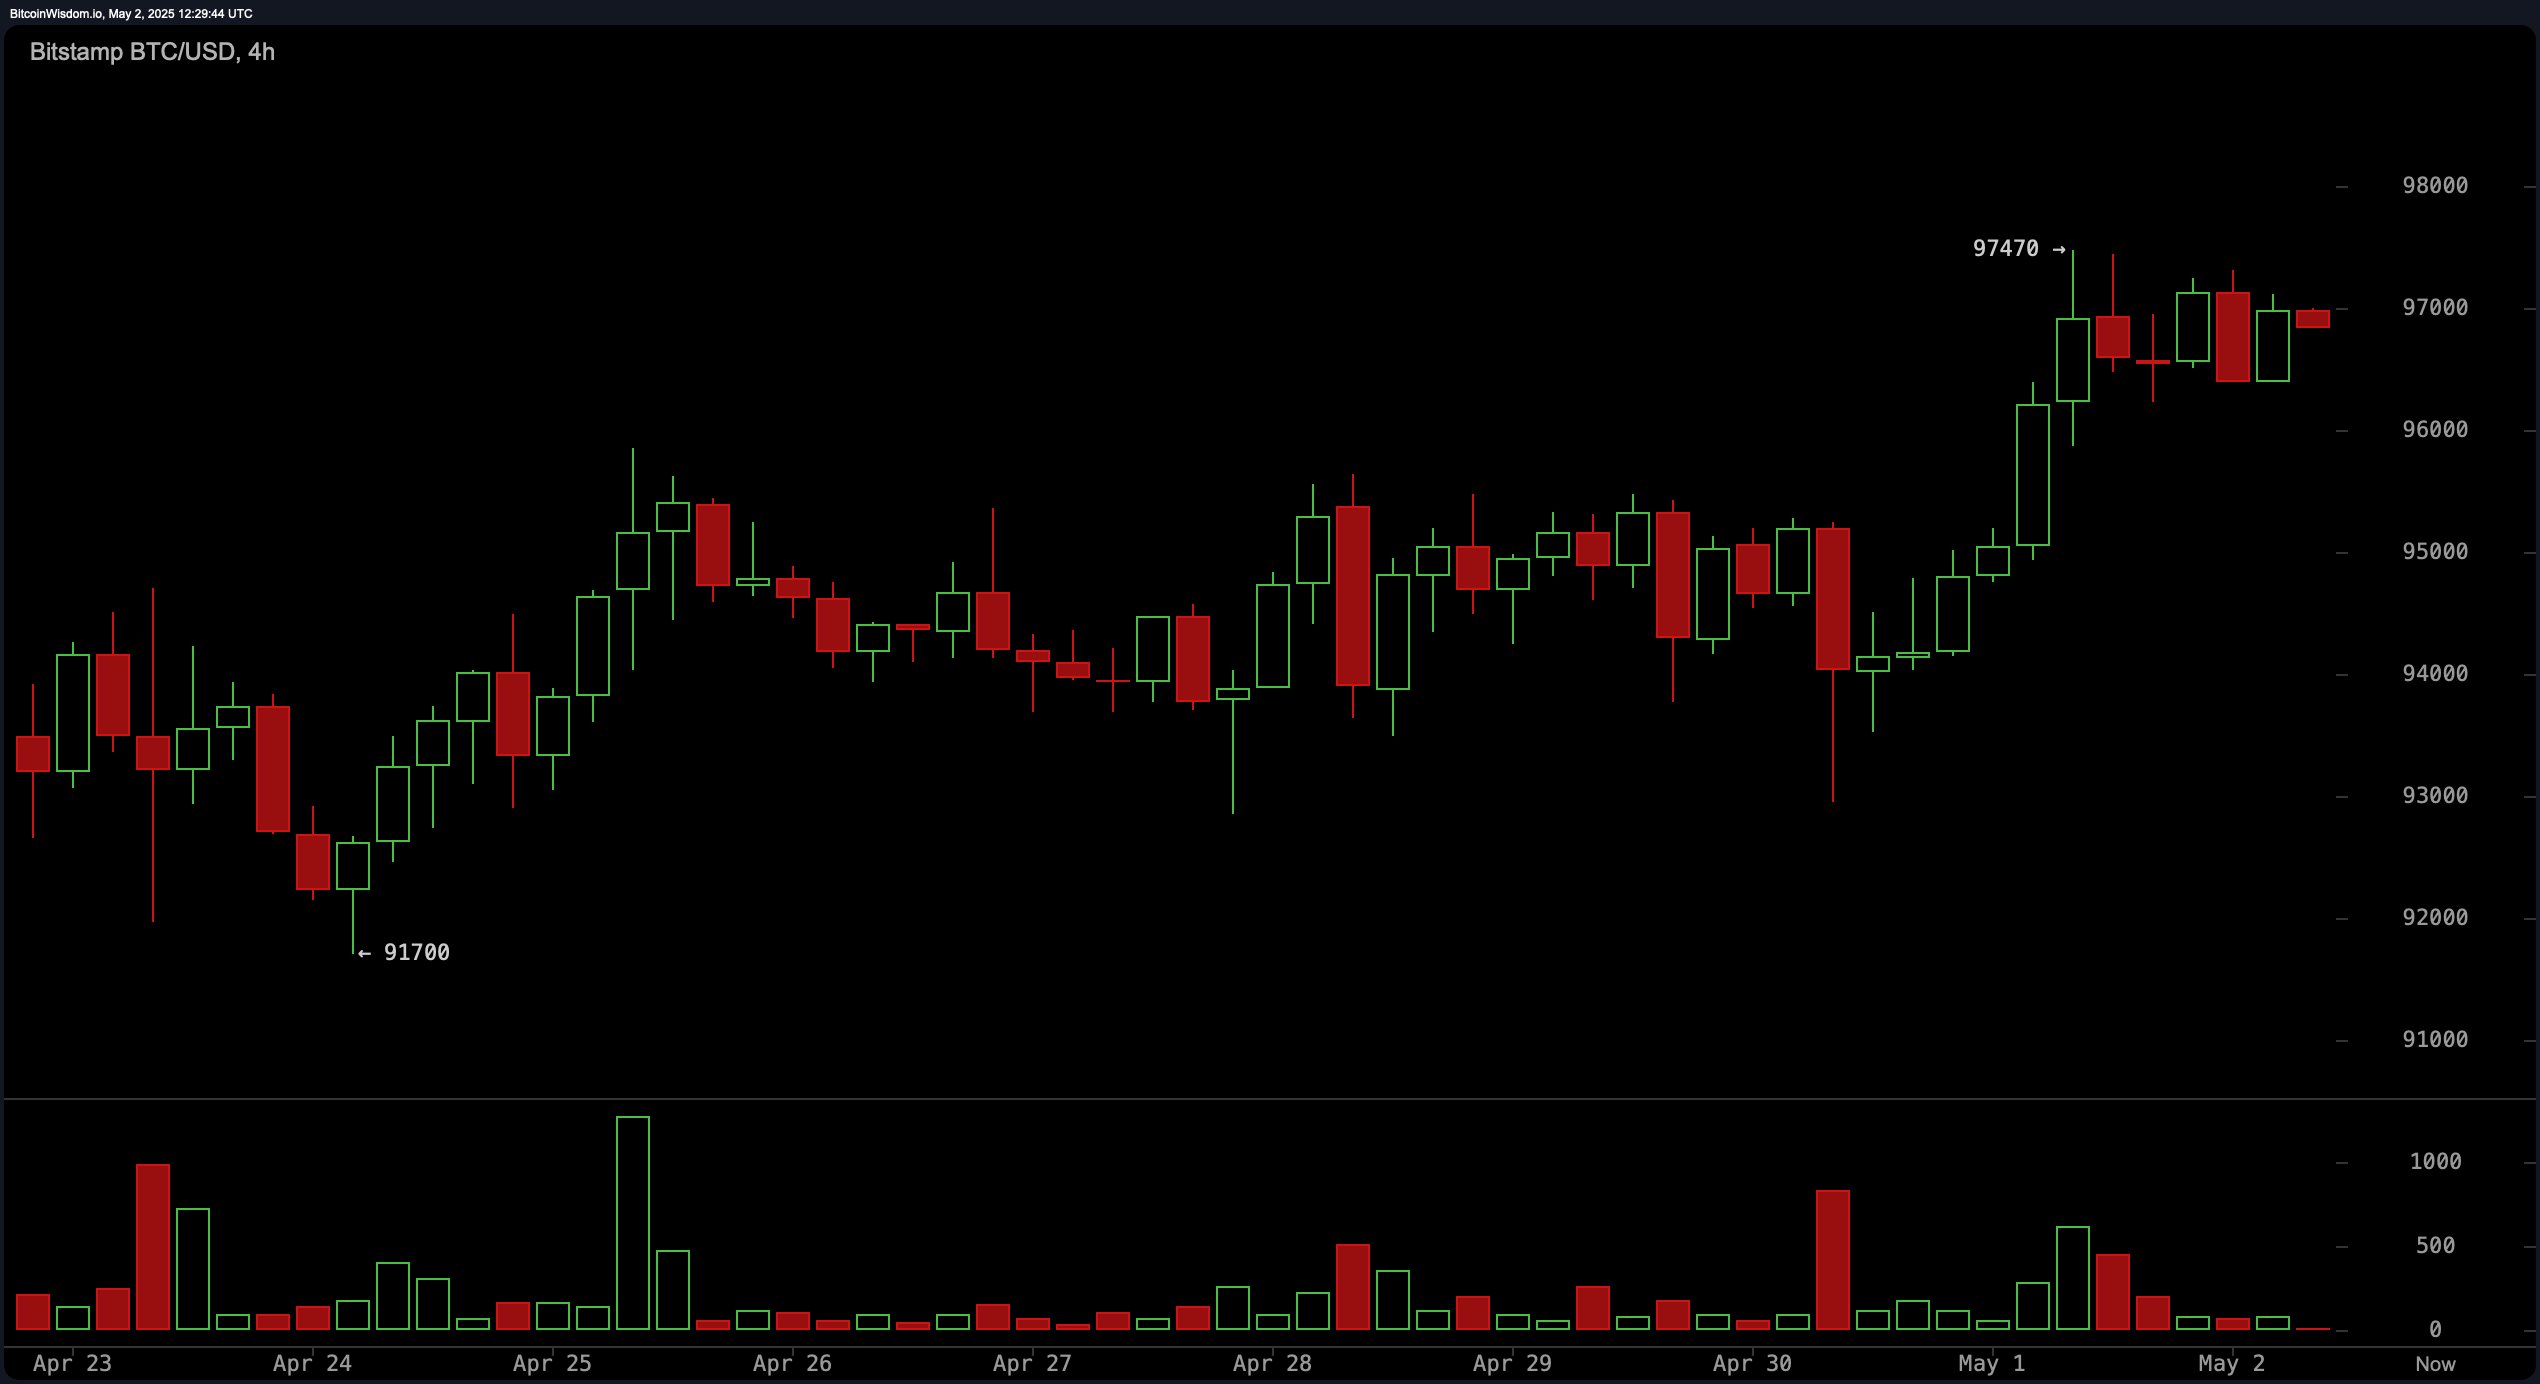
On the 4-hour BTC/USD chart, we are absolutely still in “bullish until proven otherwise” land, with higher highs and higher lows making a tidy staircase to financial FOMO. That $94,000–$95,000 area, which used to be as inviting as a cold igloo, is now suddenly everyone’s cozy support level. Cup-and-handle formation showed up (yes, like the coffee mug you left festering on your desk) giving further “let’s go higher” vibes. Volume is spiking on the way up and going suspiciously quiet on dips. If you see Bitcoin dawdling at $95,000 with feeble selling, that might just be your moment—if your nerves can take it.
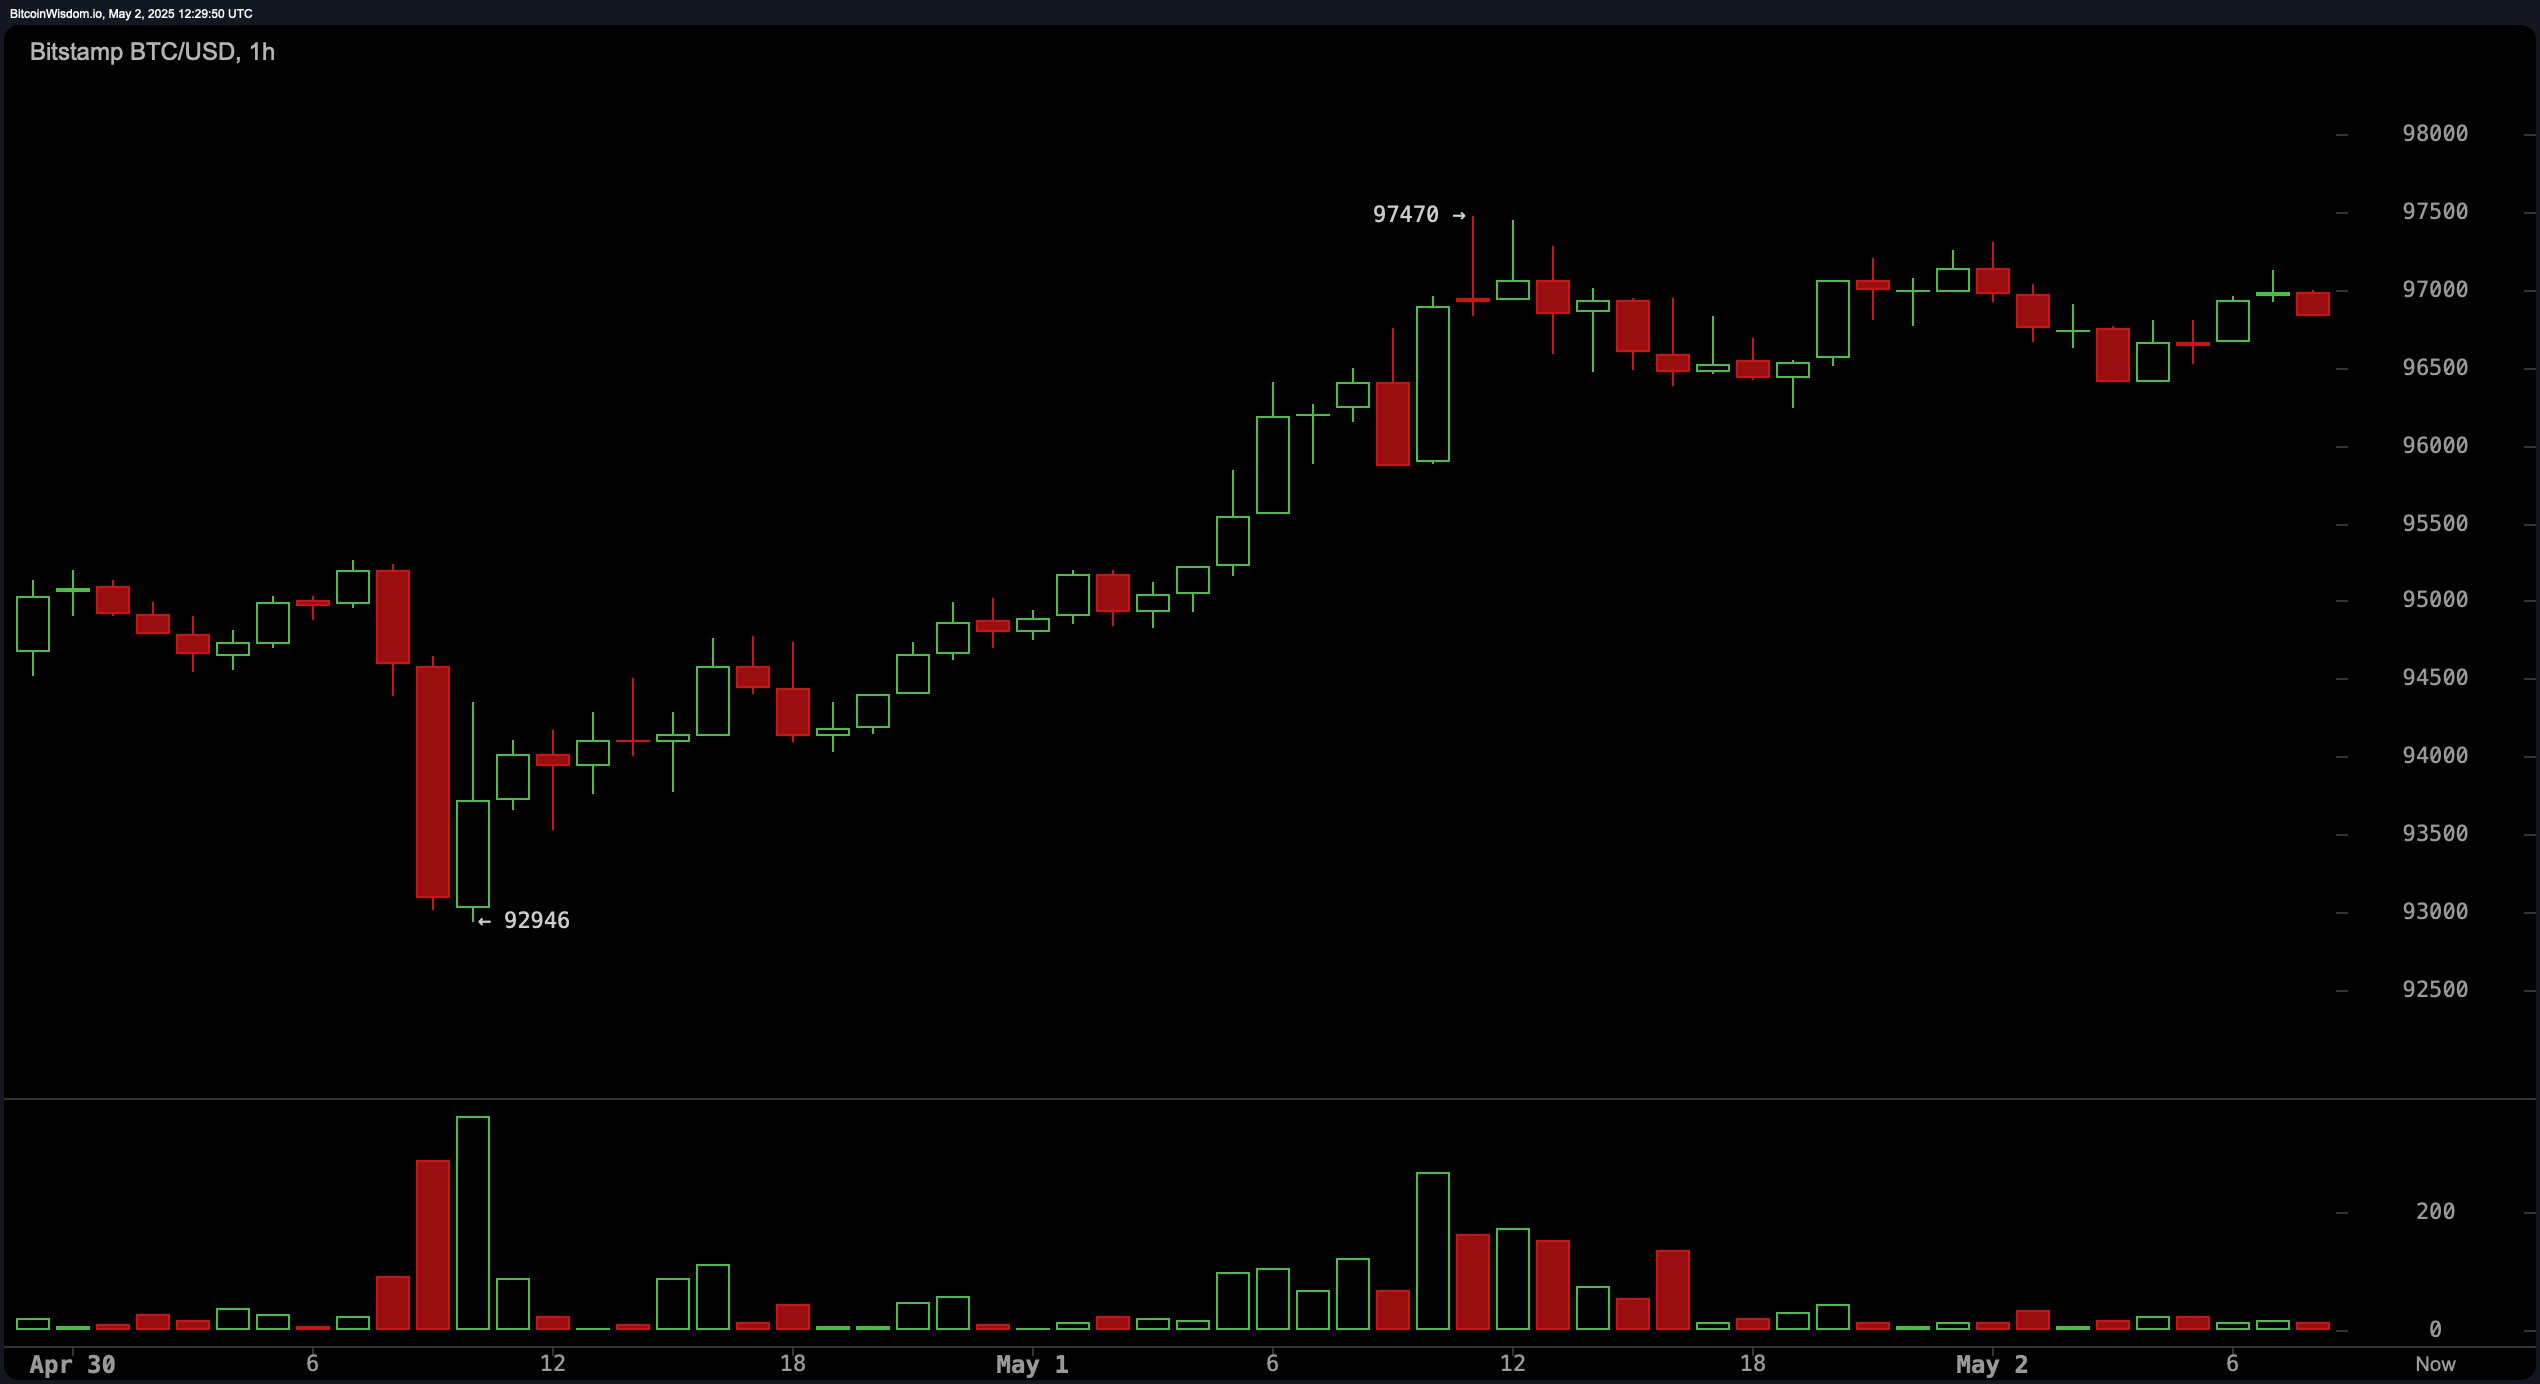
The 1-hour chart decided to keep fans entertained: stage-diving from a low at $92,946 before launching a dramatic V-shaped bounce. A classic bear trap—sorry, doomers. Now it’s eyeing up a tight box at $96,500–$97,500, plotting its next move like a contestant on “The Great British Bake Off.” Volume is getting shy, which usually means something’s brewing. Aggressive types might sprint after a confirmed breakout above $97,500, aiming for an ambitious $99,000–$100,000 finish line. Sensible stop-loss? Maybe just below $96,000, or wherever your anxiety threshold begins.
Oscillator data is basically like reading horoscopes: mostly neutral, slightly optimistic, but not ruling out existential calamity. RSI, Stochastic, CCI, ADX—yawn, neutral. Only the awesome oscillator and MACD have dusted off the “buy!” trumpet, while the momentum indicator is their grumpy friend yelling “SELL!” from the sidelines. TL;DR: maybe just wait for some actual volume to show up before panic-buying or selling.
All the moving averages—EMA, SMA, all heavily acronym’d and at various lengths—are shouting “BUY BUY BUY” like Bitcoin is on closeout sale at Argos. (No promises you’ll get it for a tenner, but hope springs eternal.) Structure looks stubbornly bullish no matter how you slice it. Just keep an eye on that $97,500 resistance—if Bitcoin charges through, the $100,000 memes might just become a reality. Or not. It’s Bitcoin, after all. 🤷♀️
Bull Verdict:
A technical fairy tale: all the moving averages are aligning, the daily breakout is confirmed, and there’s enough buying volume to convince even the most pessimistic auntie. If Bitcoin can hop past $97,500 like a rabbit in spring, bears beware—the road to $100K is wide open. (Cue confetti and nervous laughter from sensible adults everywhere.)
Bear Verdict:
But before you tattoo those laser eyes on your profile picture, caution: $97,500 is looking as stubborn as last season’s love interest. Mixed oscillator signals suggest a little market fatigue, and if price gets stomped down—especially as volume dries up—say hello to a possible “back to $94k–$92k” plot twist. Keep tissues and emergency snacks handy just in case.
Read More
- Clash Royale Best Boss Bandit Champion decks
- Vampire’s Fall 2 redeem codes and how to use them (June 2025)
- Mobile Legends January 2026 Leaks: Upcoming new skins, heroes, events and more
- World Eternal Online promo codes and how to use them (September 2025)
- How to find the Roaming Oak Tree in Heartopia
- Best Arena 9 Decks in Clast Royale
- Clash Royale Furnace Evolution best decks guide
- Clash Royale Season 79 “Fire and Ice” January 2026 Update and Balance Changes
- Clash Royale Witch Evolution best decks guide
- Brawl Stars December 2025 Brawl Talk: Two New Brawlers, Buffie, Vault, New Skins, Game Modes, and more
2025-05-02 16:27