On July 28th, Solana’s price dropped around 5%, falling from close to $77 to $73. This decrease happened after the price moved below a recent support level, causing some traders to be forced to sell their positions.
Summary
- SOL price dropped from roughly $77 to $73 after failing to sustain its latest recovery.
- Price has fallen below the $75 major pivot and remains inside a descending channel.
- The 4-hour RSI has declined to 35.57, showing weakening momentum without reaching oversold territory.
- Liquidation clusters near $72.50 and $74 could increase volatility around the current price.
Solana price drops back toward $73
As of today, I’m seeing Solana (SOL) trading around $73.20. It peaked yesterday around $77 before dropping, representing roughly a 5% decrease from that high.
Solana (SOL) experienced a price decrease after unsuccessfully attempting to break through a key resistance level. While buyers briefly pushed the price up to around $77 on July 27, it couldn’t surpass the upper limit of a downward-trending channel or the broader $78 resistance zone.
Once the price of SOL dropped below $75 – a level that had previously caused some temporary price increases – selling pressure increased. The price then decreased to around $73 before stabilizing within a small trading range.
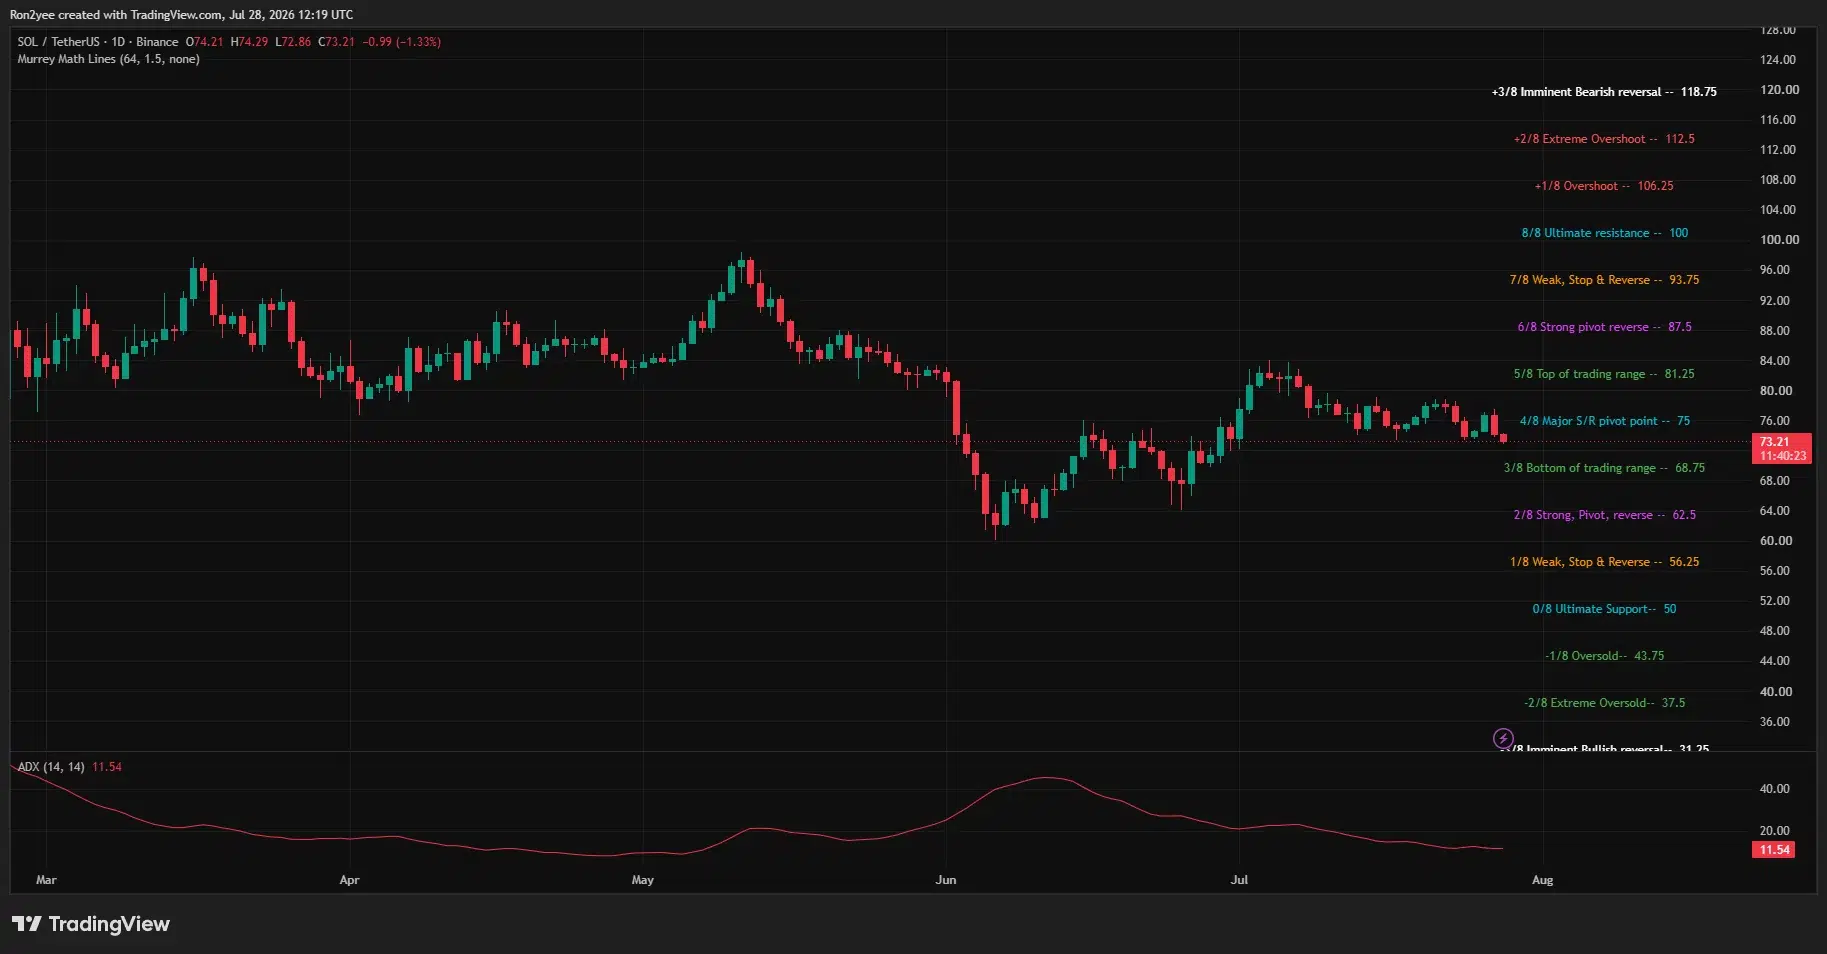
Looking at the daily price chart, Solana (SOL) was trading under a key support level around $75, identified using Murrey Math. While it briefly dropped to $72.86 on July 28th, buyers stepped in and prevented the price from staying below $73.
Solana’s price dropped partly because investors started favoring Ethereum instead. While Ethereum recently rose above $1,900, Solana continued to struggle to break past a previous high point from July.
Crypto trader Daan Crypto Trades observed that the price pair was starting to fall below a key support level.
Solana needs to move past its current trading pattern before it can realistically challenge higher price levels.
From my analysis, Ethereum has been outperforming Bitcoin lately, and unfortunately, Solana hasn’t kept pace. This has made the Ethereum ecosystem a much more appealing option for investors, while Solana’s ecosystem currently appears less robust.
Long liquidations accelerated the sell-off
A recent analysis of trading data shows that the price of Solana fell sharply, triggering liquidations for traders who had bet on it staying above $75 and $73.
Solana’s price initially fell below $75 and then quickly dropped past $73, where more selling pressure emerged. This decline probably caused traders who had bet on the price going up – using borrowed funds – to sell their holdings, which further increased the number of sell orders in an already struggling market.
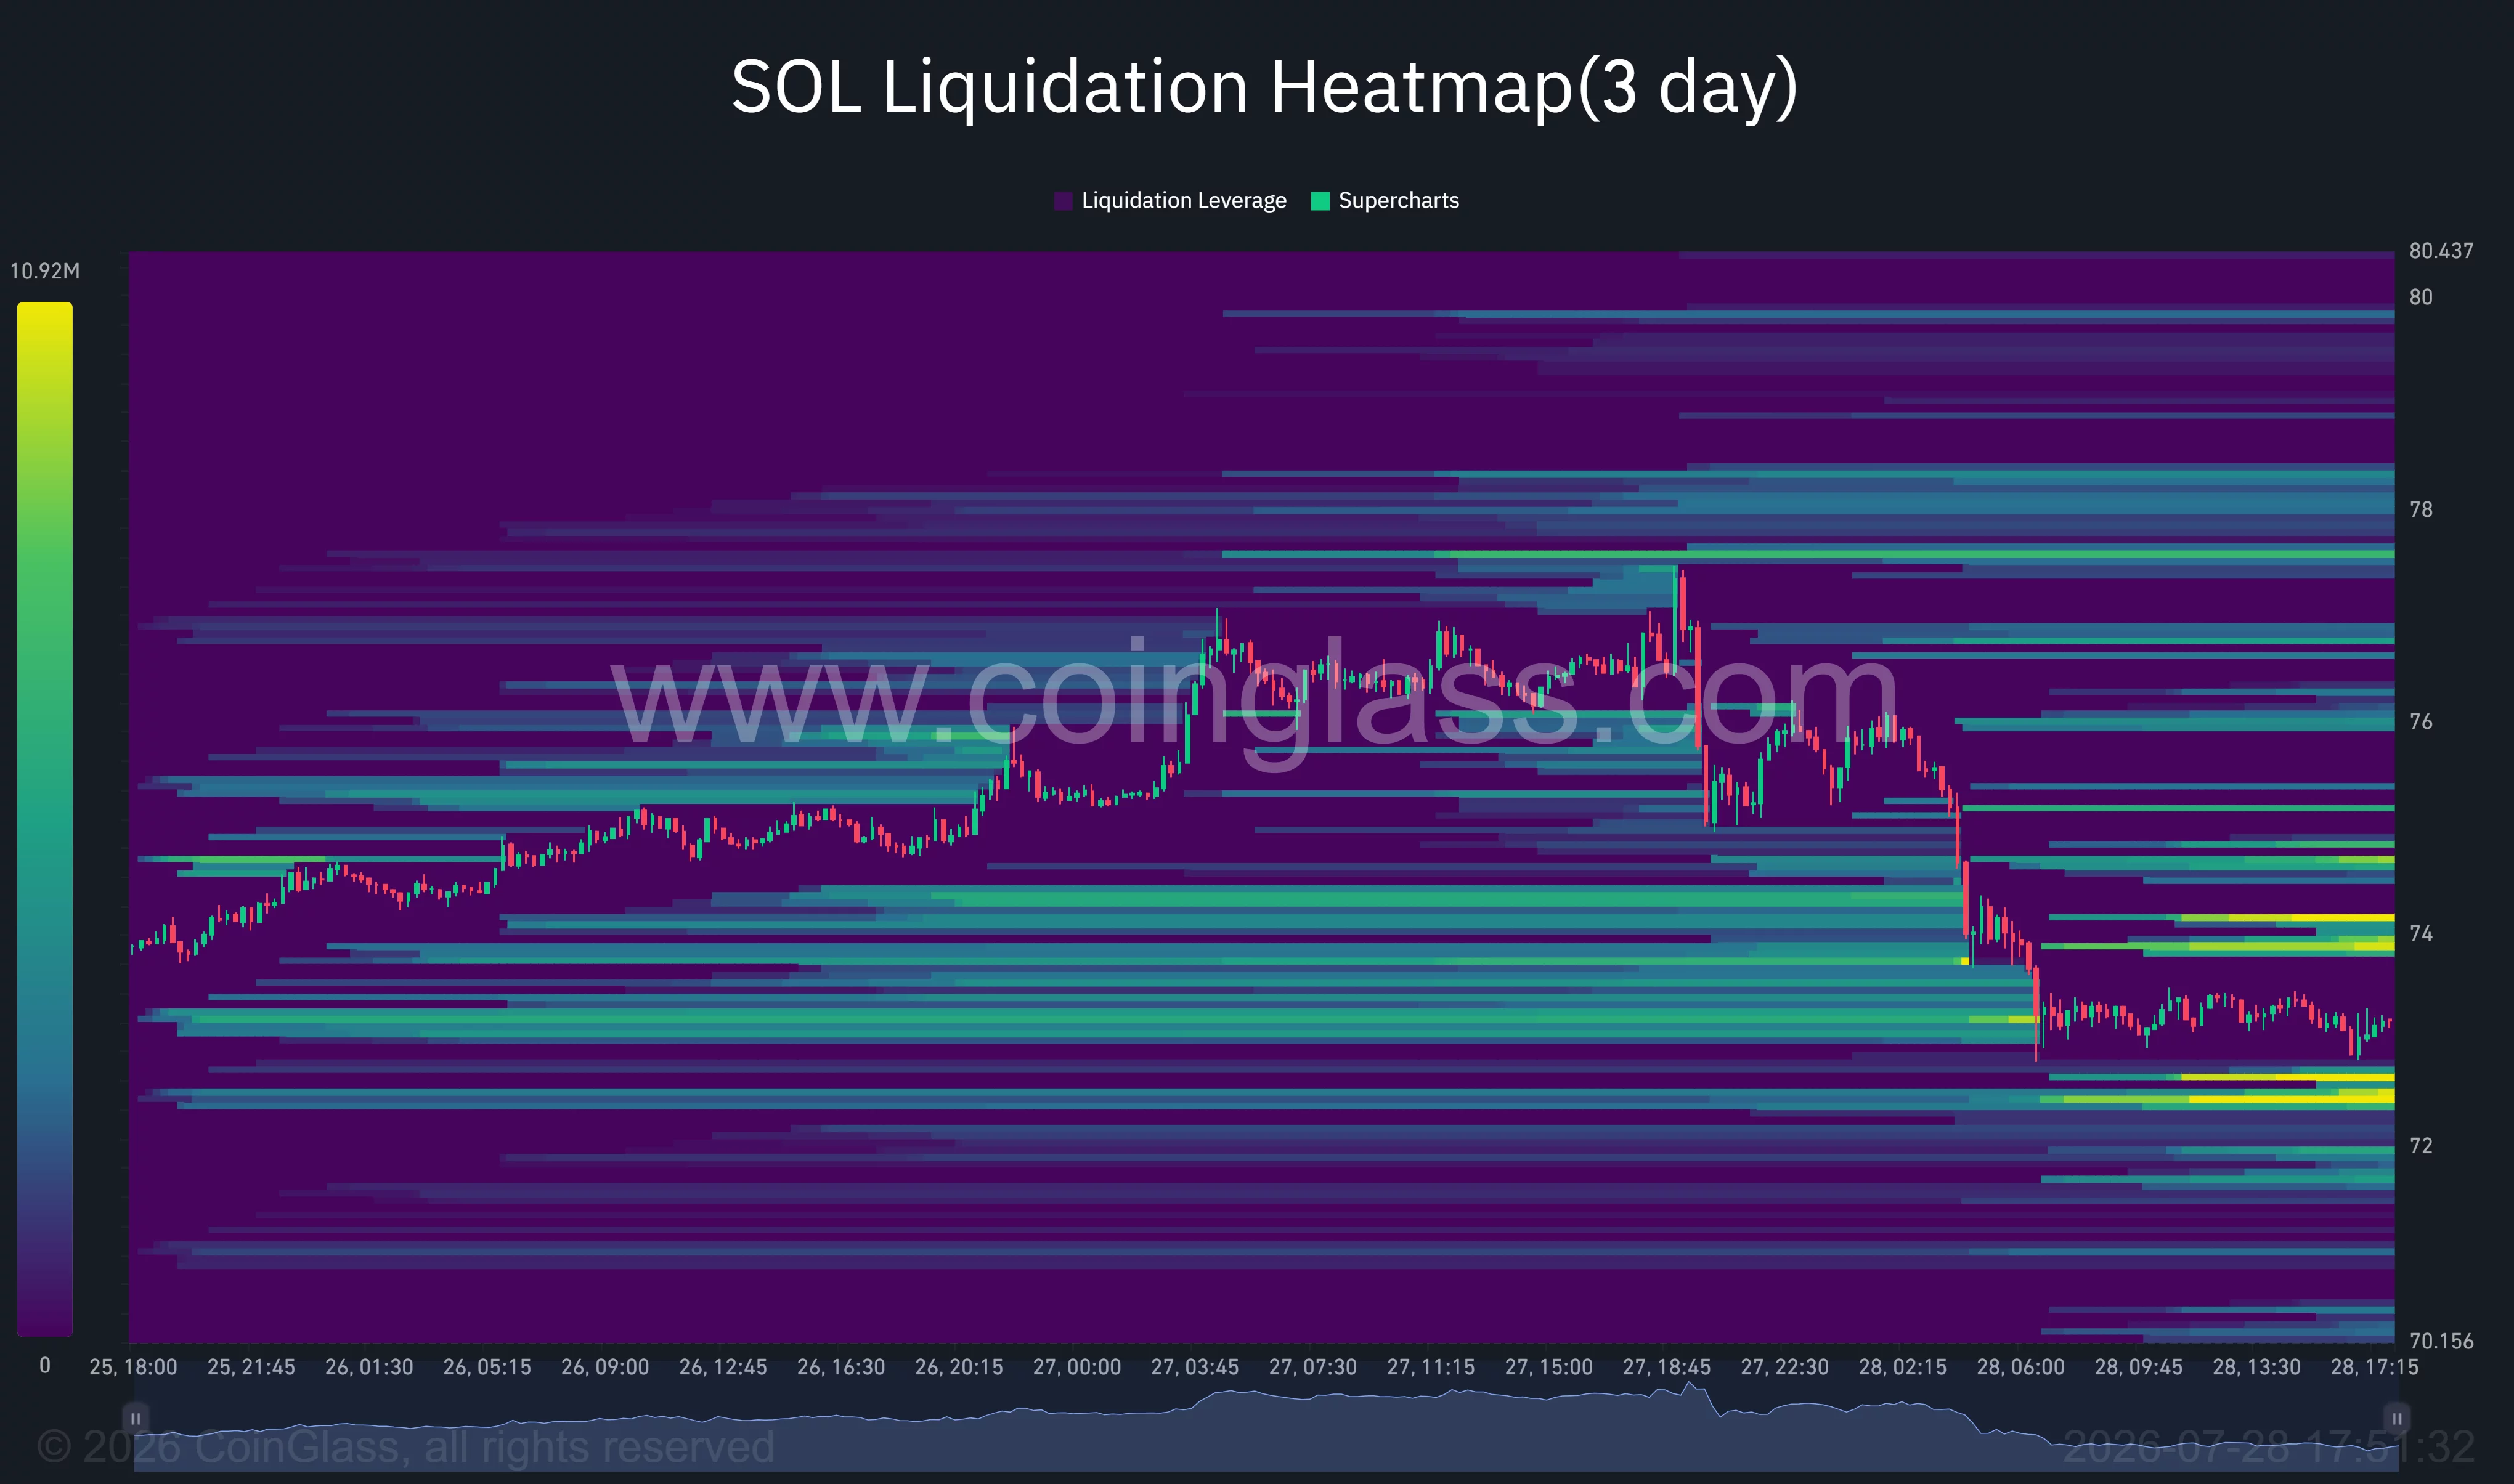
The heatmap indicates significant buying and selling activity happening on both sides of the current price point. There’s a strong area of liquidity – meaning many orders are clustered together – between $72.40 and $72.70, with further concentrations appearing around $73.80 to $74.20.
This situation could cause price fluctuations in the short term. If the price falls below $73, it might pull SOL down towards lower buying levels. Conversely, a quick price increase could aim for the concentrated buy orders near $74.
We’re seeing potential selling pressure around $75 and $76.50. If buyers step in, these prices could be targets, but they might also act as barriers, as traders looking to cut their losses could sell at those levels.
Data on liquidations suggest that trading in derivatives worsened the price drop. However, looking at the charts doesn’t definitively prove that large institutional sales were the primary cause.
SOL indicators point to weak momentum
Solana’s price has been trending downwards within a defined channel since early July, when it reached over $83. This channel is characterized by consistently lower peaks, with the price recently facing resistance around $79 and $77.
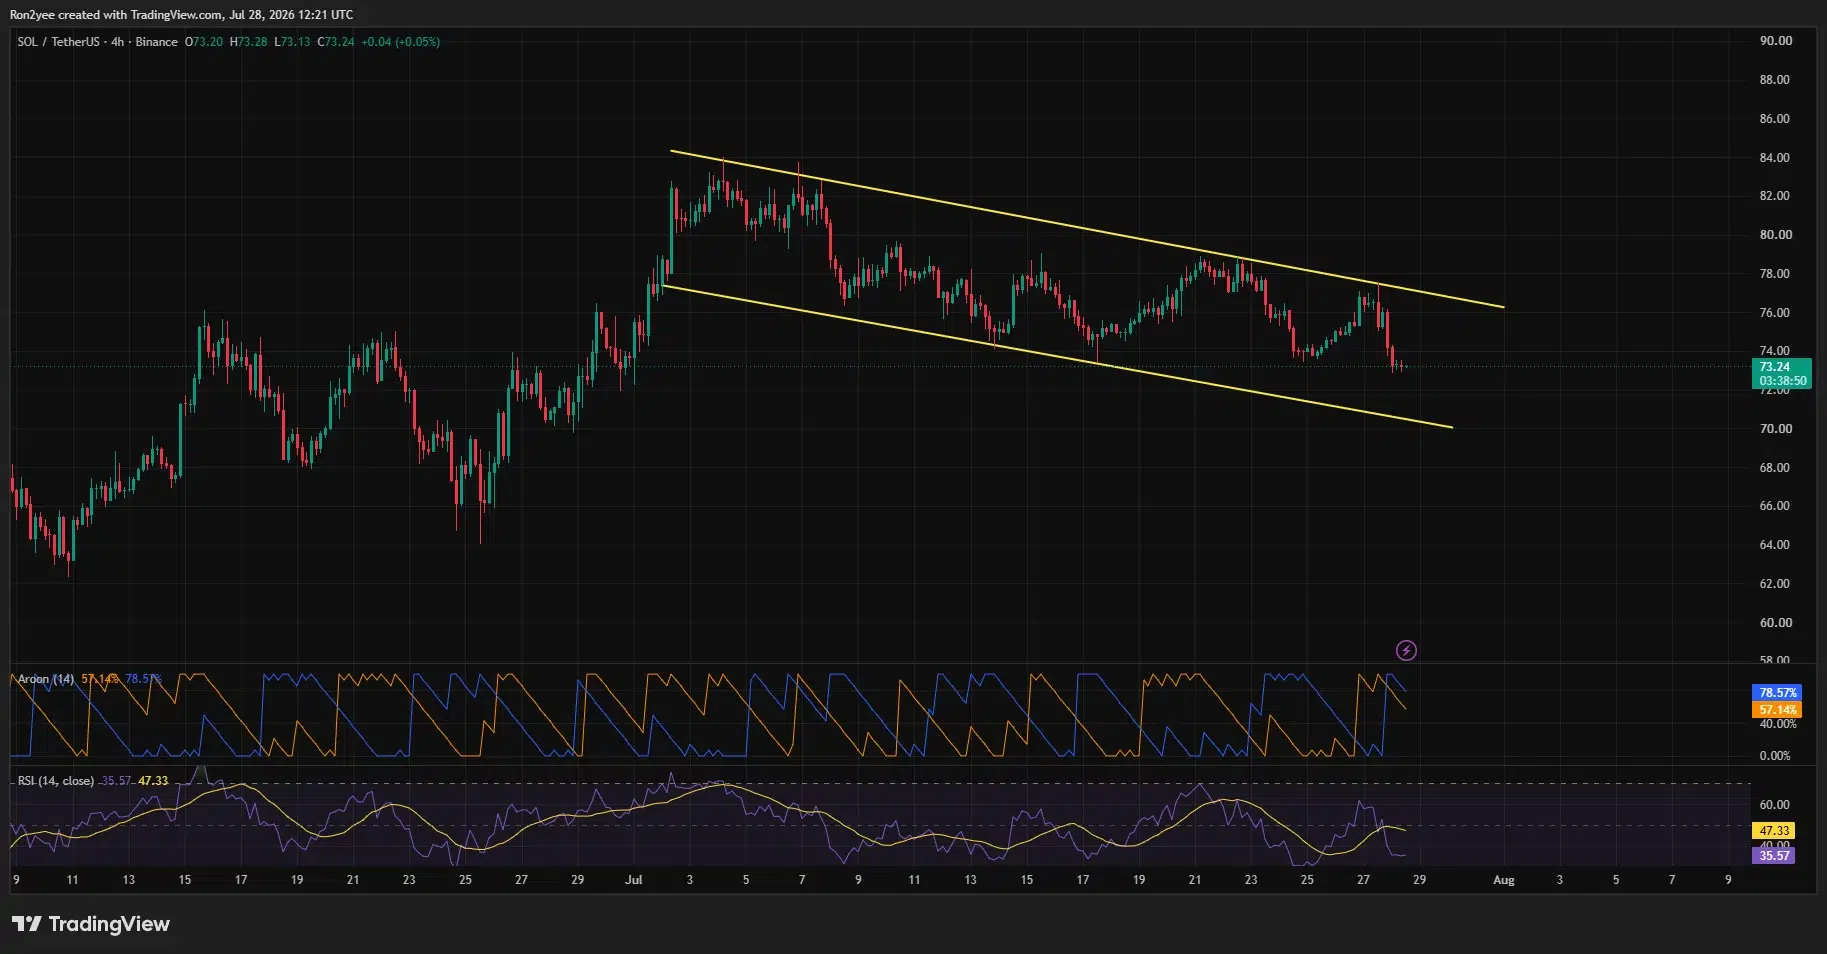
Solana (SOL) is currently heading towards the lower end of its trading channel. If it drops below $73, the $70 level will likely act as the next significant support point.
The 4-hour RSI has dropped to 35.57, which is lower than its average of 47.33. This indicates that selling pressure is currently stronger than buying pressure, though Solana is not yet considered oversold – that typically happens when the RSI falls below 30.
Aroon indicators suggest prices are likely to continue falling. The primary Aroon line is at 78.57%, significantly higher than the secondary line at 57.14%. This indicator focuses on how recently Solana (SOL) has made new highs and lows, not *how much* it’s moved – and right now, it aligns with SOL’s recent price dip to a new low.
Looking at the daily price movements, the Average Directional Index (ADI) is currently quite low at 11.54. Generally, an ADI below 20 means there isn’t a strong trend happening. This suggests that Solana (SOL) is still stabilizing and hasn’t yet started a clear downward move.
The recent price dip creates a risk of temporary drops below the $73 support level. SOL might briefly fall lower to find buyers, especially if the pressure from futures and options trading decreases.
Solana price levels to watch next
Solana needs to climb back above $74 to start a recovery. If it does, it could then test the $75 level, which is now acting as a resistance point after previously supporting the price.
If the price consistently closes above $75, it could signal that the recent downward trend is losing steam. To confirm a potential recovery, buyers would then need to push the price past $77–$78 and break out of the current declining pattern, which could lead to a retest of the $83 peak seen in July.
If SOL doesn’t rise back above $75, it could fall to around $72.50, potentially triggering further losses. If it breaks through that level, the next support area to watch would be near $70.
The Murrey Math chart suggests a key support level around $68.75, marking the low end of the current trading range. If the price falls below $70, this level is likely to offer stronger support. While a more significant drop could potentially reach $62.50, current market indicators don’t yet suggest that’s likely to happen.
Fed decision adds risk for US traders
Investors in the US are watching closely to see what the Federal Reserve will do next. Changes in interest rates, the value of the dollar, and government bond yields can all influence how much people invest in riskier options like SOL.
On July 28th, Treasury yields decreased and oil prices dropped as investors reacted positively to signs of improving diplomatic efforts in the Middle East. Brent crude fell below $87 per barrel and US crude traded near $81, partially offsetting earlier price increases linked to inflation. This decline was reportedly triggered by a reduction in attacks and growing optimism about a potential agreement between the US and Iran.
From my analysis, SOL’s recent drop seems more tied to its internal technical issues and how much borrowing is involved, rather than being caused by rising oil prices or Treasury yields. While the Federal Reserve’s upcoming decision could potentially help SOL bounce back up to around $75, it could also worsen the situation and lead to further declines. It really hinges on whether we see an improvement in overall liquidity.
2026-07-28 16:48