Key Takeaways
- Two-session gains now total roughly a third of SHIB’s value.
- Short liquidations outpaced longs by more than 2.5 times over 24 hours.
- Futures volume dwarfs spot activity across major exchanges.
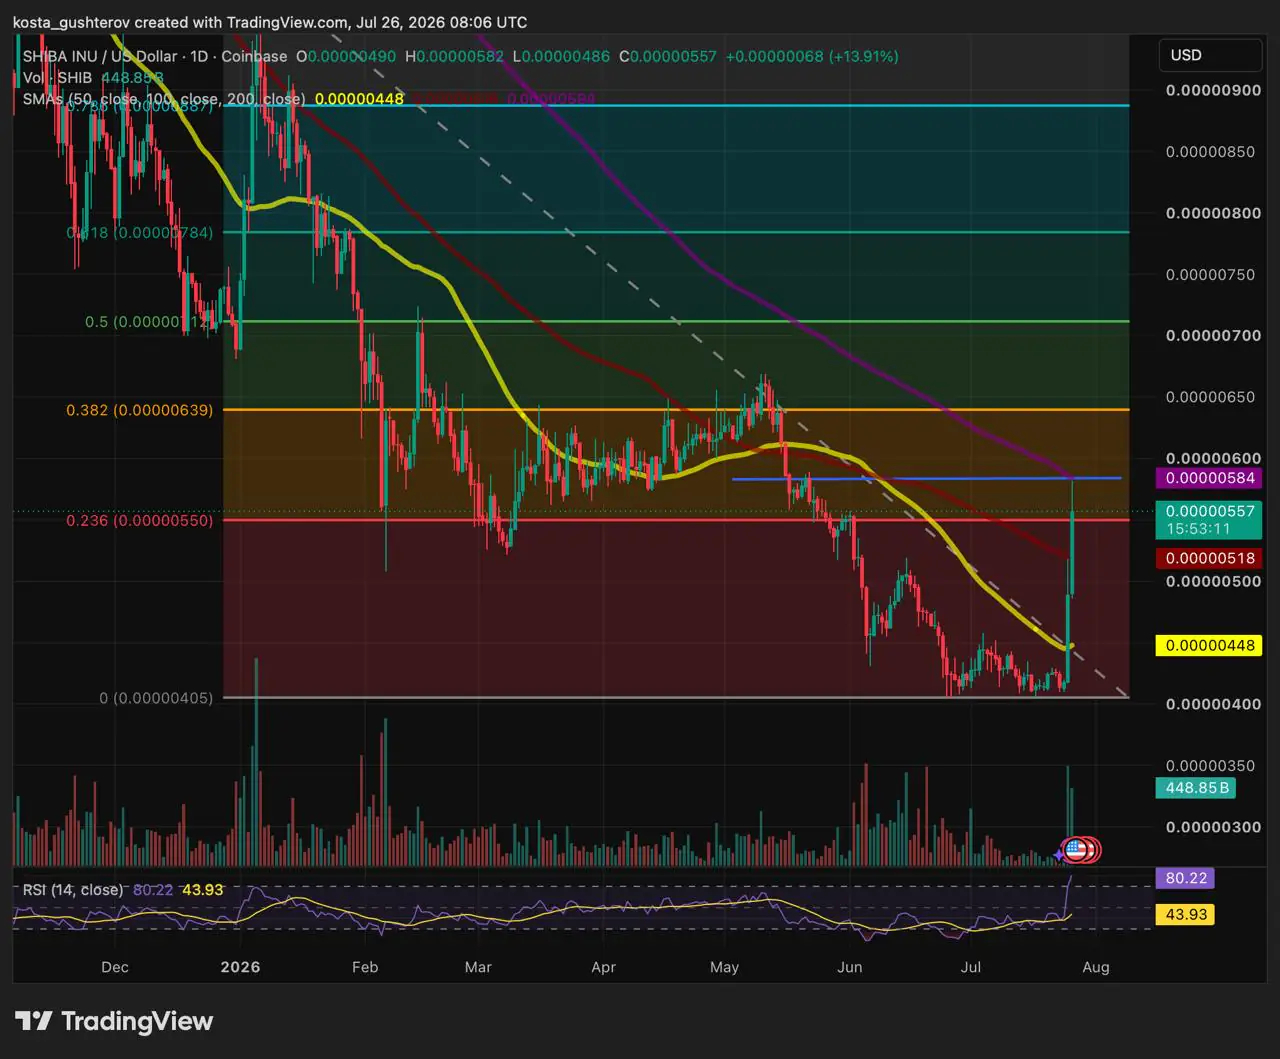
The price peaked right around $0.00000584, which is a key long-term moving average. It finished the day above two important support levels: a shorter-term moving average at $0.00000519 and a Fibonacci retracement level at $0.0000055 – both of which had limited price movement yesterday.
After jumping 18% yesterday, SHIB has now increased in value by about a third in just two days. This significant rise has broken through two key resistance levels, but it’s also led to a high Relative Strength Index (RSI) of around 81, indicating the cryptocurrency may be overbought.
Shorts Are Bearing the Cost of the Squeeze
Recent price increases have been particularly damaging to traders who bet against Shiba Inu (SHIB). Data from Coinglass shows that over the last 24 hours, approximately $2.65 million worth of SHIB positions were closed due to liquidation. Of that amount, around $1.93 million came from losing short positions – more than 2.5 times the losses experienced by those betting on price increases (long positions). This trend was even more pronounced in the last four hours, with shorts accounting for $508,000 of the total $773,000 in liquidations.
Funding rate data helps explain the recent price increase. For much of July, SHIB’s funding rate – which measures the cost of holding leveraged long positions – was consistently positive, with the biggest increases happening right before this week’s price jump. This positive rate indicated that many traders were already betting on a price increase, and likely made the move even bigger once the price broke through a key technical level and forced those betting against it to buy back in.
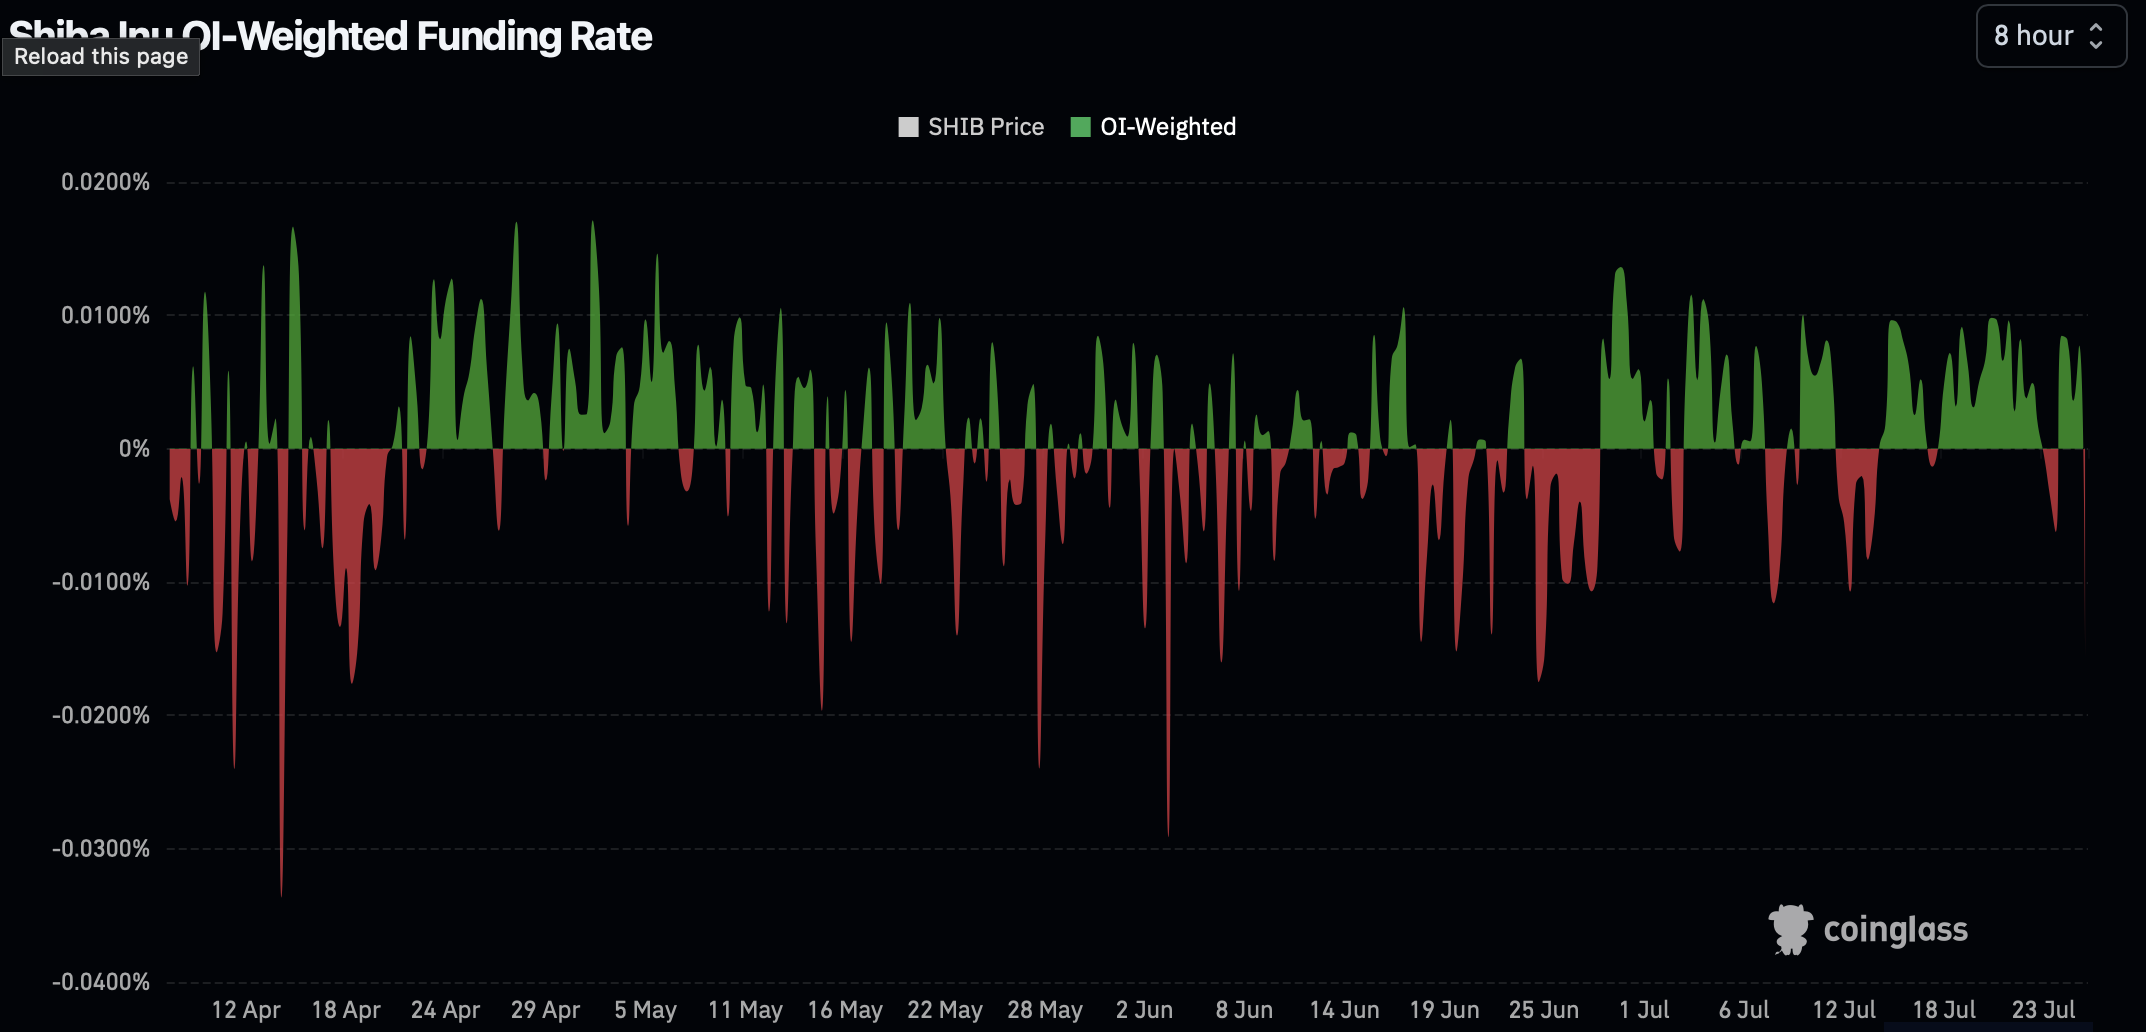
Current market signals suggest the recent price increase is being fueled significantly by leveraged trading, meaning traders are borrowing to amplify their bets. While real buying interest likely exists, a portion of the price gain appears to be due to traders being forced to cover their positions, rather than solely driven by strong, new investment.
Futures Volume Dwarfs Spot Activity
Trading data reveals that most activity is focused on derivatives, not direct purchases (spot markets). While Upbit (~$57.6 million) and Binance (~$41.6 million) lead in direct purchases, other exchanges like OKX, Bybit, Gate, and Coinbase are significantly behind. Notably, trading in futures contracts on OKX reached around $432 million – more than seven times its direct purchase volume and about ten times the total direct purchase volume of all exchanges combined.
The high concentration in futures markets suggests a potentially risky move driven by a lot of borrowing, as traders are likely selling off positions to cover debts and raise funds.
The 200-Day SMA Is Now the Level to Watch
After breaking through key resistance levels, the price is now testing the 200-day Simple Moving Average (SMA) at $0.00000584. The price briefly touched this level earlier today before falling back. This SMA is significant because it coincides with a previous high from February, creating a strong resistance zone. This combination of the moving average and past price behavior makes this level a particularly important test.
If SHIB closes the day above its current level, it would be the first time since the price started falling, potentially leading to a rise towards $0.00000639. However, if the price fails to break through, the attempt would likely mirror yesterday’s, hitting resistance without a clear signal. In that scenario, the price would likely find support around $0.00000519, and then around $0.0000055.
When the Relative Strength Index (RSI) goes above 80, it suggests the price might soon stabilize or briefly fall back, no matter where the day’s trading ultimately ends. Two days in a row of large gains, especially when driven by futures trading, usually need some time to settle before we can be sure it signals a lasting trend change and isn’t just a temporary surge caused by leveraged trading.
- Disclaimer: This article is for informational and analytical purposes only and does not constitute financial or investment advice. SHIB is a volatile asset, and technical indicators or historical price patterns cannot guarantee future performance. Readers should conduct their own research before making financial decisions.
- Methodology: Technical levels are based on the daily SHIB/USD Coinbase chart via TradingView, captured July 26, 2026. Liquidation, funding rate and exchange volume data are from Coinglass.
2026-07-27 16:41