Ah, the woes of the MANTRA protocol! Its token, OM, has once again decided to tumble below the $0.40 mark, sending traders into a state of mild panic. Why? Because the technical indicators are screaming “sell” as loud as a hound dog on a hot day.
After a rather volatile period, the price of MANTRA (OM) has dropped by 6.2% in the last 24 hours and is down an astonishing 94% over the past month. Once, oh so long ago (around Q1, to be exact), it seemed like OM was on top of the world. But alas, the fateful day of April 13 arrived, and with it, a crash that sent the token from around $6.30 to a measly $0.37 in the blink of an eye. It was like watching a majestic horse fall off a cliff. The market cap of MANTRA plummeted from a handsome $6 billion to less than $700 million. A true tragedy!
What caused this sudden demise? Well, the project claims it was all due to forced liquidations during the weekend trading hours, when liquidity was as scarce as a full moon in a cloudy sky. The team swiftly denied any involvement from Binance (or any specific exchange, really) and quashed rumors of insider selling. Even the ever-calm CEO, John Mullin, jumped into the fray, offering on-chain data to prove that the team’s tokens were still locked away, much like treasures buried in an old chest.
In a bid to soothe the trembling masses, Mullin promised to burn 150 million of his staked OM tokens, taken from the October 2024 mainnet launch. The burn was completed on April 29. But that’s not all, folks! Another 150 million OM from ecosystem partners were set aside for burning, bringing the grand total to 300 million tokens, or about 16.5% of the entire supply. Still, despite these valiant efforts, the price has barely budged. Clearly, investors are still a tad skeptical. 🧐
So where does that leave us? OM continues to trade below crucial support levels, with the 20-day EMA hovering around $0.51, and the 50-day EMA lingering at $0.74. The price is well below both, indicating that the bears are currently in charge, snarling and growling as they trample over any hopes of a recovery.
On the daily chart, the relative strength index (RSI) has plunged to 17.18, one of the lowest levels since the crash. Could this be the bottom? Could we finally see a reversal? Perhaps, but only if buyers decide to intervene and the RSI starts climbing back up from the depths of despair. Fingers crossed, folks.
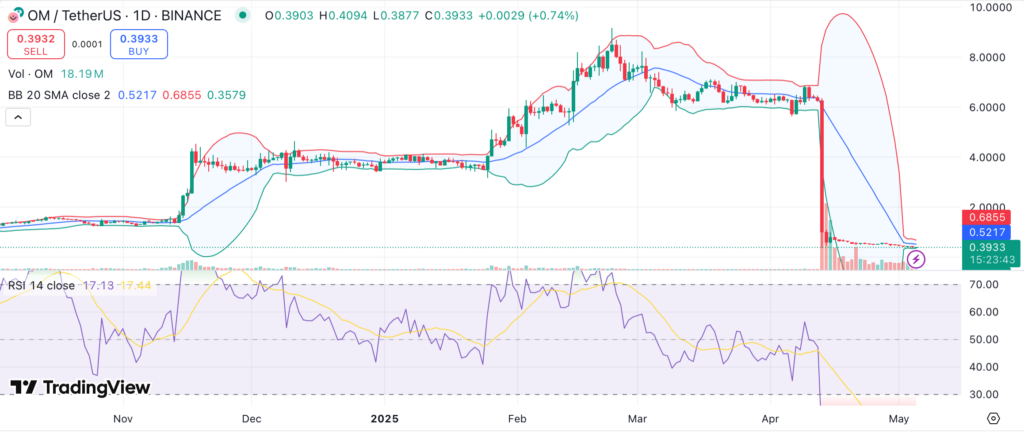
If OM can manage to break above $0.42, it might move toward the $0.50 resistance zone, which coincides with the 20-day EMA. A daily close above $0.54 would be even more bullish, reclaiming the post-crash consolidation range. But, oh, if the selling pressure continues and OM loses support at $0.37, the next psychological level is at $0.30. If that gives way, brace yourselves for a potential freefall, as panic sellers rush in like bees to honey. 🐝
The MANTRA team promises more changes are on the horizon, such as the decentralization of validators and an upgrade to governance. These steps, they hope, will restore some trust over time. But for now, the price action remains as unpredictable as a cat on a hot tin roof. 🐱💥
Read More
- Clash Royale Best Boss Bandit Champion decks
- Vampire’s Fall 2 redeem codes and how to use them (June 2025)
- Mobile Legends January 2026 Leaks: Upcoming new skins, heroes, events and more
- World Eternal Online promo codes and how to use them (September 2025)
- How to find the Roaming Oak Tree in Heartopia
- Best Arena 9 Decks in Clast Royale
- Clash Royale Furnace Evolution best decks guide
- Clash Royale Season 79 “Fire and Ice” January 2026 Update and Balance Changes
- Brawl Stars December 2025 Brawl Talk: Two New Brawlers, Buffie, Vault, New Skins, Game Modes, and more
- Clash Royale Witch Evolution best decks guide
2025-05-05 12:18