Growing momentum signals, combined with multi-year structural similarities to previous accumulation phases, have pushed Litecoin back into the spotlight. Analysts are now reassessing both near-term trends and long-term breakout potential as LTC approaches a key inflection point. 🤡
Litecoin has returned to market focus as traders review a new set of technical signals suggesting a potential shift in momentum. Recent price action and multi-year chart behavior show similarities to previous accumulation phases that preceded major rallies, leading to renewed discussion around updated Litecoin price predictions. 📉✨
This article examines current chart structures, sentiment indicators, and analyst interpretations shaping the near-term and long-term outlook for LTC. 🕵️♂️
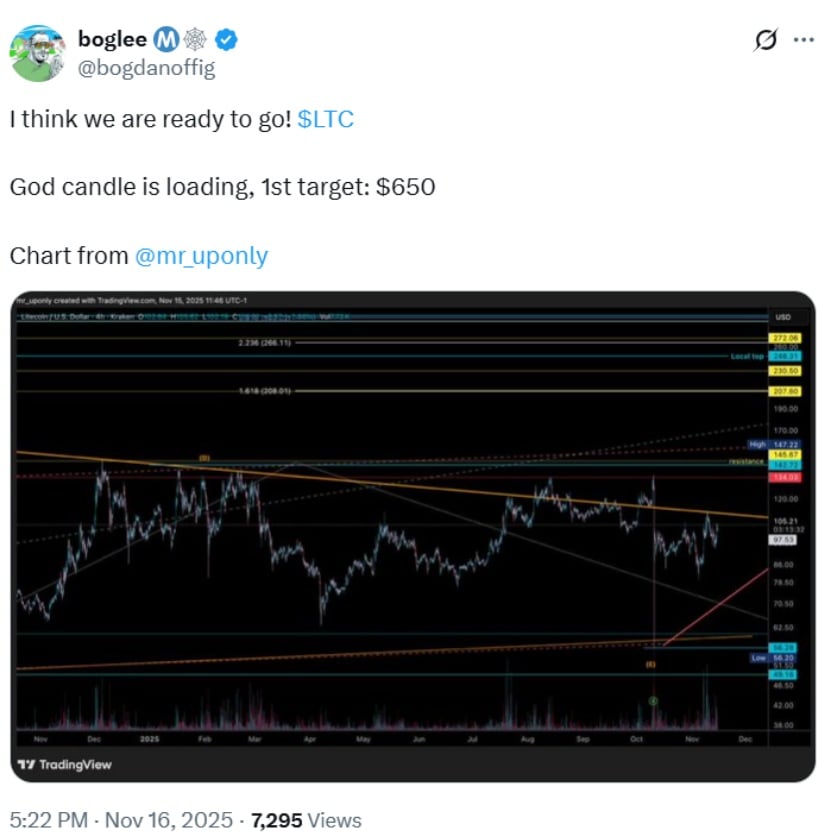
4-Hour Chart Breakout: Analysts highlight a Critical $105 Level
A widely shared 4-hour chart on TradingView-posted by trader @mr_uponly, who is known within the community for his Elliott Wave analysis-shows Litecoin approaching a key resistance level at $105. Elliott Wave traders typically look for breakouts above such structural barriers to confirm impulsive phases, which is why this level is receiving heightened attention. 🎭
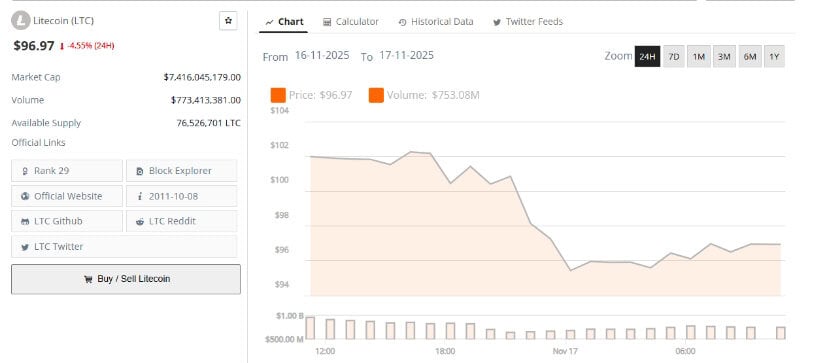
On November 16, promoter @bogdanoffig reposted the chart when LTC was trading near $102. Since then, price has eased to around $96, reflecting Litecoin’s ongoing sensitivity to broader market trends and its historically high correlation with Bitcoin. A review of LTC’s recent candles shows repeated rejections around the $101-$103 range, indicating that sellers continue to defend this zone. 🛡️
Community reactions were mixed. Some traders expressed optimism about an upside continuation if Litecoin can secure a clean close above resistance. Others warned about the possibility of short-term weakness, noting how LTC often sees 20-30% retracements even during broader uptrends. These contrasting views reflect Litecoin’s long-standing volatility, which frequently mirrors Bitcoin cycle rotations where gains can compound quickly-but corrections can follow just as sharply. 🔄💥
This 4-hour structure remains central to ongoing Litecoin price analysis and is frequently referenced in short-term LTC price prediction models. 📊
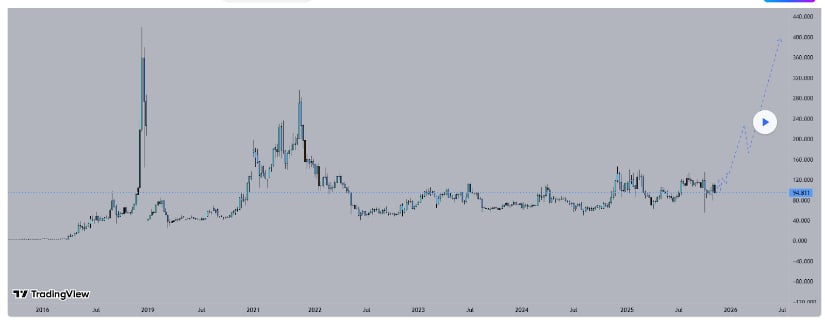
Market Structure: Three Years of Accumulation Raise Breakout Expectations
A weekly chart reviewed by multiple analysts highlights almost three years of accumulation within a defined range between $90 and $120. Recent weekly candles show persistent buying interest near the lower boundary, with long wicks forming repeatedly around the $90-$95 area-an early sign that buyers are consistently defending the zone. 🛠️
Historical precedents add weight to this pattern. In the 2017 and 2021 cycles, Litecoin broke from multi-year trading ranges before accelerating into 5x-10x rallies. While history does not guarantee future outcomes, these past behaviors contribute to analysts’ interest in the current structure. 🕰️
As of November 17, LTC trades just below resistance at approximately $98, maintaining its position within a broader bullish framework. Forecasts from sources such as Changelly-a commonly referenced aggregator that compiles market data and prediction models-suggest a potential move into the $100-$125 range by month-end. These projections are partly based on an emerging inverse head-and-shoulders formation-a pattern that often signals trend reversals. However, it traditionally requires confirmation through a breakout supported by stronger volume, which Litecoin has not yet demonstrated on the daily chart. 🤷♂️
Daily Chart: BTC Influence Drives LTC’s Short-Term Direction
Litecoin’s daily close on November 16 reflected mild bearish pressure around $99.94, followed by a slide toward $96.50 the next day. A key driver was Bitcoin’s subdued movement near $95,320, reinforcing the strong correlation between the two assets. 💔
The daily chart outlines two crucial levels for short-term traders:
Resistance: $101.50
Support: $91.50
These zones are notable because previous intraday candles show frequent interaction around both levels, suggesting they remain active decision points for market participants. 🎢
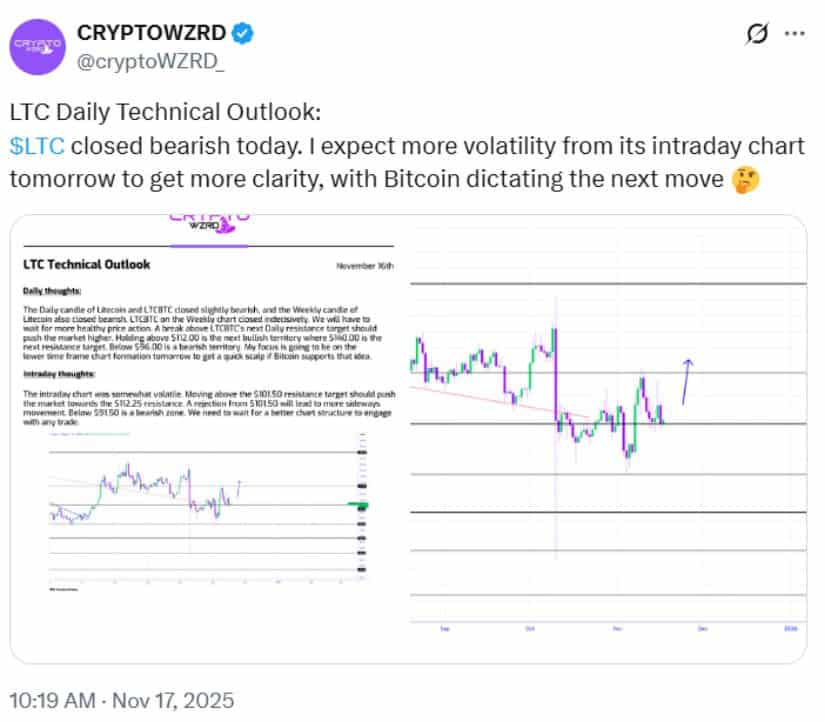
Analysts expecting Litecoin to revisit the $125-$140 region in late November generally emphasize two conditions: Bitcoin must maintain relative stability, and Litecoin must avoid sustained closes below $96. A deeper breakdown would weaken current setups and could invalidate several near-term bullish Litecoin price prediction models. 🚧
For those tracking Litecoin price prediction today, monitoring how LTC behaves between these support and resistance brackets may offer early clues about directional bias. 🔍
Analyst Targets: Could Litecoin Eventually Reach $650?
Several independent analysts have offered varying long-term views on Litecoin’s potential.Market analyst Knight, who frequently publishes cycle-based models, suggested that LTC might retest the $400 area under highly favorable market conditions. If achieved, this would surpass Litecoin’s prior all-time high of $386.45 from 2021. 🚀
Flowstate Trading presented a more conservative projection, identifying $140 as a potential target if broader crypto sentiment strengthens. This aligns with several established Litecoin projections that emphasize gradual, rather than exponential, growth. 🌱
The more aggressive $650 target-popularized on social media-should be treated as a speculative long-tail scenario. Achieving such a level would require multiple confirmations, including:
A decisive multi-week breakout above long-standing resistance
A strong Bitcoin cycle with sustained liquidity inflows
Increased market rotation into legacy altcoins
Elevated volume confirming structural trend changes
Analysts emphasize that Litecoin has not yet met these benchmarks. As a result, high-end targets above $400 remain speculative until LTC can hold several weekly closes above major resistance zones-something it has not done since the 2021 bull run. 🌌
Read More
- Clash Royale Best Boss Bandit Champion decks
- Vampire’s Fall 2 redeem codes and how to use them (June 2025)
- World Eternal Online promo codes and how to use them (September 2025)
- Best Arena 9 Decks in Clast Royale
- Mobile Legends January 2026 Leaks: Upcoming new skins, heroes, events and more
- Country star who vanished from the spotlight 25 years ago resurfaces with viral Jessie James Decker duet
- How to find the Roaming Oak Tree in Heartopia
- M7 Pass Event Guide: All you need to know
- Solo Leveling Season 3 release date and details: “It may continue or it may not. Personally, I really hope that it does.”
- ATHENA: Blood Twins Hero Tier List
2025-11-17 23:23