After a recent dip, the cryptocurrency market is starting to recover, and Bitcoin is trying to regain an important price level. However, some experts caution that the price might fall again to its recent lowest point, meaning the recovery could be temporary.
Bitcoin Bottom Below $60,000, Says Analyst
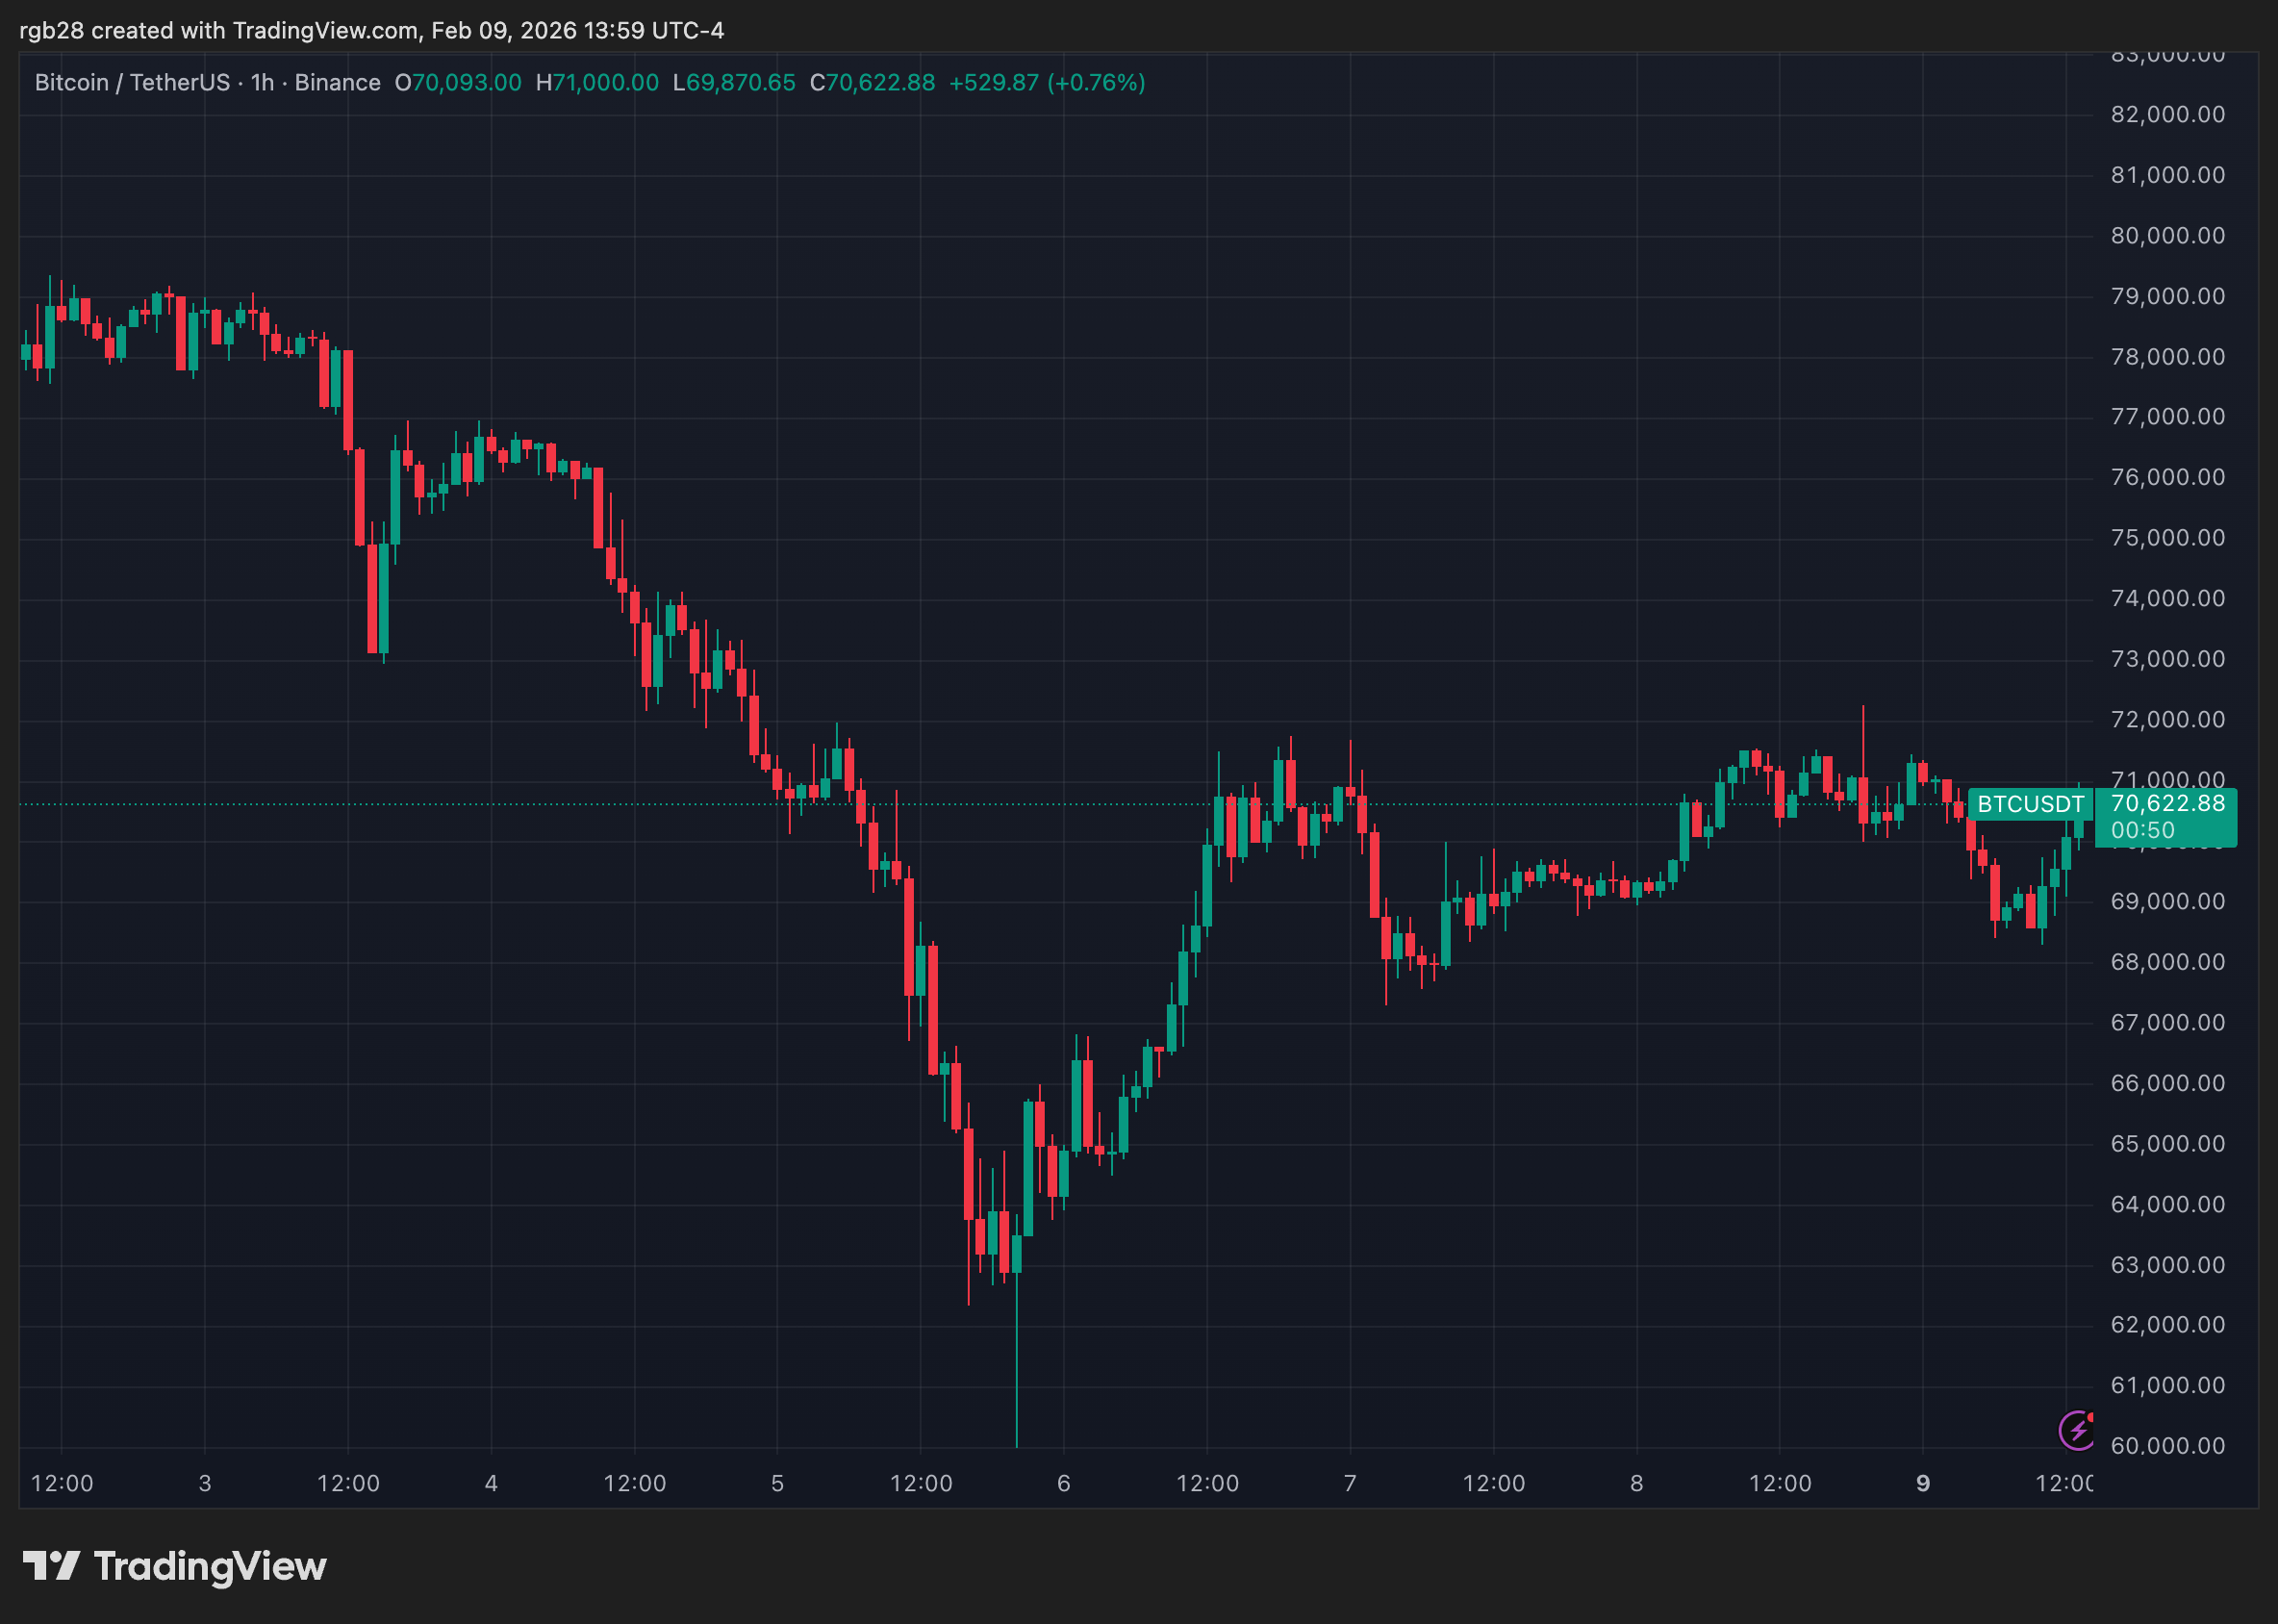
Bitcoin continued to trade within a narrow range on Monday, attempting to establish a crucial price level as support. After falling to a two-year low of $60,000 last week, the price of Bitcoin has recovered about 17.5%, fluctuating between $68,000 and $72,000 in recent days.
Despite recent efforts, the cryptocurrency hasn’t been able to break back above a key price level, leaving investors uncertain about where its price will go next.
After the price went up, Crypto Bullet observed that Bitcoin finished the week strongly, remaining above its 200-week Exponential Moving Average (EMA). This made the price drop seen on Thursday appear relatively small on the weekly chart.
The analyst warned that these temporary price drops have typically been followed by a recovery the next week, as seen in the price corrections during late February and early October of 2025, which were then followed by positive performance.
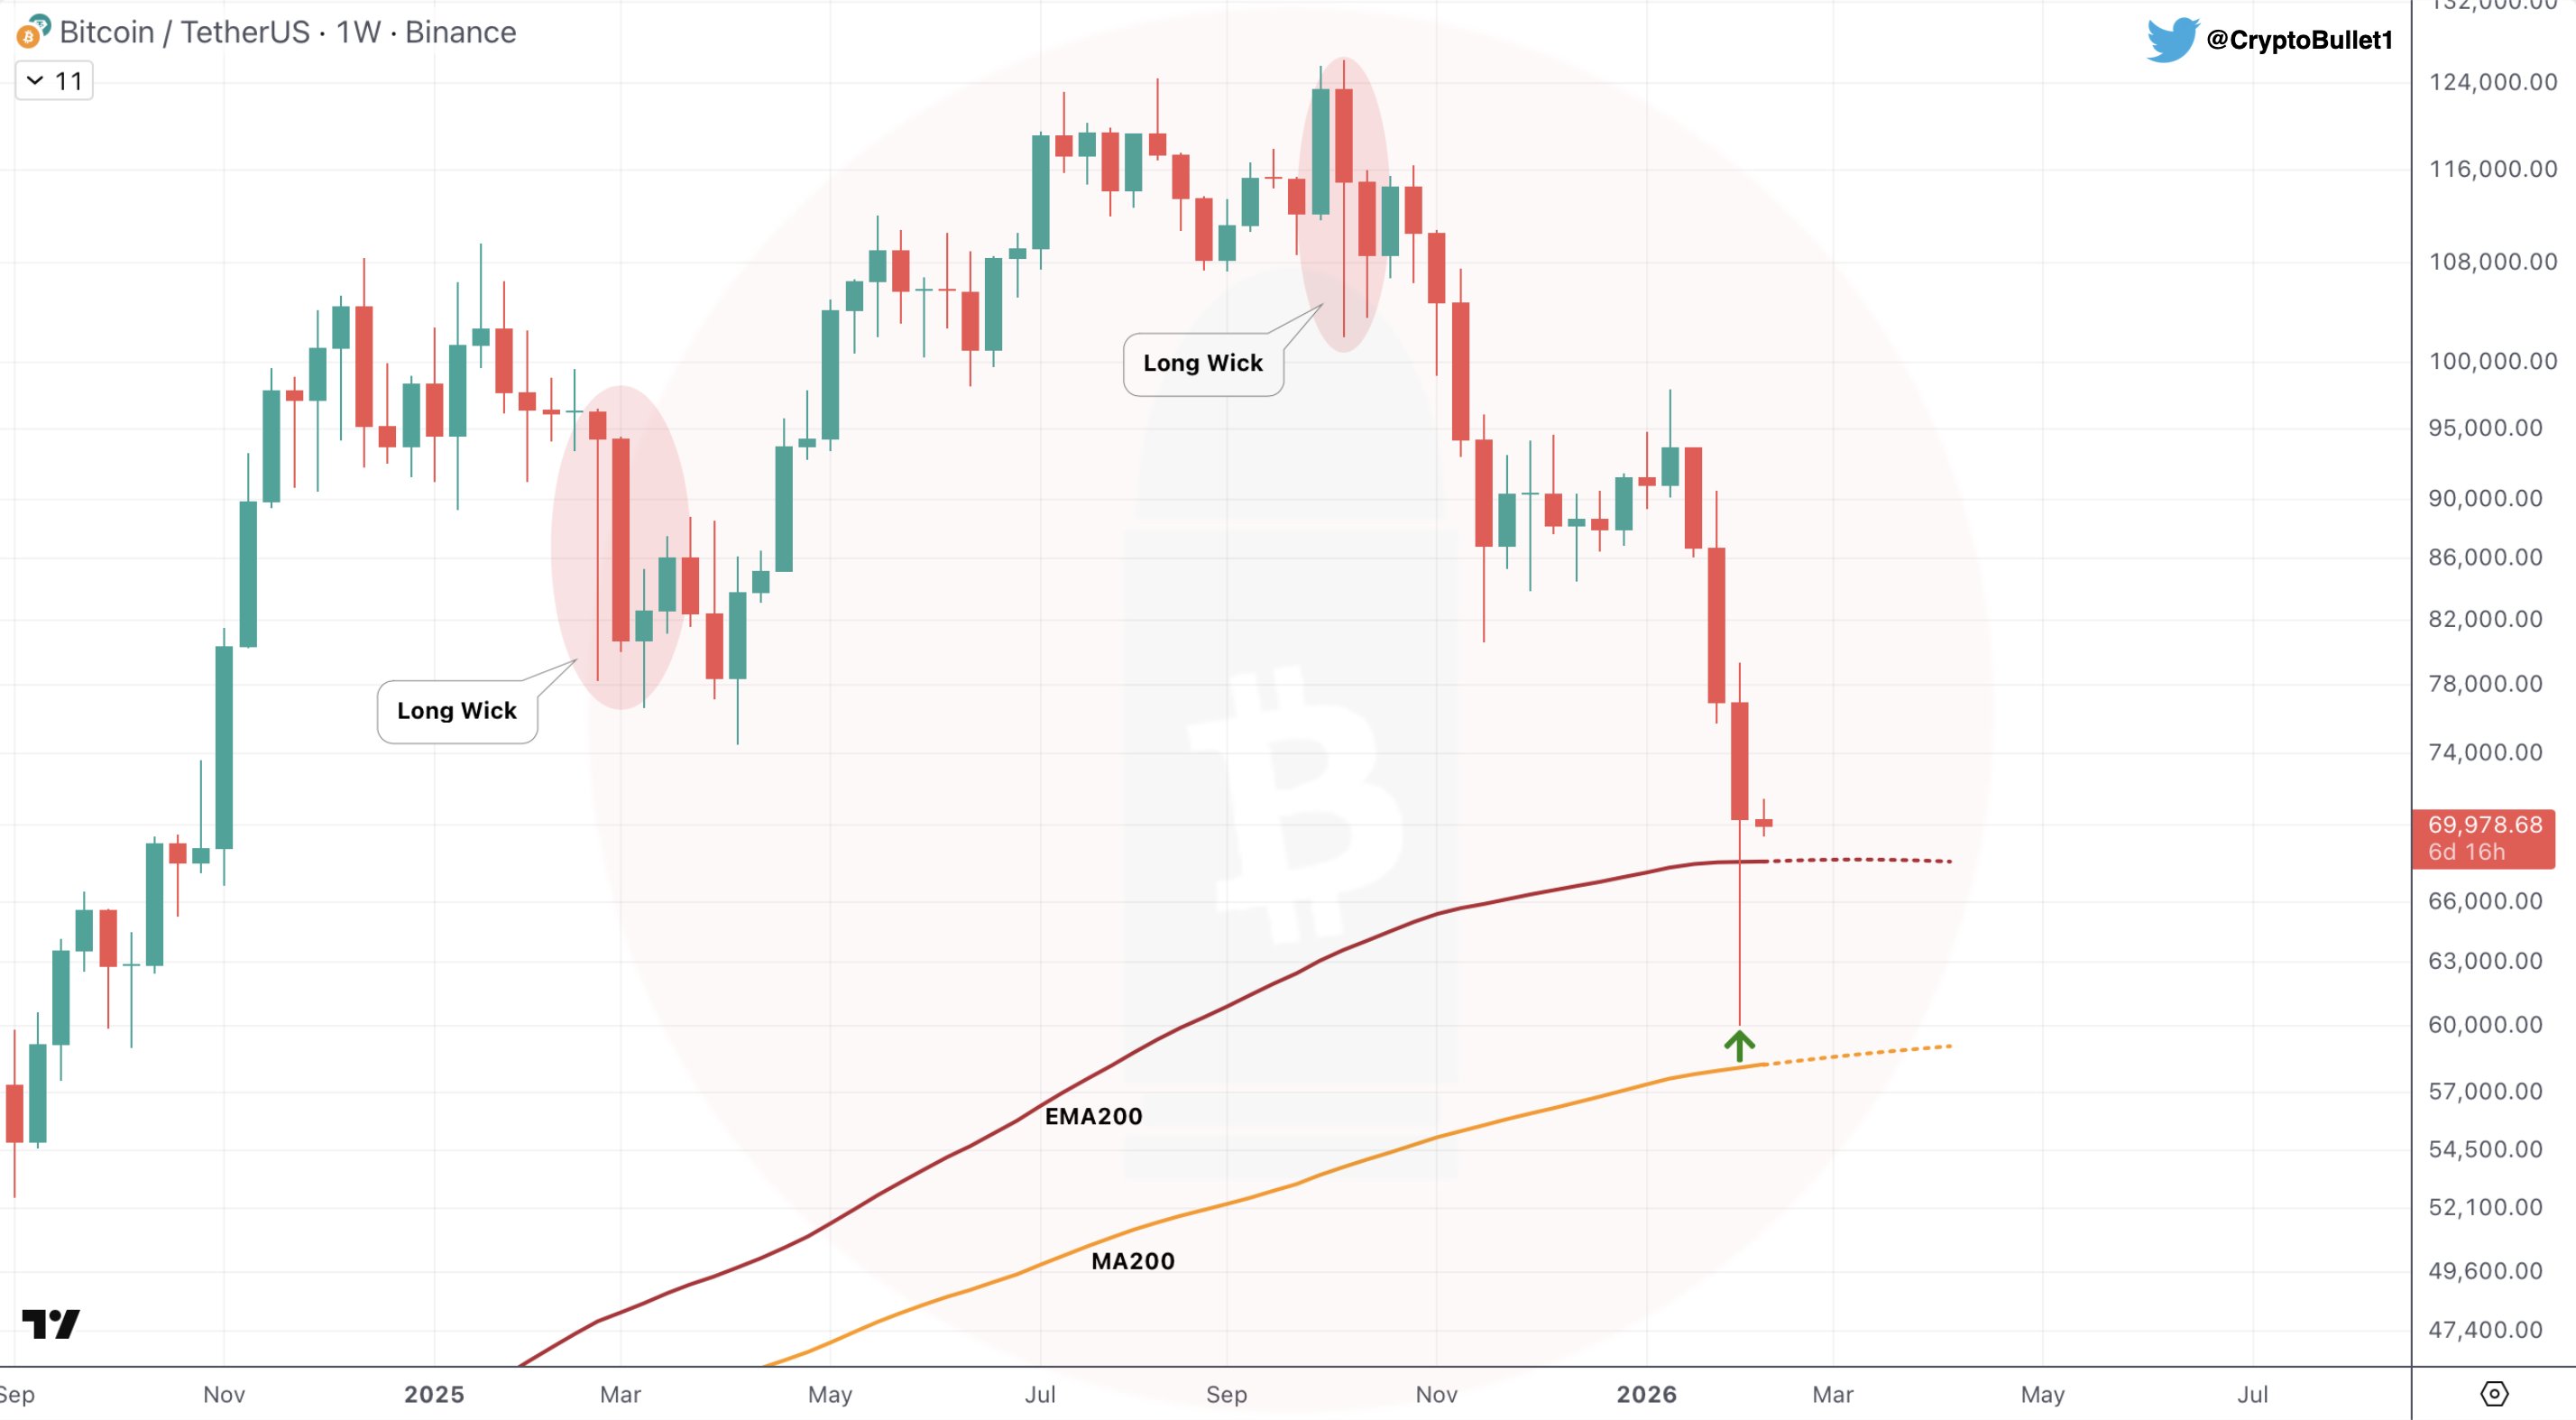
According to his analysis, Bitcoin might try to reach $60,000 again, a level that coincides with its 200-week moving average. Meanwhile, Ted Pillows pointed out Bitcoin’s rise above $70,000 on Monday, emphasizing the importance of holding the $68,000 support level, where the EMA200 is located.
If the price drops below this level, analysts predict a further decline in the market. Bitcoin could even fall below its recent lowest point if that level doesn’t hold either.
Ali Martinez suggests Bitcoin might not have reached its lowest point yet. He points out that historically, Bitcoin has bottomed out when its MVRV Pricing Band reaches -1.0, which currently corresponds to a price of $52,040.
BTC To See Leeser Relief Rally?
A financial analyst pointed out that Bitcoin has been forming a downward-sloping triangle pattern on monthly charts since mid-2024. This suggests any price increase we see now might be smaller and less sustained than the significant gains Bitcoin experienced between 2024 and 2025.
According to Rekt Capital, when Bitcoin drops below major long-term trendlines, it often finds support around the 50-month Exponential Moving Average. However, historically, this support hasn’t always held, and Bitcoin has sometimes briefly dipped below that level before recovering.
As a researcher analyzing Bitcoin’s price movements, I’ve observed a recurring pattern using what I call the Macro Descending Triangle. Historically, after Bitcoin breaks down from this pattern, it rarely returns to test the previous support level. Based on this, I believe any potential price increase we see in the near future will likely fall short of reaching $82.5k.
As a researcher, I’m watching Bitcoin closely. If the price can hold above the $71,000 level – which is where we saw a breakout after the recent halving event – I think we could see another push upwards, potentially reaching the mid-$70,000s.
Despite recent activity, Bitcoin is still trying to establish a stable price range after the halving event. It hasn’t firmly broken through a key resistance level to confirm a bullish trend and is actually starting to show signs that this level could now act as a barrier to further price increases, especially when looking at weekly price charts.
If Bitcoin struggles to break past $70,000, it might settle back into its recent trading range. According to Rekt Capital, with roughly a third of the current market cycle complete, there’s still time for price changes, but past patterns suggest any period of stability will likely be followed by further price declines.
Read More
- Invincible Season 4 Episode 4 Release Date, Time, Where to Watch
- Physics Proved by AI: A New Era for Automated Reasoning
- “Wild, brilliant, emotional”: 10 best dynasty drama series to watch on BBC, ITV, Netflix and more
- American Idol vet Caleb Flynn in solitary confinement after being charged for allegedly murdering wife
- Gold Rate Forecast
- Magicmon: World redeem codes and how to use them (March 2026)
- Total Football free codes and how to redeem them (March 2026)
- Seeing in the Dark: Event Cameras Guide Robots Through Low-Light Spaces
- eFootball 2026 is bringing the v5.3.1 update: What to expect and what’s coming
- Simulating Humans to Build Better Robots
2026-02-10 14:43