The asset has defied gravity, holding firm above key support levels despite recent setbacks. Is this a sign of stability? Well, it’s all a matter of perspective. Institutional partnerships and a growing transaction base continue to fan the flames of sentiment. As the market stumbles around in search of a clear direction, Hedera’s current setup screams cautious optimism—an oxymoron if ever there was one—backed by strong fundamentals and network adoption. If only it were so simple…
Market Structure and Analyst Insight
Between June 10 and June 13, the HBAR/USDT 1-hour chart from Open Interest painted a picture that could have been lifted straight from a tragedy. A clear bearish structure was in play as the price tumbled from above $0.180 to a local low near $0.145, a fall that echoed like a ship sinking in the market’s turbulent seas.
This rapid descent coincided with a drop in open interest from over 3.75 million to 3.2 million, signaling that leveraged positions were mercilessly liquidated. The aftermath? A price consolidation between $0.145 and $0.155, as buyers hesitated like nervous lovers on the verge of a breakup.
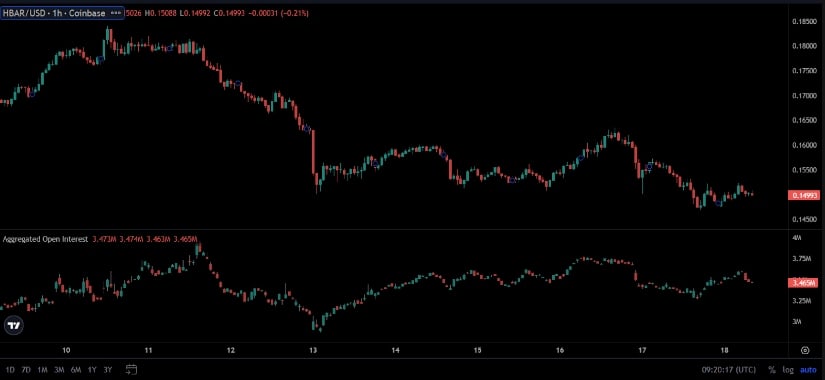
Open interest has since shown a modest recovery to 3.46 million, but still remains well below previous peaks. It’s a game of waiting—like a chess player watching the opponent’s every move before making the final gambit. No one’s diving back in until there’s clear confirmation of a breakout.
Analyst Mark Chadwick (@markchadwickx) reignited some hope, sharing a data-driven commentary via X. He boldly claimed that a return to $1 per token would imply a market cap near $40 billion—a figure that makes one wonder if he’s seen the future or if this is just wild speculation. But hey, dreamers gotta dream, right?
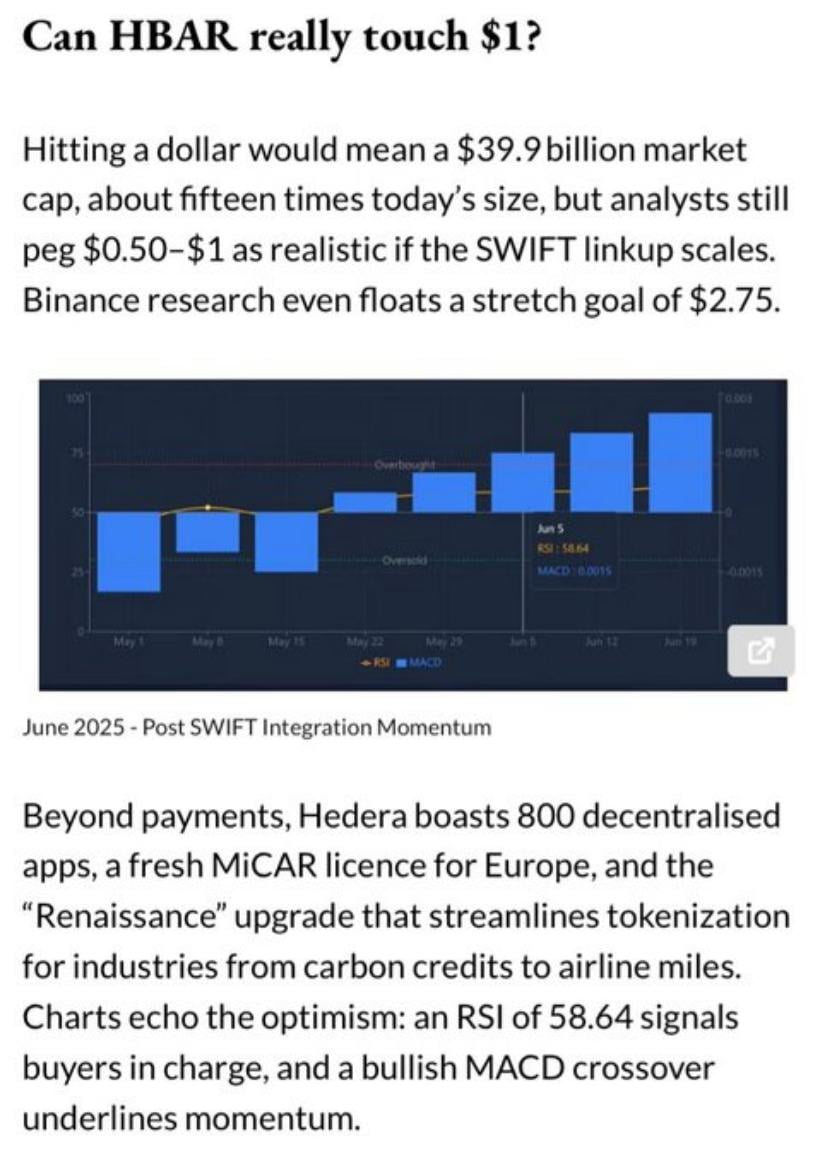
While this vision of grandeur hinges on extraordinary growth, analysts can’t ignore the SWIFT integration—announced back in February 2025—which could very well be the catalyst for this audacious surge. Let’s see if the market responds to the rhythm of this well-choreographed waltz.
Hedera Price Prediction: Transaction Strength and Ecosystem Expansion
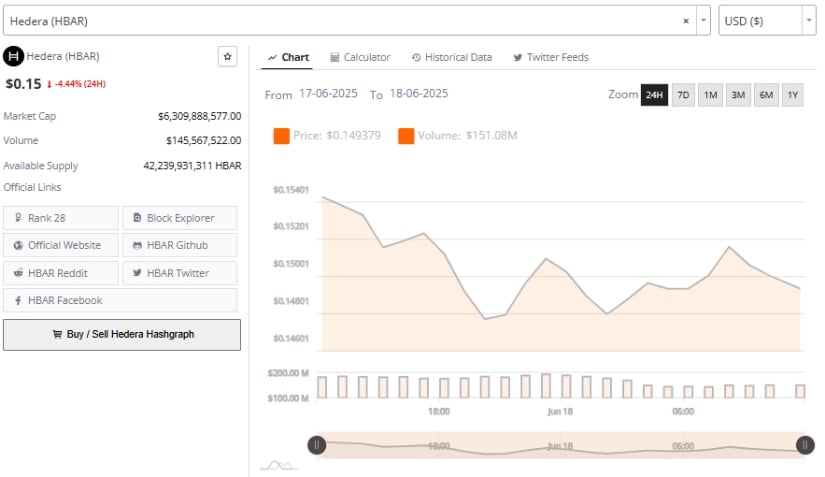
According to Brave New Coin, Hedera is churning through transactions like an unstoppable force, exceeding 2.5 million daily. With a technical capability to process over 10,000 transactions per second—without turning into a steaming pile of inefficiency—this is a network worth keeping an eye on. At the time of writing, HBAR is priced at $0.15, down 4.44% over the past 24 hours, with a market cap of around $6.3 billion. Despite the daily trading volume exceeding $145 million, it still feels like we’re in the midst of a quiet storm. 🌪️
The governance model is another feather in Hedera’s cap. Backed by tech titans like Google, IBM, Deutsche Telekom, and LG, Hedera combines the best of both worlds: decentralization with a pinch of enterprise-grade stability. The Hedera Consensus Service (HCS) is gaining traction, particularly in advertising integrity, digital identity, and logistics—three areas where no one can afford to be behind the curve.
Speculation swirls about potential Nasdaq listings and corporate partnerships, including one with Boeing. These juicy tidbits keep investors on edge, wondering if this will be the breakthrough that finally pushes Hedera into the stratosphere. But, as always, the truth lies somewhere between the speculation and the reality.
Weekly Chart Technical Analysis
The weekly chart of HBAR/USDT on TradingView reveals the kind of volatility that would make even the most seasoned traders nervous. After reaching a peak of $0.49, HBAR plummeted into a prolonged downtrend, finding support around $0.035. Fast forward to early 2025, and a strong rally lifted the price to $0.30, only for it to face resistance like a boxer against the ropes. Recently, the price has retraced to around $0.148, just above a visible support zone near $0.14.
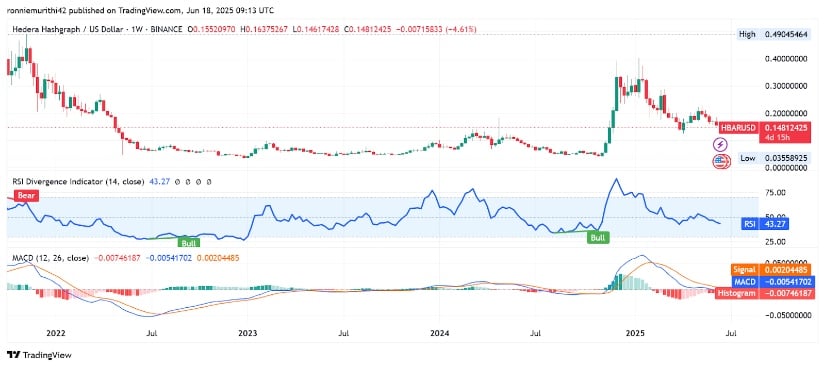
The Relative Strength Index (RSI) currently sits at 43.40—far from oversold but nowhere near the euphoric highs of earlier in 2025. Historically, RSI values above 40 have indicated potential reversal zones, which might mean that there’s still hope for a rally. However, let’s not get ahead of ourselves.
The Moving Average Convergence Divergence (MACD) is flashing some warning signs, reflecting a minor bearish crossover, with the MACD line at -0.0053 and the signal line at 0.0020. The histogram has turned slightly negative, hinting at weakening bullish momentum. But let’s not panic just yet—the crossover is still shallow, and this could be reminiscent of the conditions before the 2023 surge. If price holds above support and RSI stays steady, a breakout could very well be in the cards.
Read More
- Clash Royale Best Boss Bandit Champion decks
- Brawl Stars December 2025 Brawl Talk: Two New Brawlers, Buffie, Vault, New Skins, Game Modes, and more
- Best Hero Card Decks in Clash Royale
- Clash Royale December 2025: Events, Challenges, Tournaments, and Rewards
- Call of Duty Mobile: DMZ Recon Guide: Overview, How to Play, Progression, and more
- Best Arena 9 Decks in Clast Royale
- Clash Royale Witch Evolution best decks guide
- Clash Royale Best Arena 14 Decks
- Brawl Stars December 2025 Brawl Talk: Two New Brawlers, Buffie, Vault, New Skins, Game Modes, and more
- Deneme Bonusu Veren Siteler – En Gvenilir Bahis Siteleri 2025.4338
2025-06-18 23:22