Ah, Ethereum. The cryptocurrency that’s like that friend who always hovers around the bar, waiting for the right moment to make a grand entrance. According to the latest on-chain gossip, it seems Ethereum is on the brink of a bullish breakout, thanks to some rather hefty whale activity. Yes, whales! Not the kind you see at SeaWorld, but the kind that hold more ETH than I hold in my entire life savings. 🐳
As of this fine Monday, Ethereum (ETH) is trading at a modest $2,545. It’s been lounging around this price for a few days now, like a cat in a sunbeam, just 7% shy of its monthly high. You know, just enough to keep us all on the edge of our seats. 😼
Now, if you’re wondering what the big investors are up to, it appears they’re gearing up for a rebound. On-chain data reveals that the supply of ETH held by these whales has been steadily rising. They now clutch a staggering 103.5 million ETH, up from a mere 102 million on March 1. That’s an increase of nearly 1.5%! Talk about a bullish leading indicator! 🐋💪
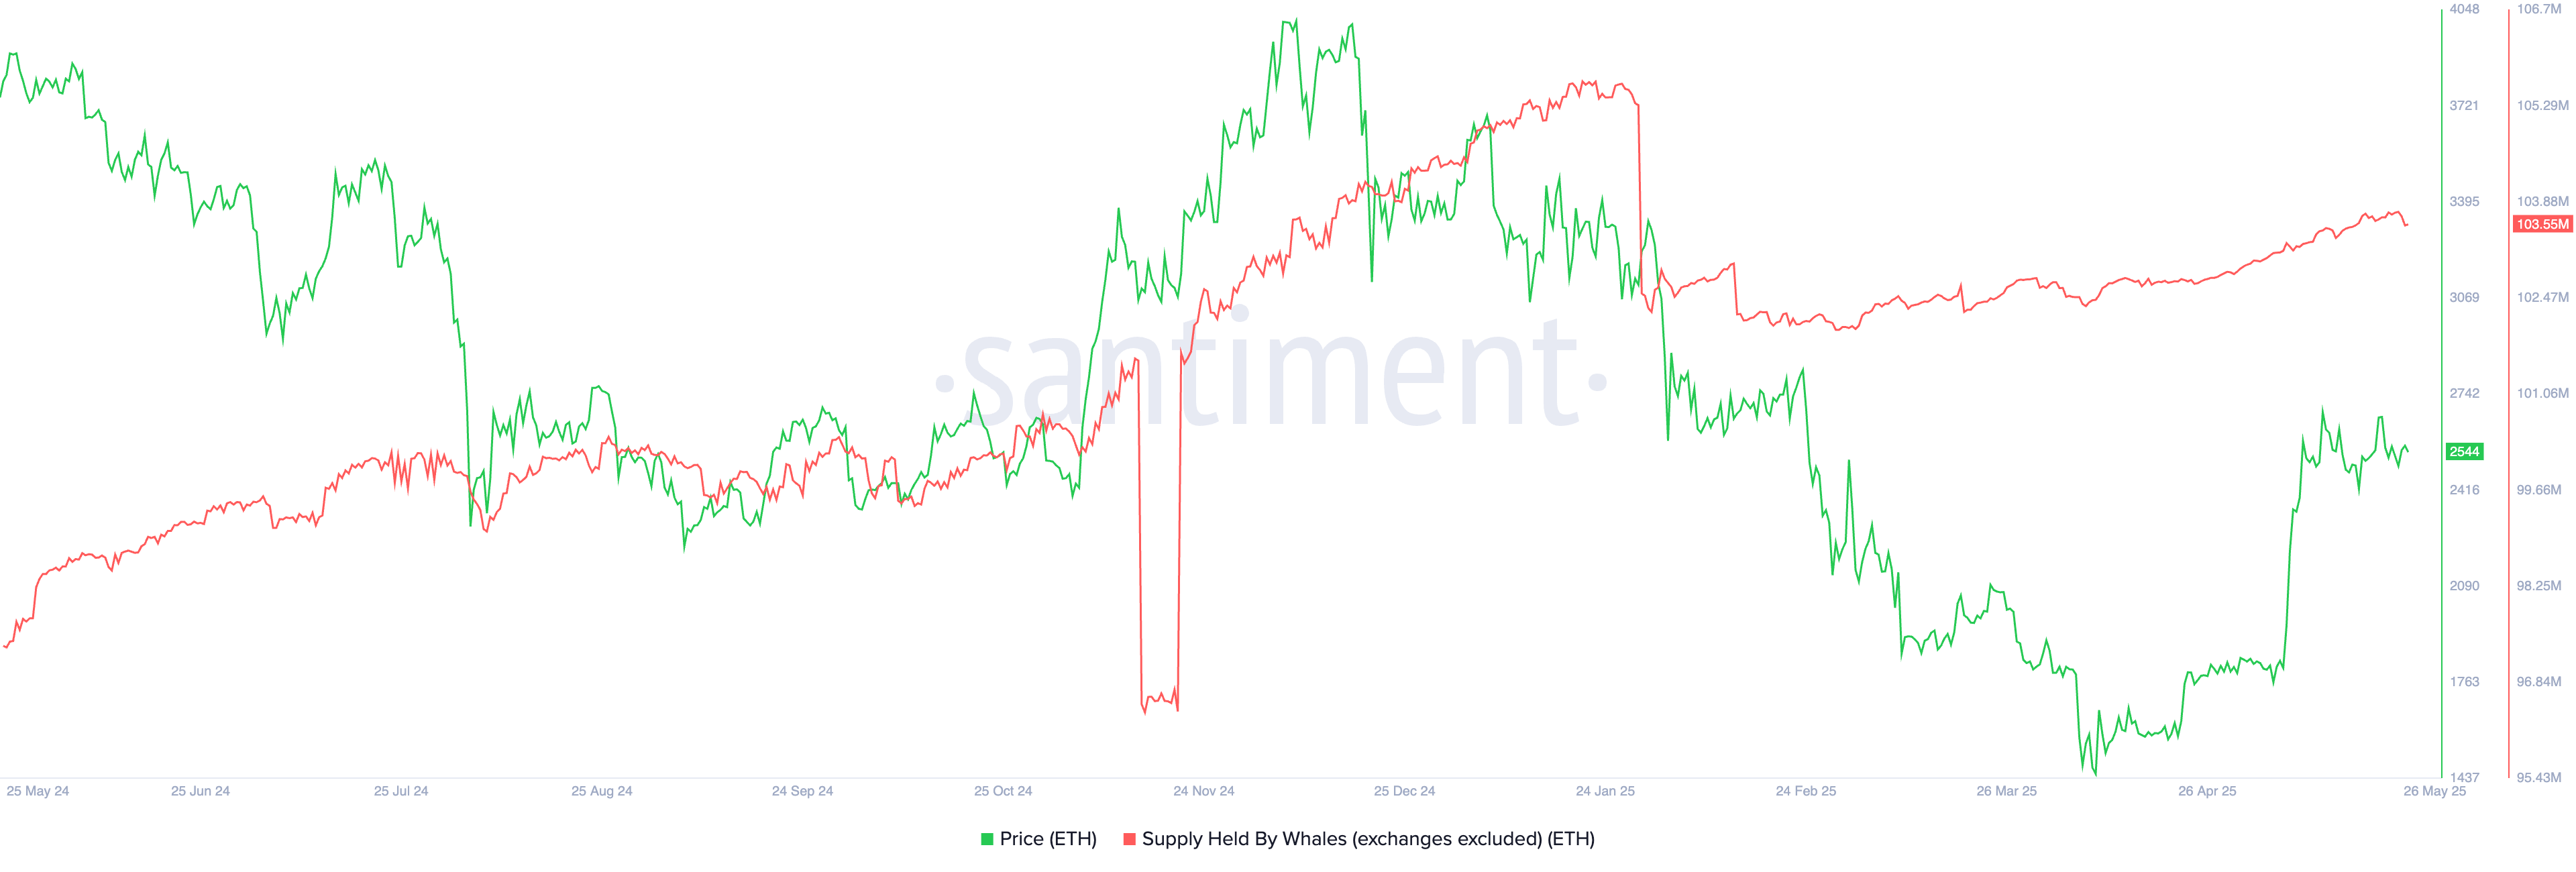
But wait, there’s more! Ethereum’s ecosystem is thriving like a well-watered houseplant. The total value locked (TVL) has jumped by 26% in the last 30 days, reaching over $132 billion. And if you think that’s impressive, the bridged TVL has soared to over $408 billion. I mean, who knew Ethereum was such a high roller? 🎲
In comparison, Solana (SOL) is sitting pretty with a TVL of $22.48 billion, while BSC is barely holding on at $9.3 billion. It’s like watching a race where Ethereum is the thoroughbred and the others are just… well, not. 🐎
And let’s not forget about Ethereum ETFs! They’ve been seeing inflows like a kid in a candy store. SoSoValue data shows that in the last six days alone, they’ve raked in a whopping $2.76 billion. That’s a lot of candy! 🍬
Ethereum Price Technical Analysis 📈
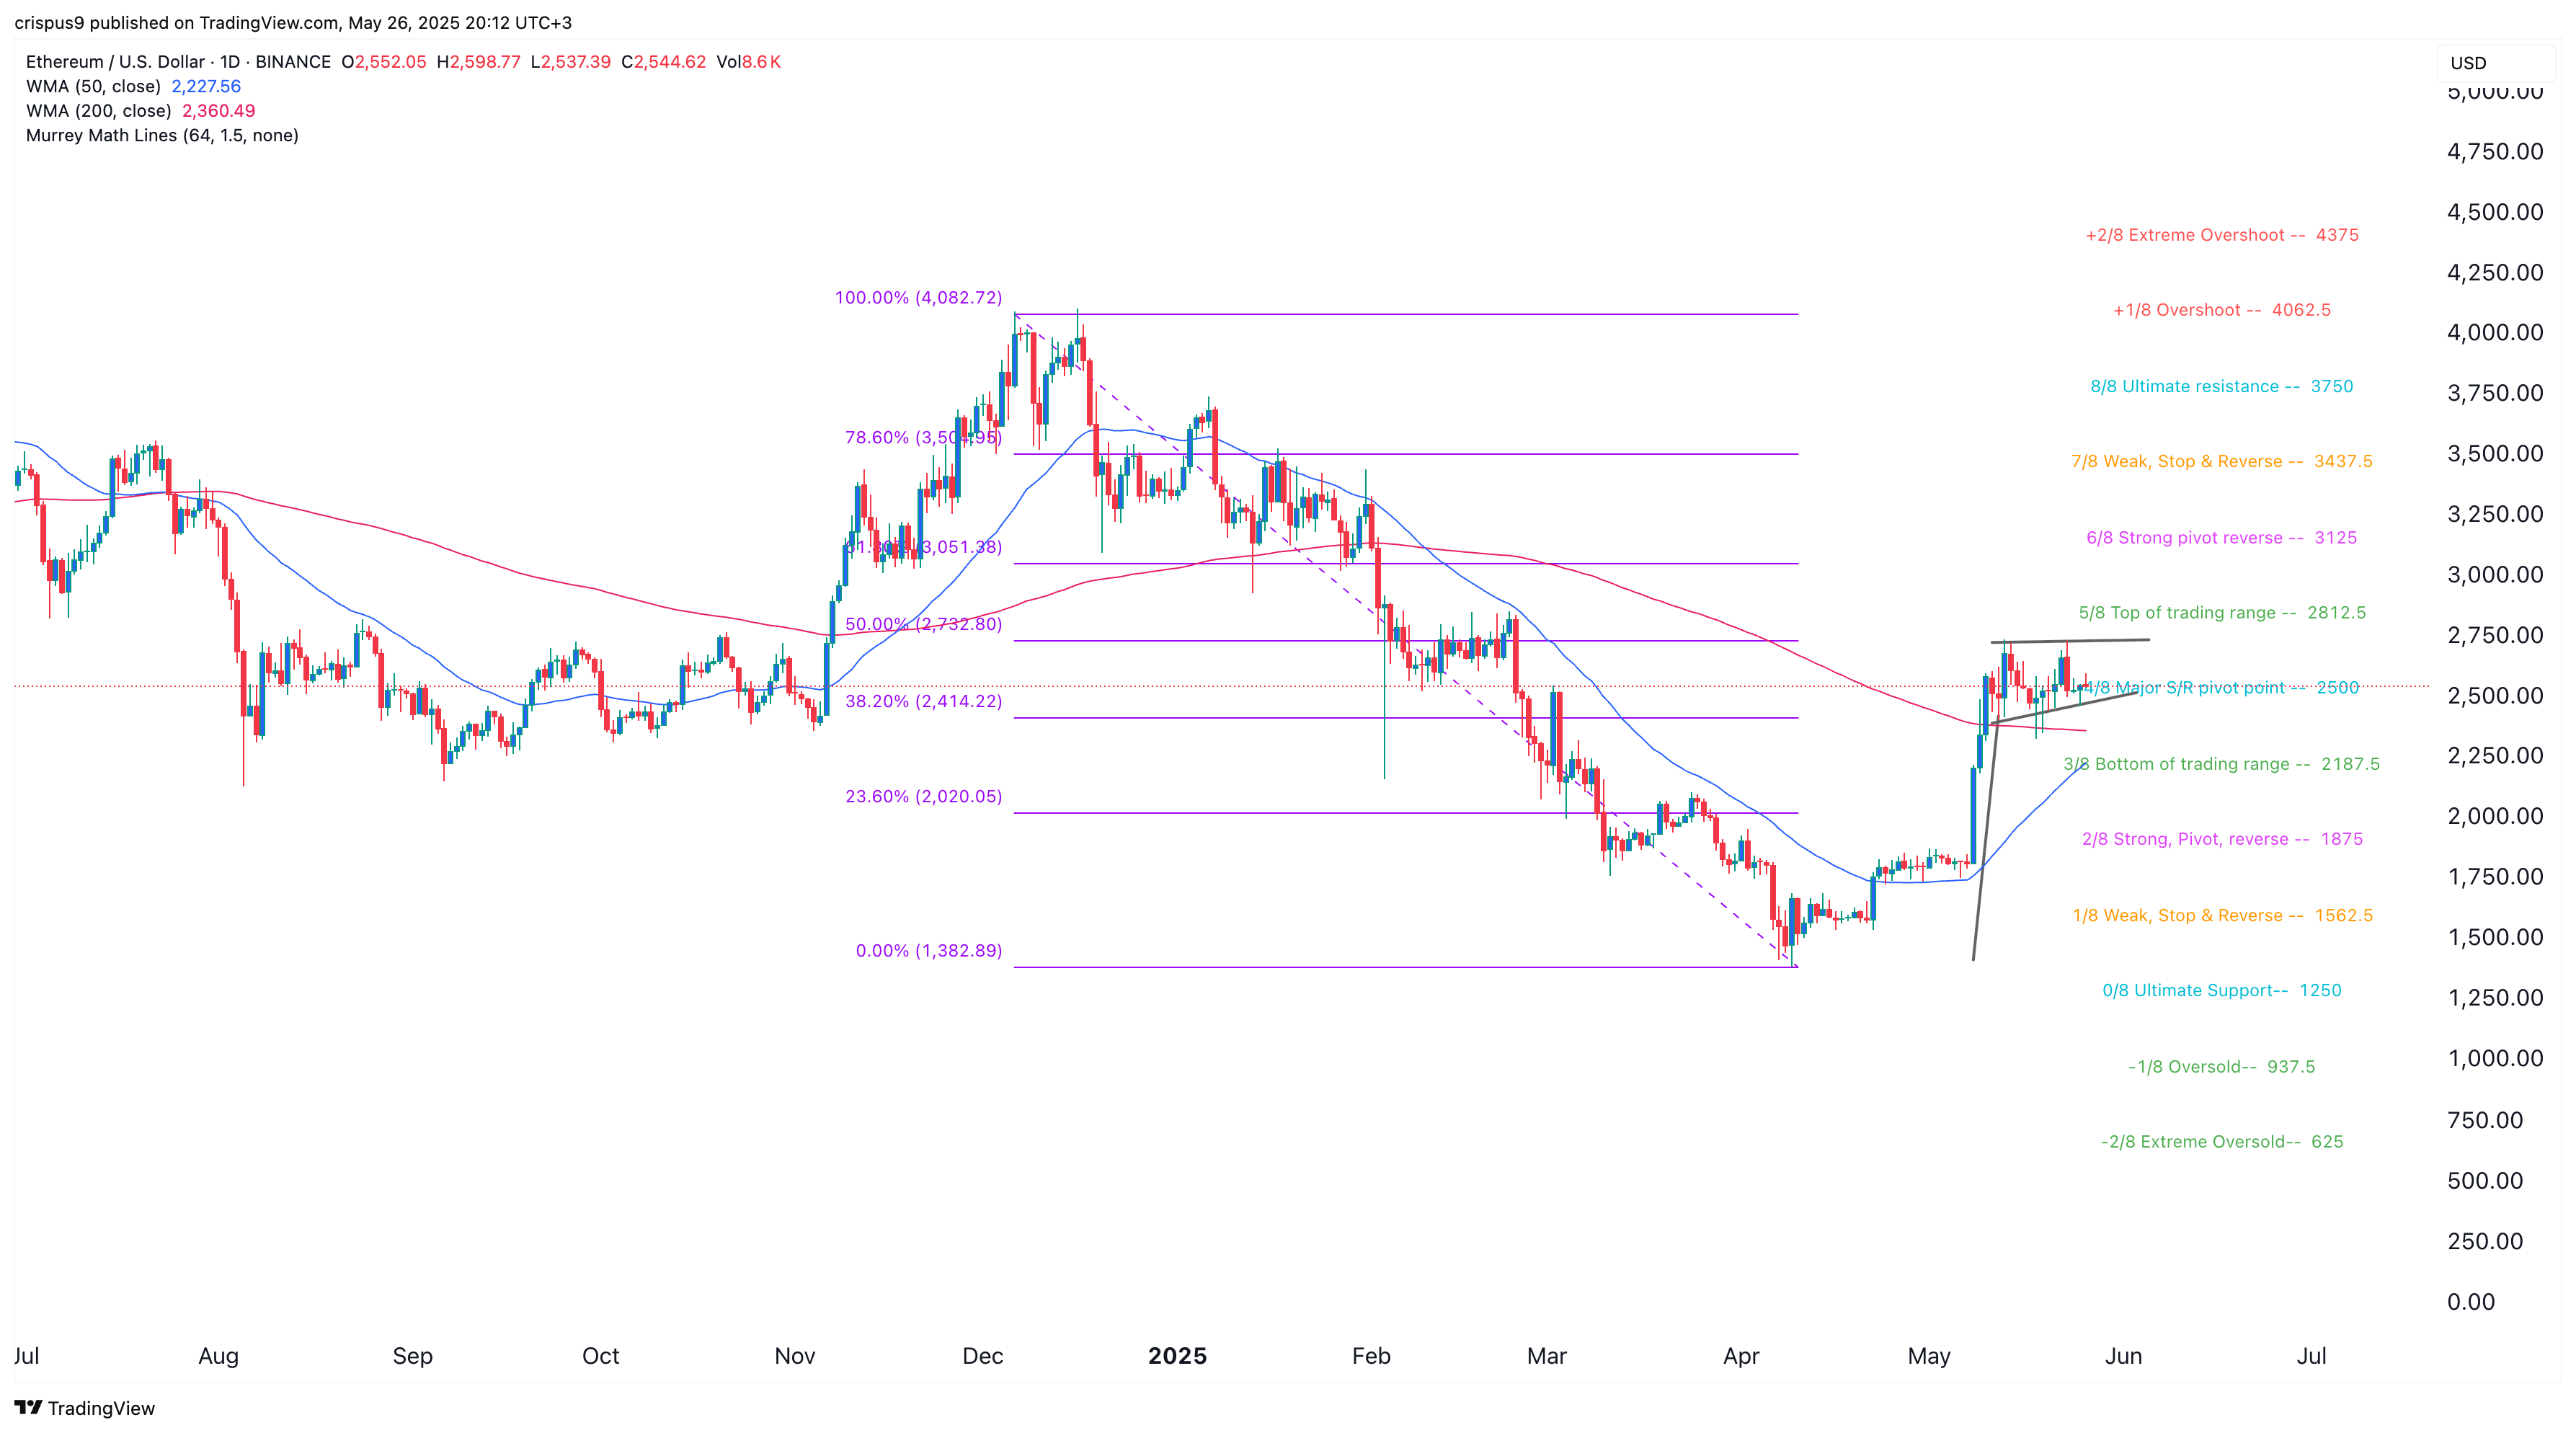
Now, let’s take a peek at the daily chart. Ethereum has rallied from April’s low of $1,382 to its current price of $2,547. It’s formed a bullish flag pattern, which sounds like something you’d see at a parade, but in reality, it’s just a strong vertical rally followed by a period of consolidation. 🎉
Currently, ETH is trading between the 38.2% and 50% Fibonacci retracement levels. A golden cross is on the horizon, which is a bullish signal, as the 50-day and 200-day Weighted Moving Averages are about to have a crossover. It’s like watching two old friends finally meet after years apart. 🤝
Additionally, ETH is holding just above the key support/resistance pivot level of the Murrey Math Lines tool. If Ethereum breaks above the 50% Fibonacci retracement level at $2,730, we might just witness a bullish breakout. And if that happens, the next major target would be the psychological resistance at $3,000—an 18% gain from current levels. Who’s ready to party? 🎊
Read More
- Clash Royale Best Boss Bandit Champion decks
- Vampire’s Fall 2 redeem codes and how to use them (June 2025)
- Mobile Legends January 2026 Leaks: Upcoming new skins, heroes, events and more
- How to find the Roaming Oak Tree in Heartopia
- World Eternal Online promo codes and how to use them (September 2025)
- Best Arena 9 Decks in Clast Royale
- Clash Royale Season 79 “Fire and Ice” January 2026 Update and Balance Changes
- Clash Royale Furnace Evolution best decks guide
- Clash Royale Witch Evolution best decks guide
- Best Hero Card Decks in Clash Royale
2025-05-26 20:44