My dear reader, it is observed that market participation has increased around key support levels, suggesting that traders are reassessing risk after several volatile sessions. 🤔
Though Ethereum continues to face macro and liquidity pressures-including ETF outflows and broader risk-off sentiment-its current structure shows early signs of stabilization. A sustained move above trendline resistance would be an important confirmation that buyers are regaining control. 💸
Market Overview
Ethereum is attempting to stabilize after another sharp intraday swing that briefly pushed the price below the key $3,000 psychological threshold. The move came amid continued ETF outflows and investor caution driven by shifting U.S. rate expectations and broader macro uncertainty. 📉
Data from SoSoValue, a widely followed digital-asset ETF analytics platform, shows consistent withdrawals across U.S. Ethereum ETFs throughout mid-November. Despite these headwinds, ETH has begun forming a short-term base near $2,950-$3,050, providing the initial structure for a potential recovery. At the time of writing, ETH is trading near $3,020. 🧠
Recent on-chain activity also confirms a reset in short-term speculative pressure. Funding rates and open interest both eased following the decline, creating conditions where a recovery becomes technically viable if momentum improves. 📈
ETF Outflows Continue to Pressure Market Sentiment
According to flow data from SoSoValue, shared by institutional-flow analyst Ted Pillows, U.S. spot Ethereum ETF products saw $74.2M in net outflows on November 18, marking the sixth consecutive day of withdrawals. BlackRock’s Ethereum Trust had the largest decline with over $165M in outflows, while Bitwise (+$19.1M) and VanEck (+$4.6M) recorded modest inflows that were insufficient to offset the broader trend. 💸
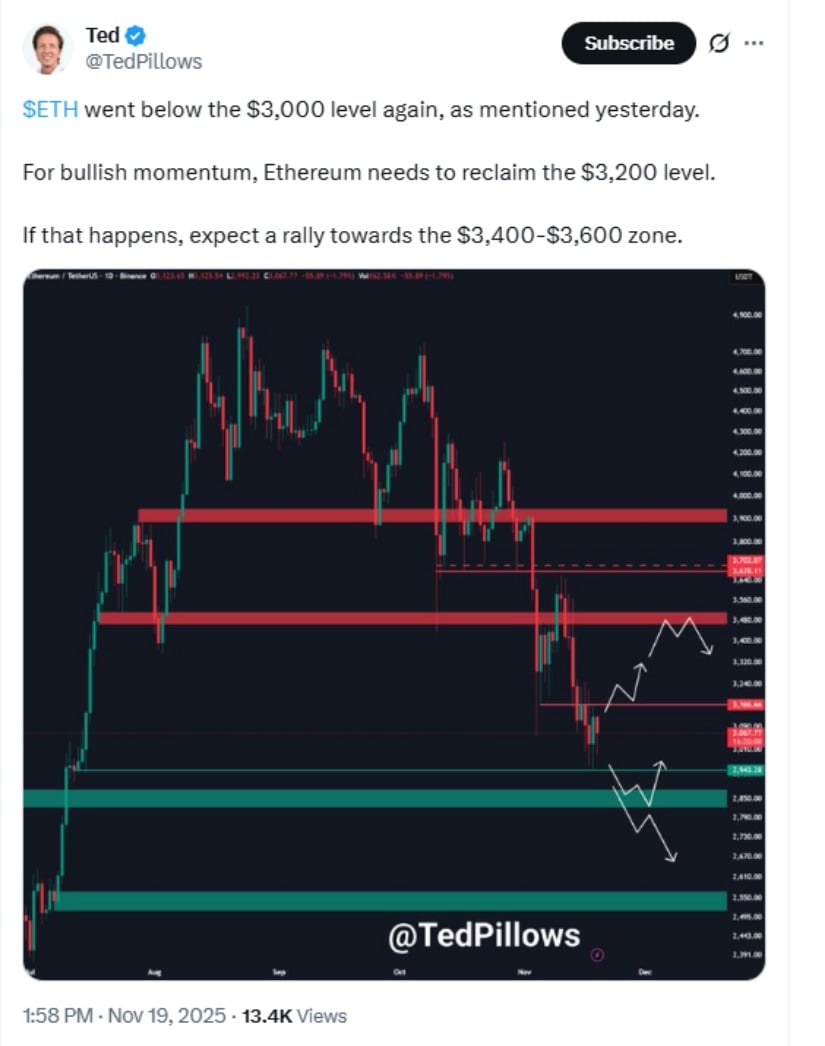
Pillows-known for tracking institutional crypto exposure-described the current behavior as an example of “uneven institutional allocation,” noting that Ethereum continues to lag behind Bitcoin as rate expectations, dollar strength, and equity-market volatility shape risk appetite. 🤷♀️
These outflows highlight a key risk factor: even if technical indicators improve, sustained ETF weakness could limit the strength of any rebound. 🚫
Technical Landscape: Trendline Break Could Shift Short-Term Momentum
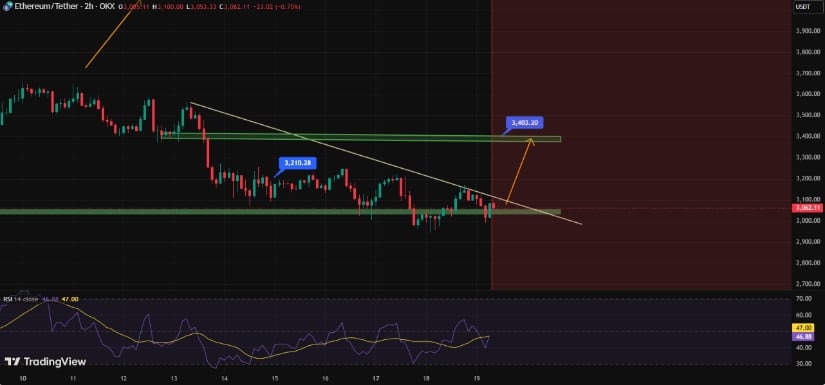
Ethereum’s latest pullback aligned closely with Bitcoin’s retracement from local highs. ETH lost momentum after failing to reclaim $3,150, a trendline level that has rejected price multiple times over the past week-signaling a temporary seller stronghold. 📉
The drop extended below $3,050, with ETH forming a local low at $2,941 before stabilizing. 🔄
Market data from Kraken shows ETH remains below its 100-hour Simple Moving Average, reinforcing near-term bearish pressure. For context, ETH has not closed above this moving average for several sessions, indicating that short-term momentum still favors sellers until a decisive break occurs. 📈
Market strategist Aayush Jindal, known for his technical research across major crypto assets, noted that a clear move above $3,250 could “open the path toward the $3,320 resistance.” He further added that reclaiming $3,320 would be structurally important for a potential move toward the $3,450-$3,500 region. 🧠
Building on this, Pillows emphasized that a recovery above $3,200-the midpoint of recent range compression-remains the critical signal for bullish confirmation, but this setup remains heavily dependent on volume and continued defense of support zones. 📊
Volume Profile Insights: Why the $2,950-$3,050 Area Matters
A Binance volume profile chart, shared in recent trader commentary, highlighted a dense cluster of volume between $2,950 and $3,050. This matters because high-volume areas typically represent regions where buyers and sellers previously found consensus, often acting as support during pullbacks. 🛡️

From my analysis, ETH’s repeated reactions within this zone suggest that many traders consider this a fair-value area, making it more likely for the market to stabilize here unless broader risk sentiment deteriorates. 🧠
However, support alone is not enough-ETH must reclaim the descending trendline to shift momentum. Without that breakout, this zone risks becoming a consolidation area rather than a springboard for recovery. 🔄
Key Resistance and Support Levels With Interpretation
Resistance Zones
$3,150-$3,200: Major trendline and short-term seller zone; ETH has rejected this area multiple times. 🚫
$3,250: First breakout confirmation; clearing this strengthens the bullish structure. 📈
$3,320: Next upside target; historically acts as a momentum checkpoint. 🧠
$3,450-$3,500: Broader bullish target but requires strong market participation. 💸
Support Zones
$3,065: Nearest intraday support. 🛡️
$3,020: Early bearish trigger; losing this resurfaces downside risk. 📉
$2,950: Key pivot where previous volume concentration sits. 🧠
$2,880: Next structural support. 🛡️
$2,750-$2,740: Deeper correction zone if broader markets turn risk-off. 🙃
From a structural standpoint, ETH must defend $3,020 to avoid retesting the $2,950 pivot. A breakout above $3,150-$3,200 would signal a shift toward short-term bullish momentum; however, this scenario remains contingent upon market conditions and ETF flows. 📈
Market Sentiment and Outlook
Overall sentiment remains mixed. More than $70M in liquidations earlier this week emphasize how sensitive the market is to sudden price swings. 📉
On the fundamentals side, recent ecosystem developments-such as Vitalik Buterin’s proposal for a new privacy-preserving framework-continue to generate discussion about Ethereum’s long-term direction. While not immediately price-moving, such updates contribute to long-term investor confidence. 🧠

Looking ahead, traders remain divided as Ethereum sits between strong support and strong resistance. While the technical setup suggests the possibility of a bullish reversal, ETF outflows, macroeconomic pressures, and liquidity conditions remain key variables. 🤔
Final Thoughts
Ethereum remains at an important inflection point as the market watches whether the trendline can finally be broken. Strong volume support near the $3,000 region creates the foundation for a potential rebound, but broader sentiment-shaped by ETF flows and macro trends-continues to influence price stability. 🔄
If ETH successfully reclaims the $3,150-$3,200 zone with convincing volume, upside targets toward $3,320 and $3,450 become technically plausible. However, failure to hold $3,020 could push Ethereum back into a deeper retest of the $2,950-$2,880 supports. 📉
For now, traders remain attentive, watching for whether the recent dip turns into a sustained recovery or another consolidation phase. 🔄
Read More
- Clash Royale Best Boss Bandit Champion decks
- Vampire’s Fall 2 redeem codes and how to use them (June 2025)
- Mobile Legends January 2026 Leaks: Upcoming new skins, heroes, events and more
- Clash Royale Season 79 “Fire and Ice” January 2026 Update and Balance Changes
- M7 Pass Event Guide: All you need to know
- World Eternal Online promo codes and how to use them (September 2025)
- Clash Royale Furnace Evolution best decks guide
- Best Arena 9 Decks in Clast Royale
- Best Hero Card Decks in Clash Royale
- Clash of Clans January 2026: List of Weekly Events, Challenges, and Rewards
2025-11-20 03:14