Bitcoin [BTC], that digital rascal, has been playing hopscotch again, leaping a merry 13.2% over the last six days. Apparently, it’s back above the oh-so-crucial short-term level of $81k. You remember that level, don’t you? It was all cozy support back in mid-March, before turning into a grumpy old resistance in April. 🙄
Now, while these gains might seem like a bullish parade, market guru Peter Brandt (who, I assume, knows a thing or two) suggests it’s more of a corrective shimmy than an impulsive leap. According to his Elliot Wave theory mumbo jumbo, this bounce is likely to be followed by a deeper plunge. He’s even pinpointing a “max pain accumulation target” of $72k-$74k. Ouch! 🤕
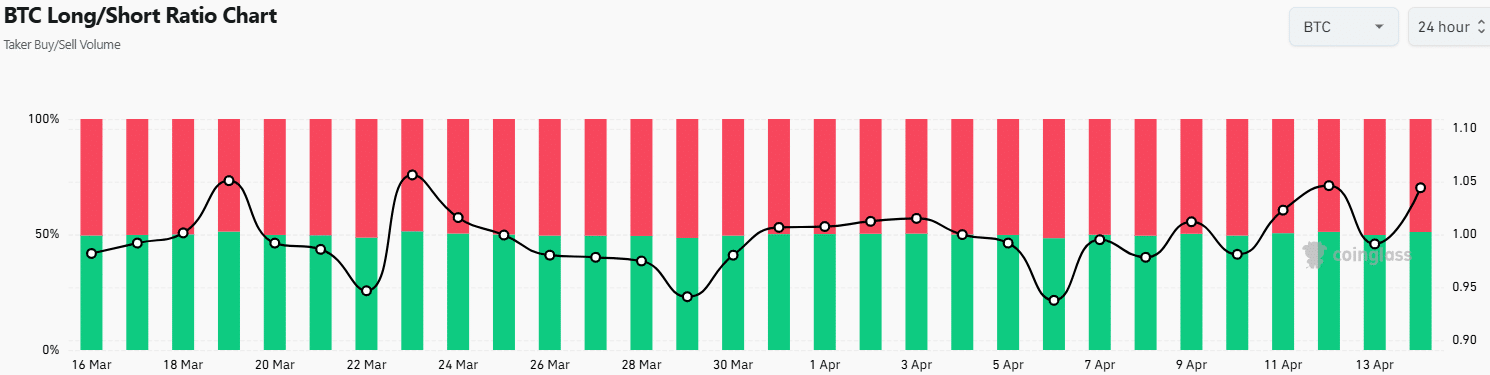
The taker buy/sell volume, which sounds like something out of a Wall Street thriller, reveals a long/short ratio of 1.04. In plain English, 51% of the taker volume was long, hinting at some short-term bullish optimism. Will the Bitcoin bulls keep charging, or will this corrective phase prediction rain on their parade? ☔️
Potential for a Bitcoin accumulation phase (or is it?)
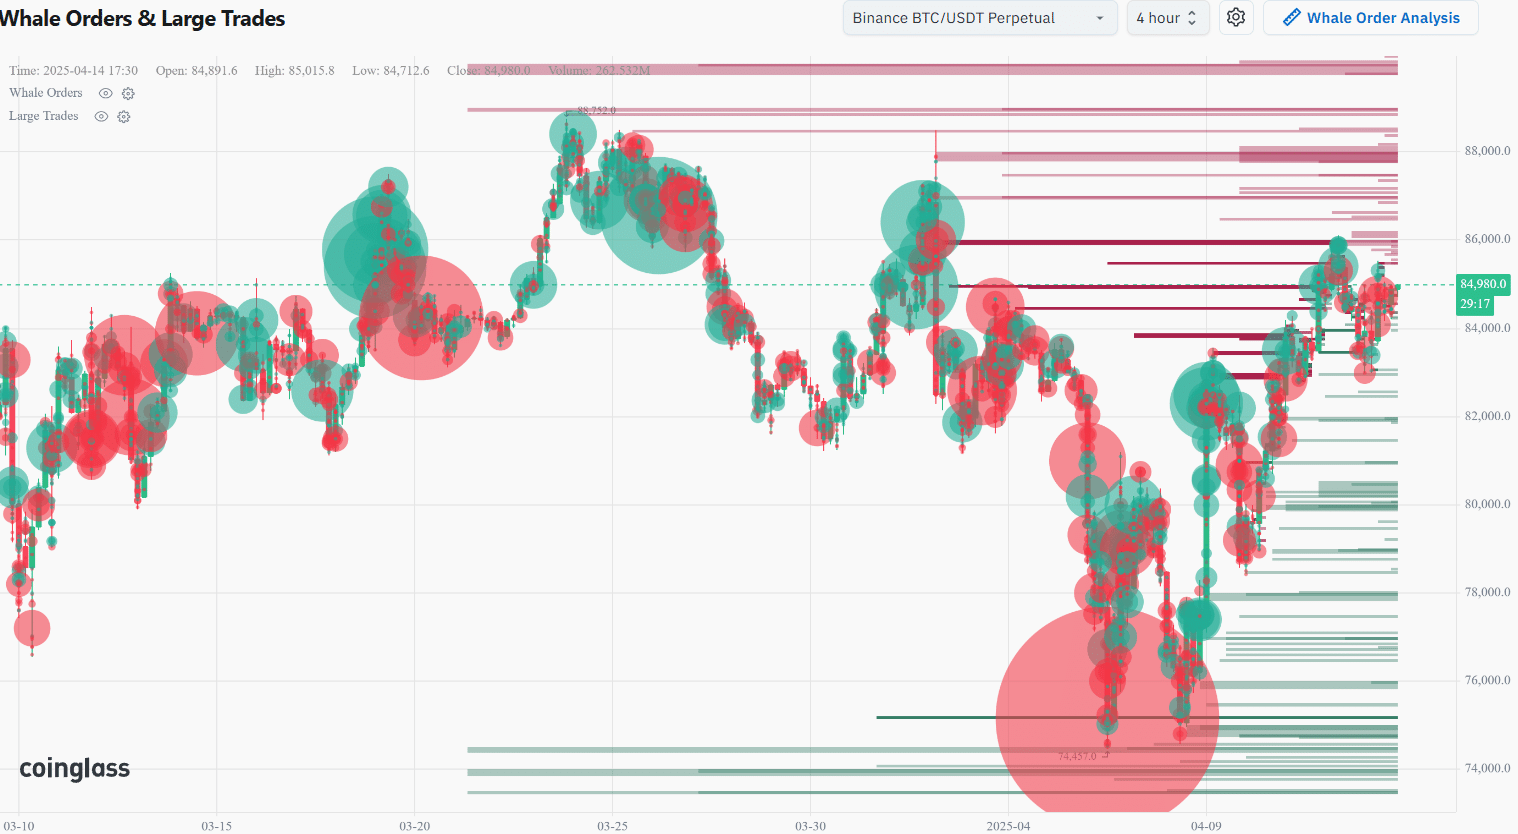
The whale orders chart from Coinglass (because regular glass just isn’t exciting enough) shows a substantial sell wall at $86k, $88k, and $91k. So, those traders already riding the long position might want to consider cashing in at these levels. Just a thought! 🤔
The whale sell volume earlier this week showed some large sell orders, but it wasn’t enough to stop the slow ascent toward $85k. Whales, it seems, can be surprisingly polite. 🐳
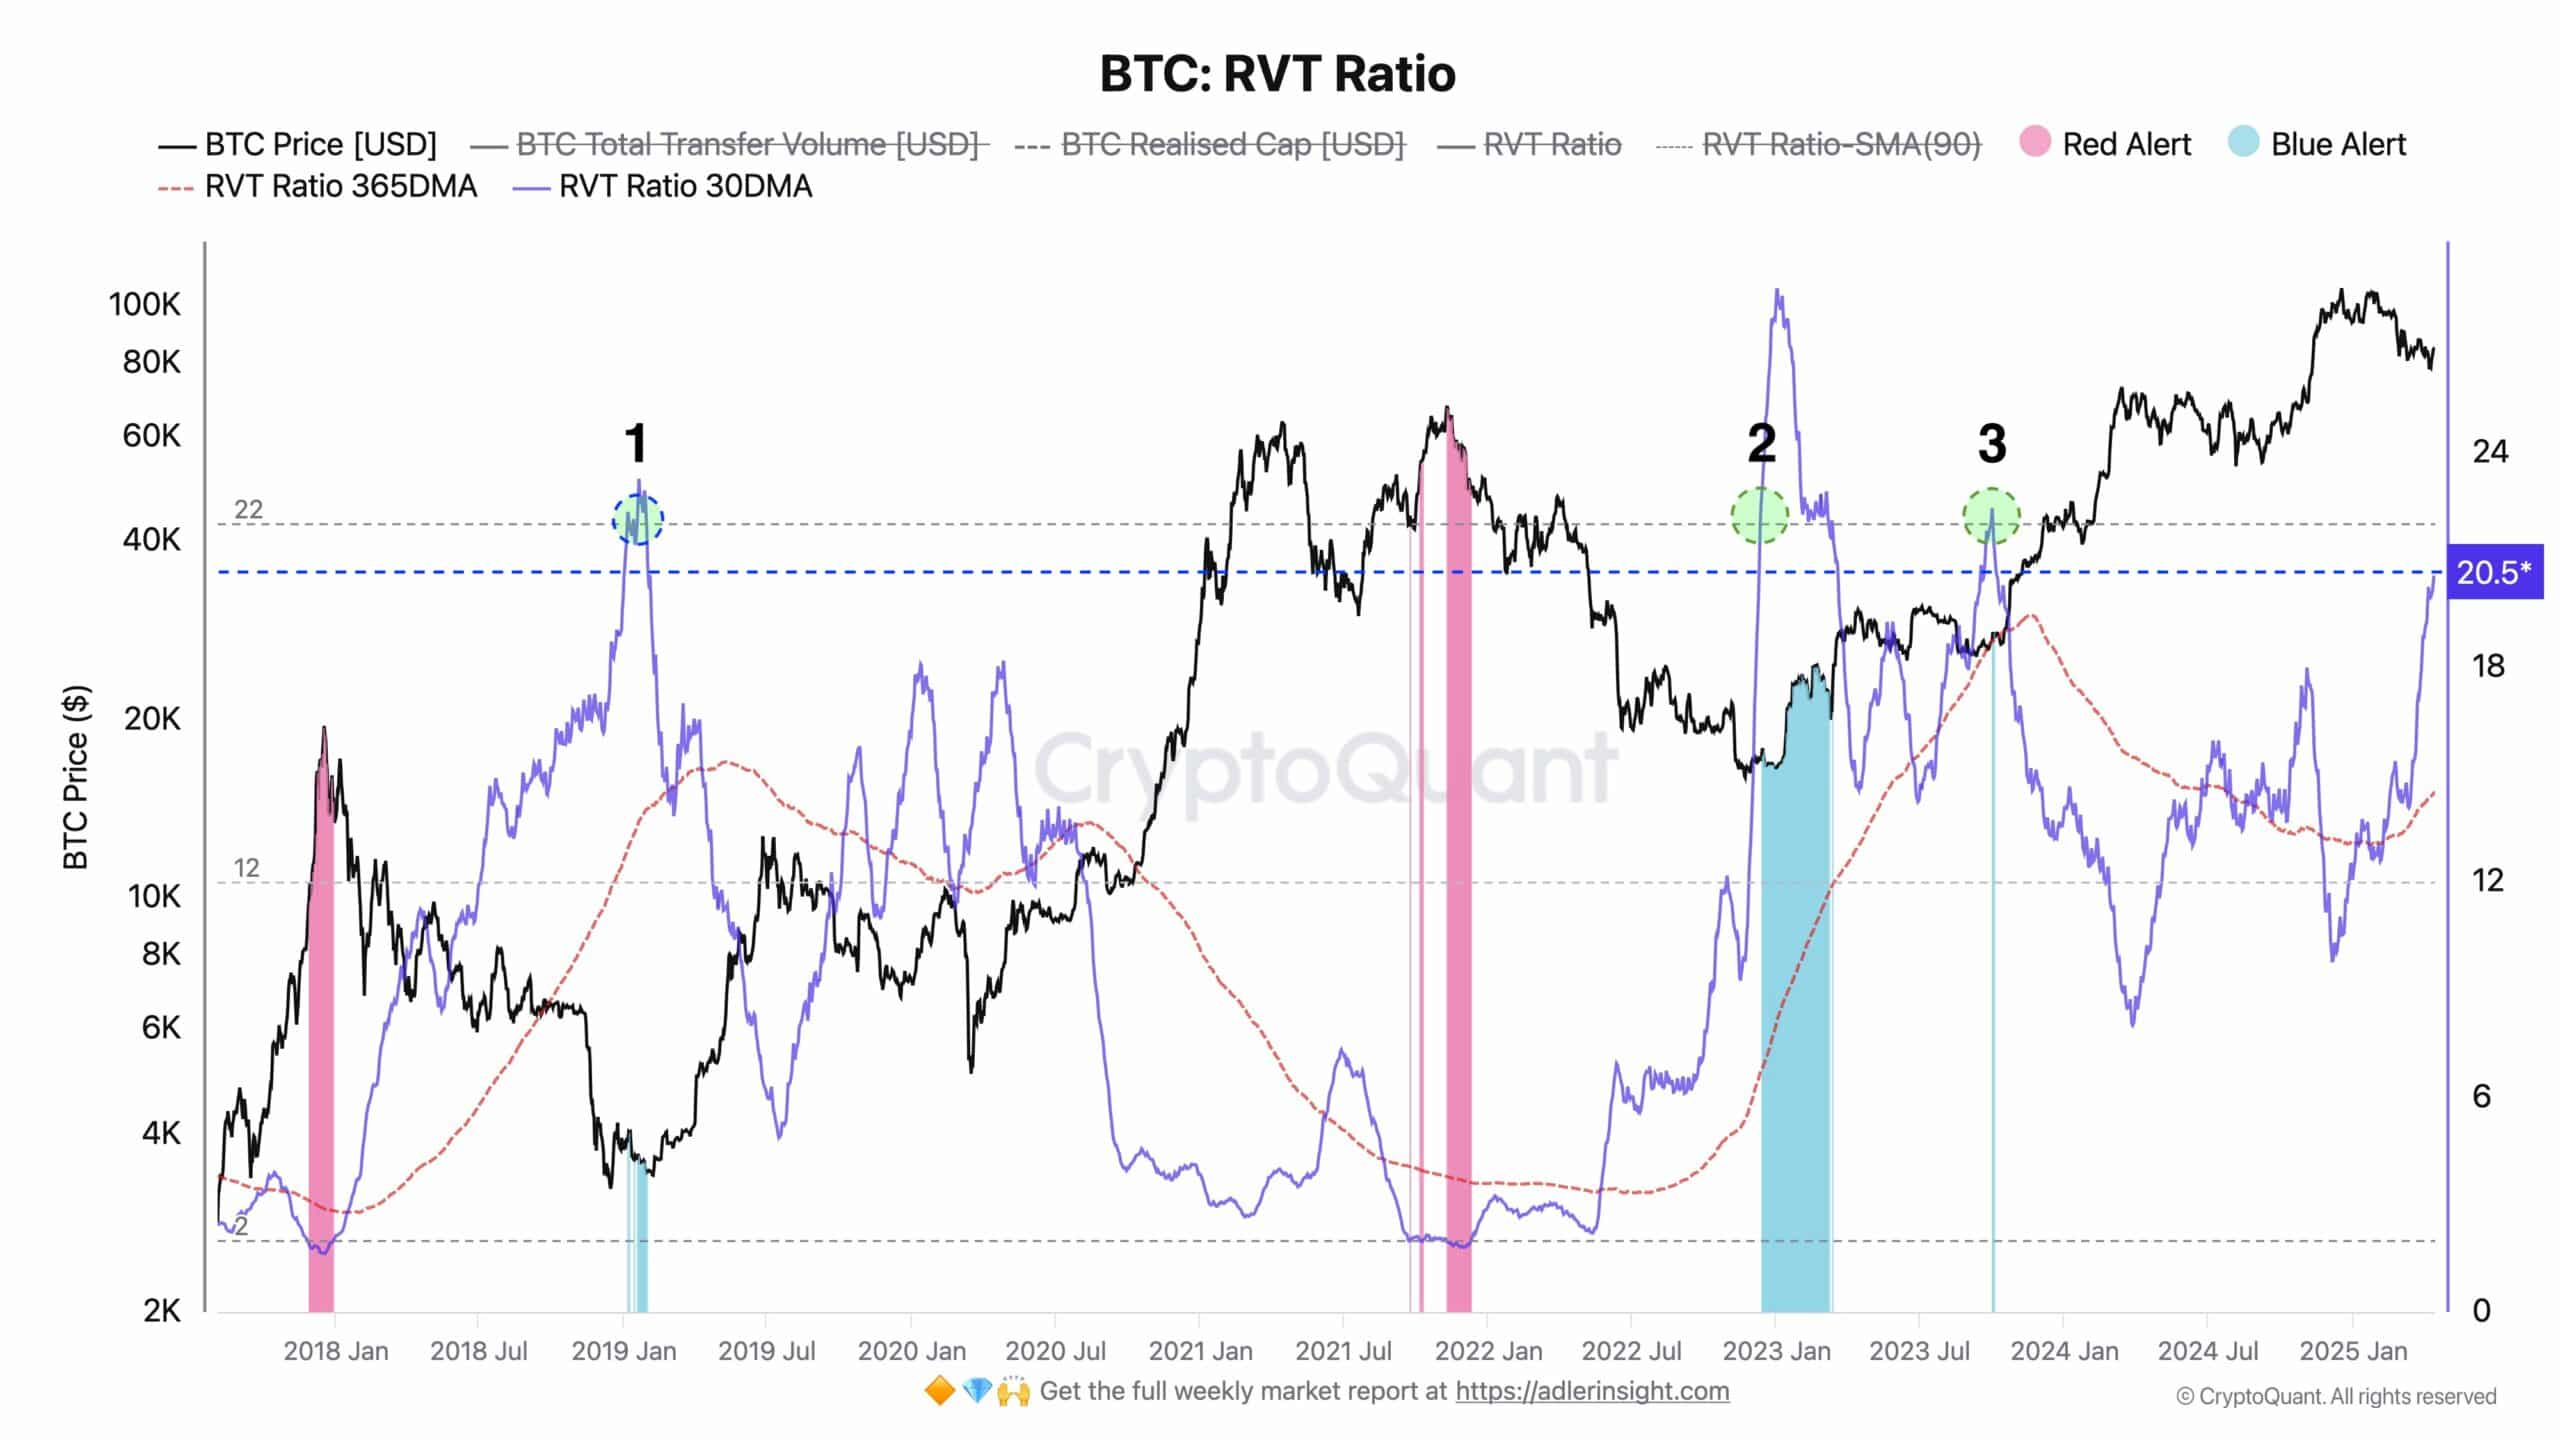
For those with a bit more patience (and perhaps a monocle), crypto analyst Axel Adler Jr. has some intriguing insights. He pointed out on X (formerly known as Twitter, for those living under a rock) that the Bitcoin Realized Value to Transaction Volume ratio (RVT) might be on the verge of flashing a bullish signal. Fancy! 🧐
The RVT, apparently, is the cooler cousin of the Network Value to Transaction Volume (NVT) ratio. Both are like the P/E ratio for companies, but for the wild world of crypto. The RVT uses the realized cap instead of the market cap, making it less prone to dramatic mood swings. 💃
The RVT metric’s 30-day moving average is currently at 20.5, and a climb beyond 22 generally signals an accumulation phase. This suggests that a large chunk of capital isn’t actively involved in daily transactions, hinting at accumulation. Or maybe everyone’s just taking a nap. 😴
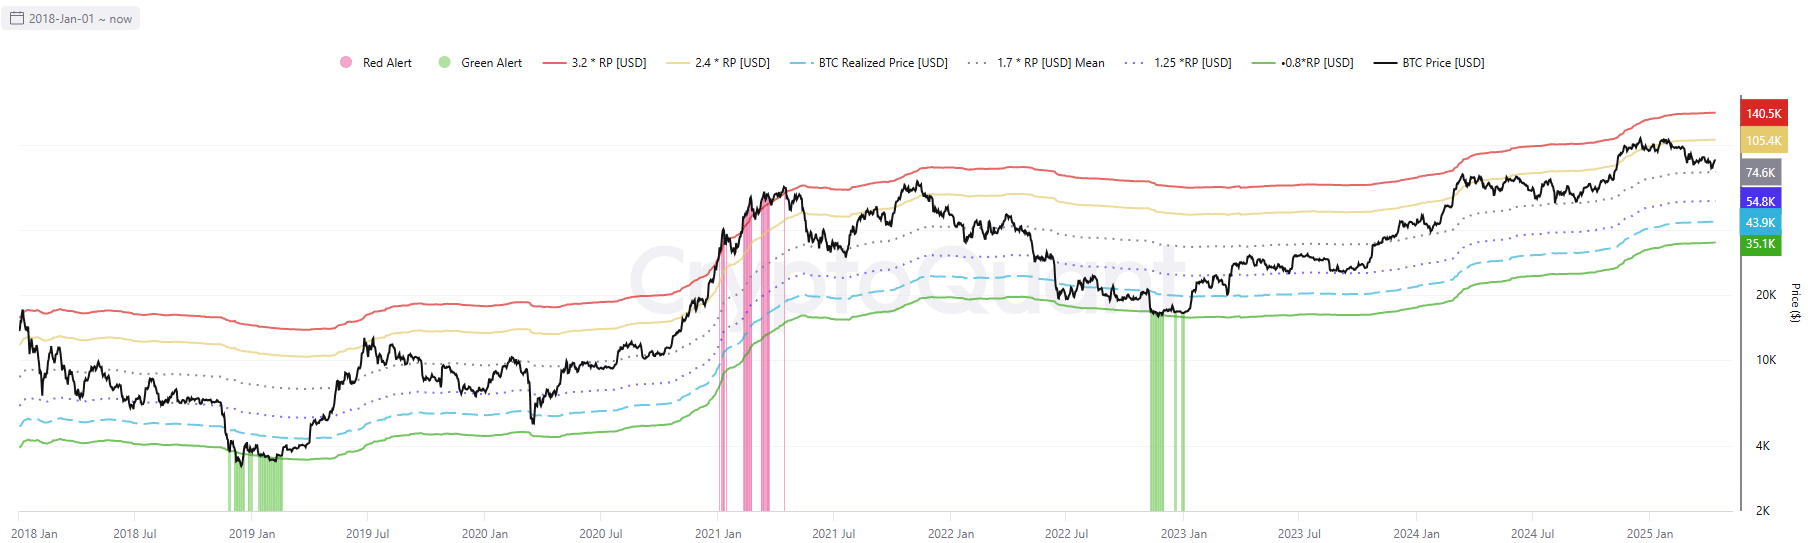
Bitcoin’s realized pricing bands also indicate a potential price bounce towards $105k or higher. Over the past couple of weeks, they’ve bounced higher from the 1.7RP at $74.6k (the realized price was at $43.9k at press time). So, buckle up, buttercup! 🚀
The last time the 1.7RP was tested was back in September. In the months that followed, a bounce beyond the 2.4RP materialized. Whether BTC will continue its current corrective dance and revisit $74k before such a bounce remains to be seen. But hey, a BTC accumulation phase could also spice things up. It’s all just one big, unpredictable adventure! 🤪
Read More
- Clash Royale Best Boss Bandit Champion decks
- Vampire’s Fall 2 redeem codes and how to use them (June 2025)
- World Eternal Online promo codes and how to use them (September 2025)
- How to find the Roaming Oak Tree in Heartopia
- Mobile Legends January 2026 Leaks: Upcoming new skins, heroes, events and more
- Best Arena 9 Decks in Clast Royale
- ATHENA: Blood Twins Hero Tier List
- Clash Royale Furnace Evolution best decks guide
- Brawl Stars December 2025 Brawl Talk: Two New Brawlers, Buffie, Vault, New Skins, Game Modes, and more
- What If Spider-Man Was a Pirate?
2025-04-15 10:17