Well, folks, Bitcoin is currently cruising at a leisurely $107,793 to $108,316 per unit, which is a fancy way of saying it’s down 1% from yesterday’s wild ride. With a market cap of $2.19 trillion (yes, trillion with a “T”) and a 24-hour trading volume of $38.79 billion, this cryptocurrency is like that friend who always shows up to the party but never brings snacks. The price has danced between $107,367 and $112,000 today, which is about as stable as my New Year’s resolutions.
Bitcoin
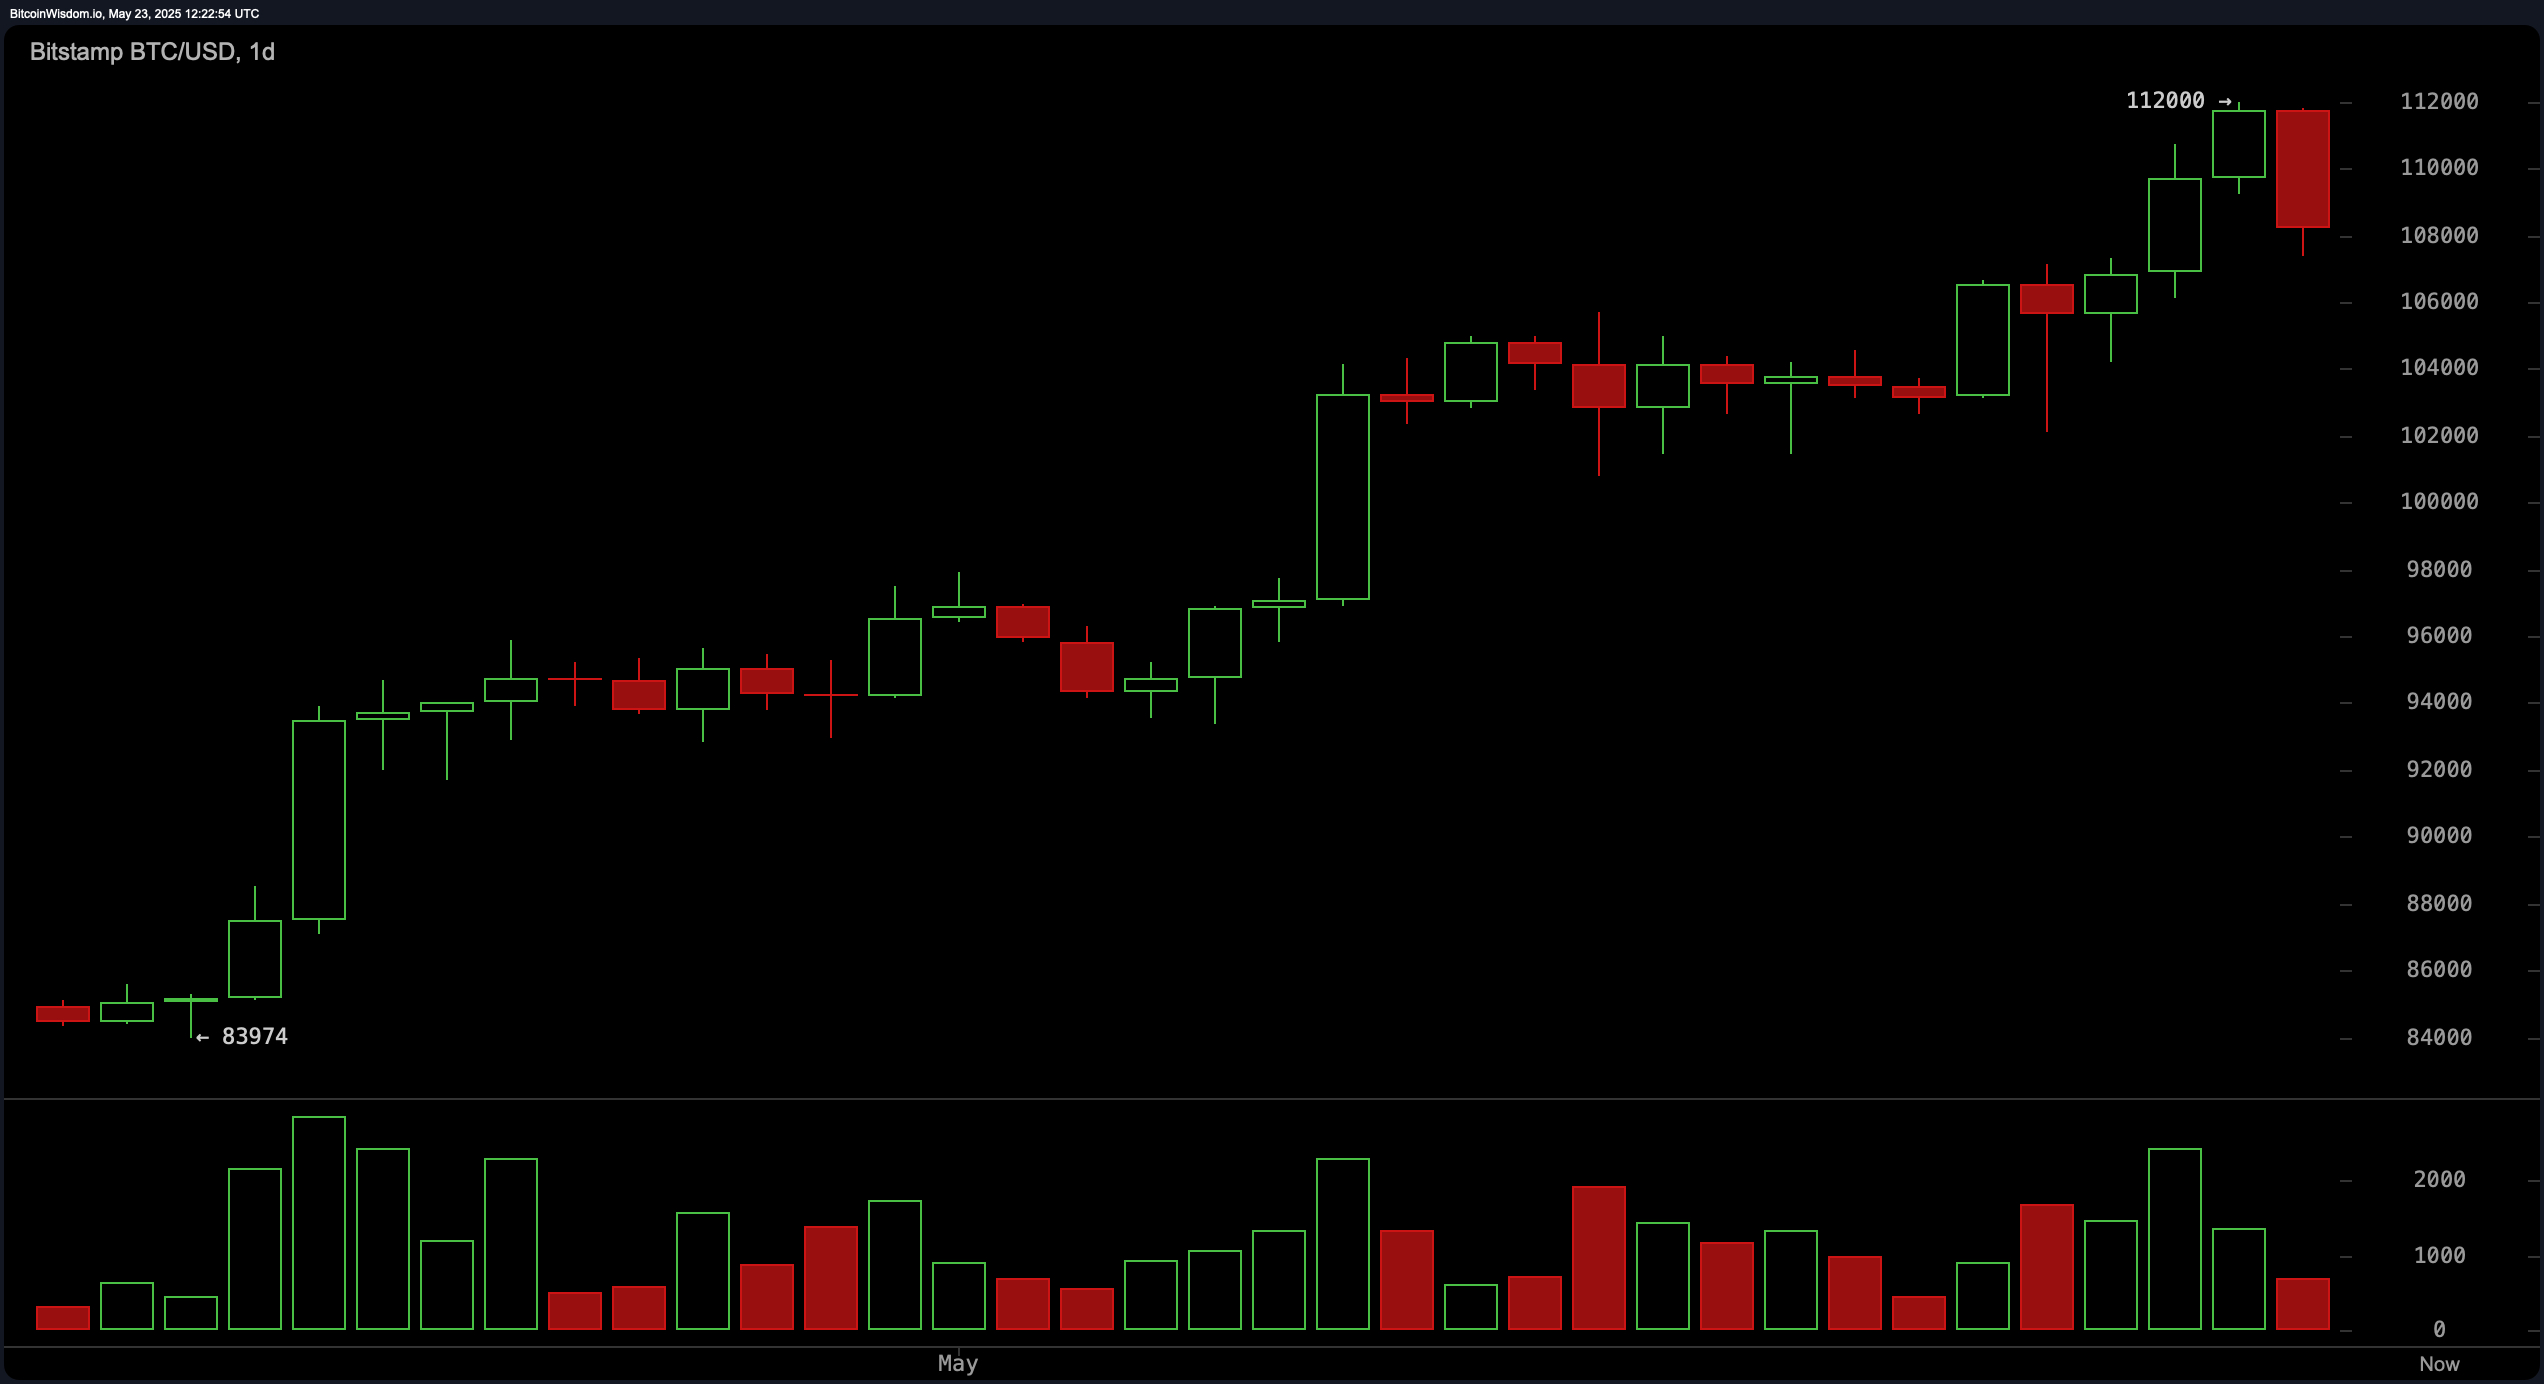
Bitcoin’s daily chart is like a glass half full, or half empty, depending on your mood. It hit a recent high of $112,000, which is great, but then it decided to throw a tantrum with a bearish engulfing candlestick pattern. It’s like watching a toddler throw their toys out of the crib. Volume was booming during the climb, but now it’s taking a nap, which usually means a pullback is on the horizon. Buckle up!
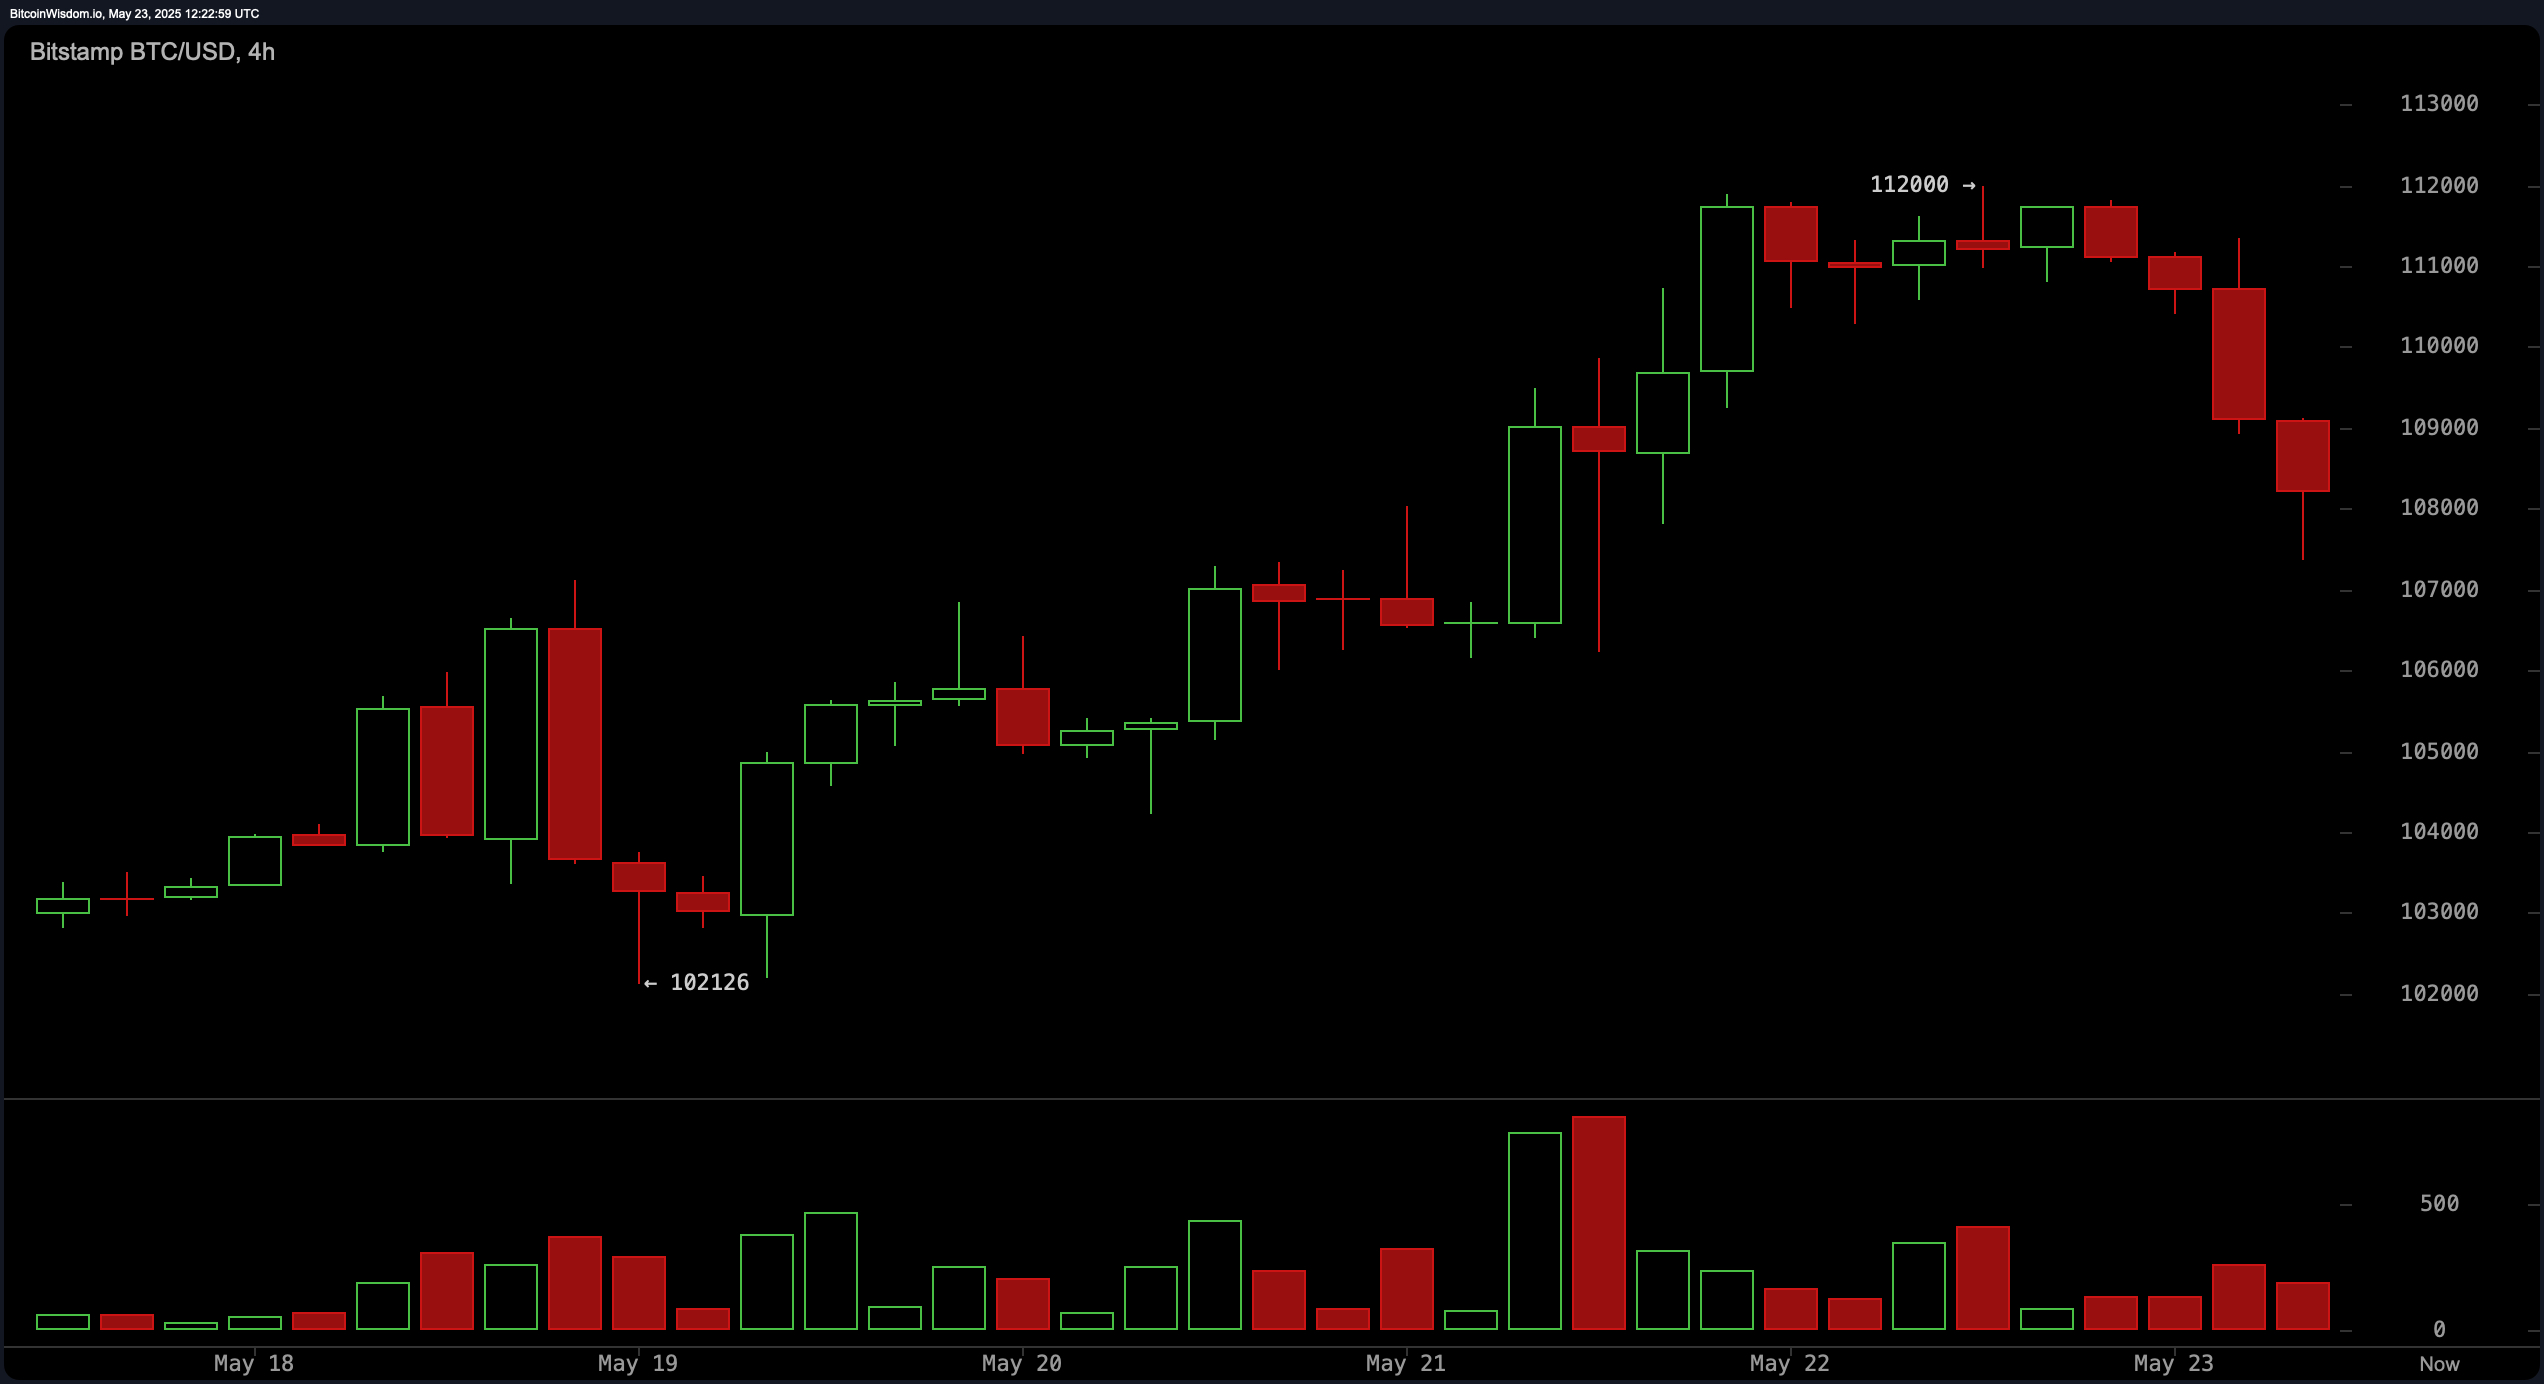
The 4-hour chart is like a soap opera, full of drama. Bitcoin is tracing a mid-term downtrend after peaking, showing a series of lower highs and lower lows. It’s like watching a sad movie where the protagonist just can’t catch a break. The red volume bars are screaming “SELL!” louder than my neighbor’s dog at 3 AM. If you’re looking to jump back in, keep an eye on $106,500, but only if it behaves and shows some signs of life.
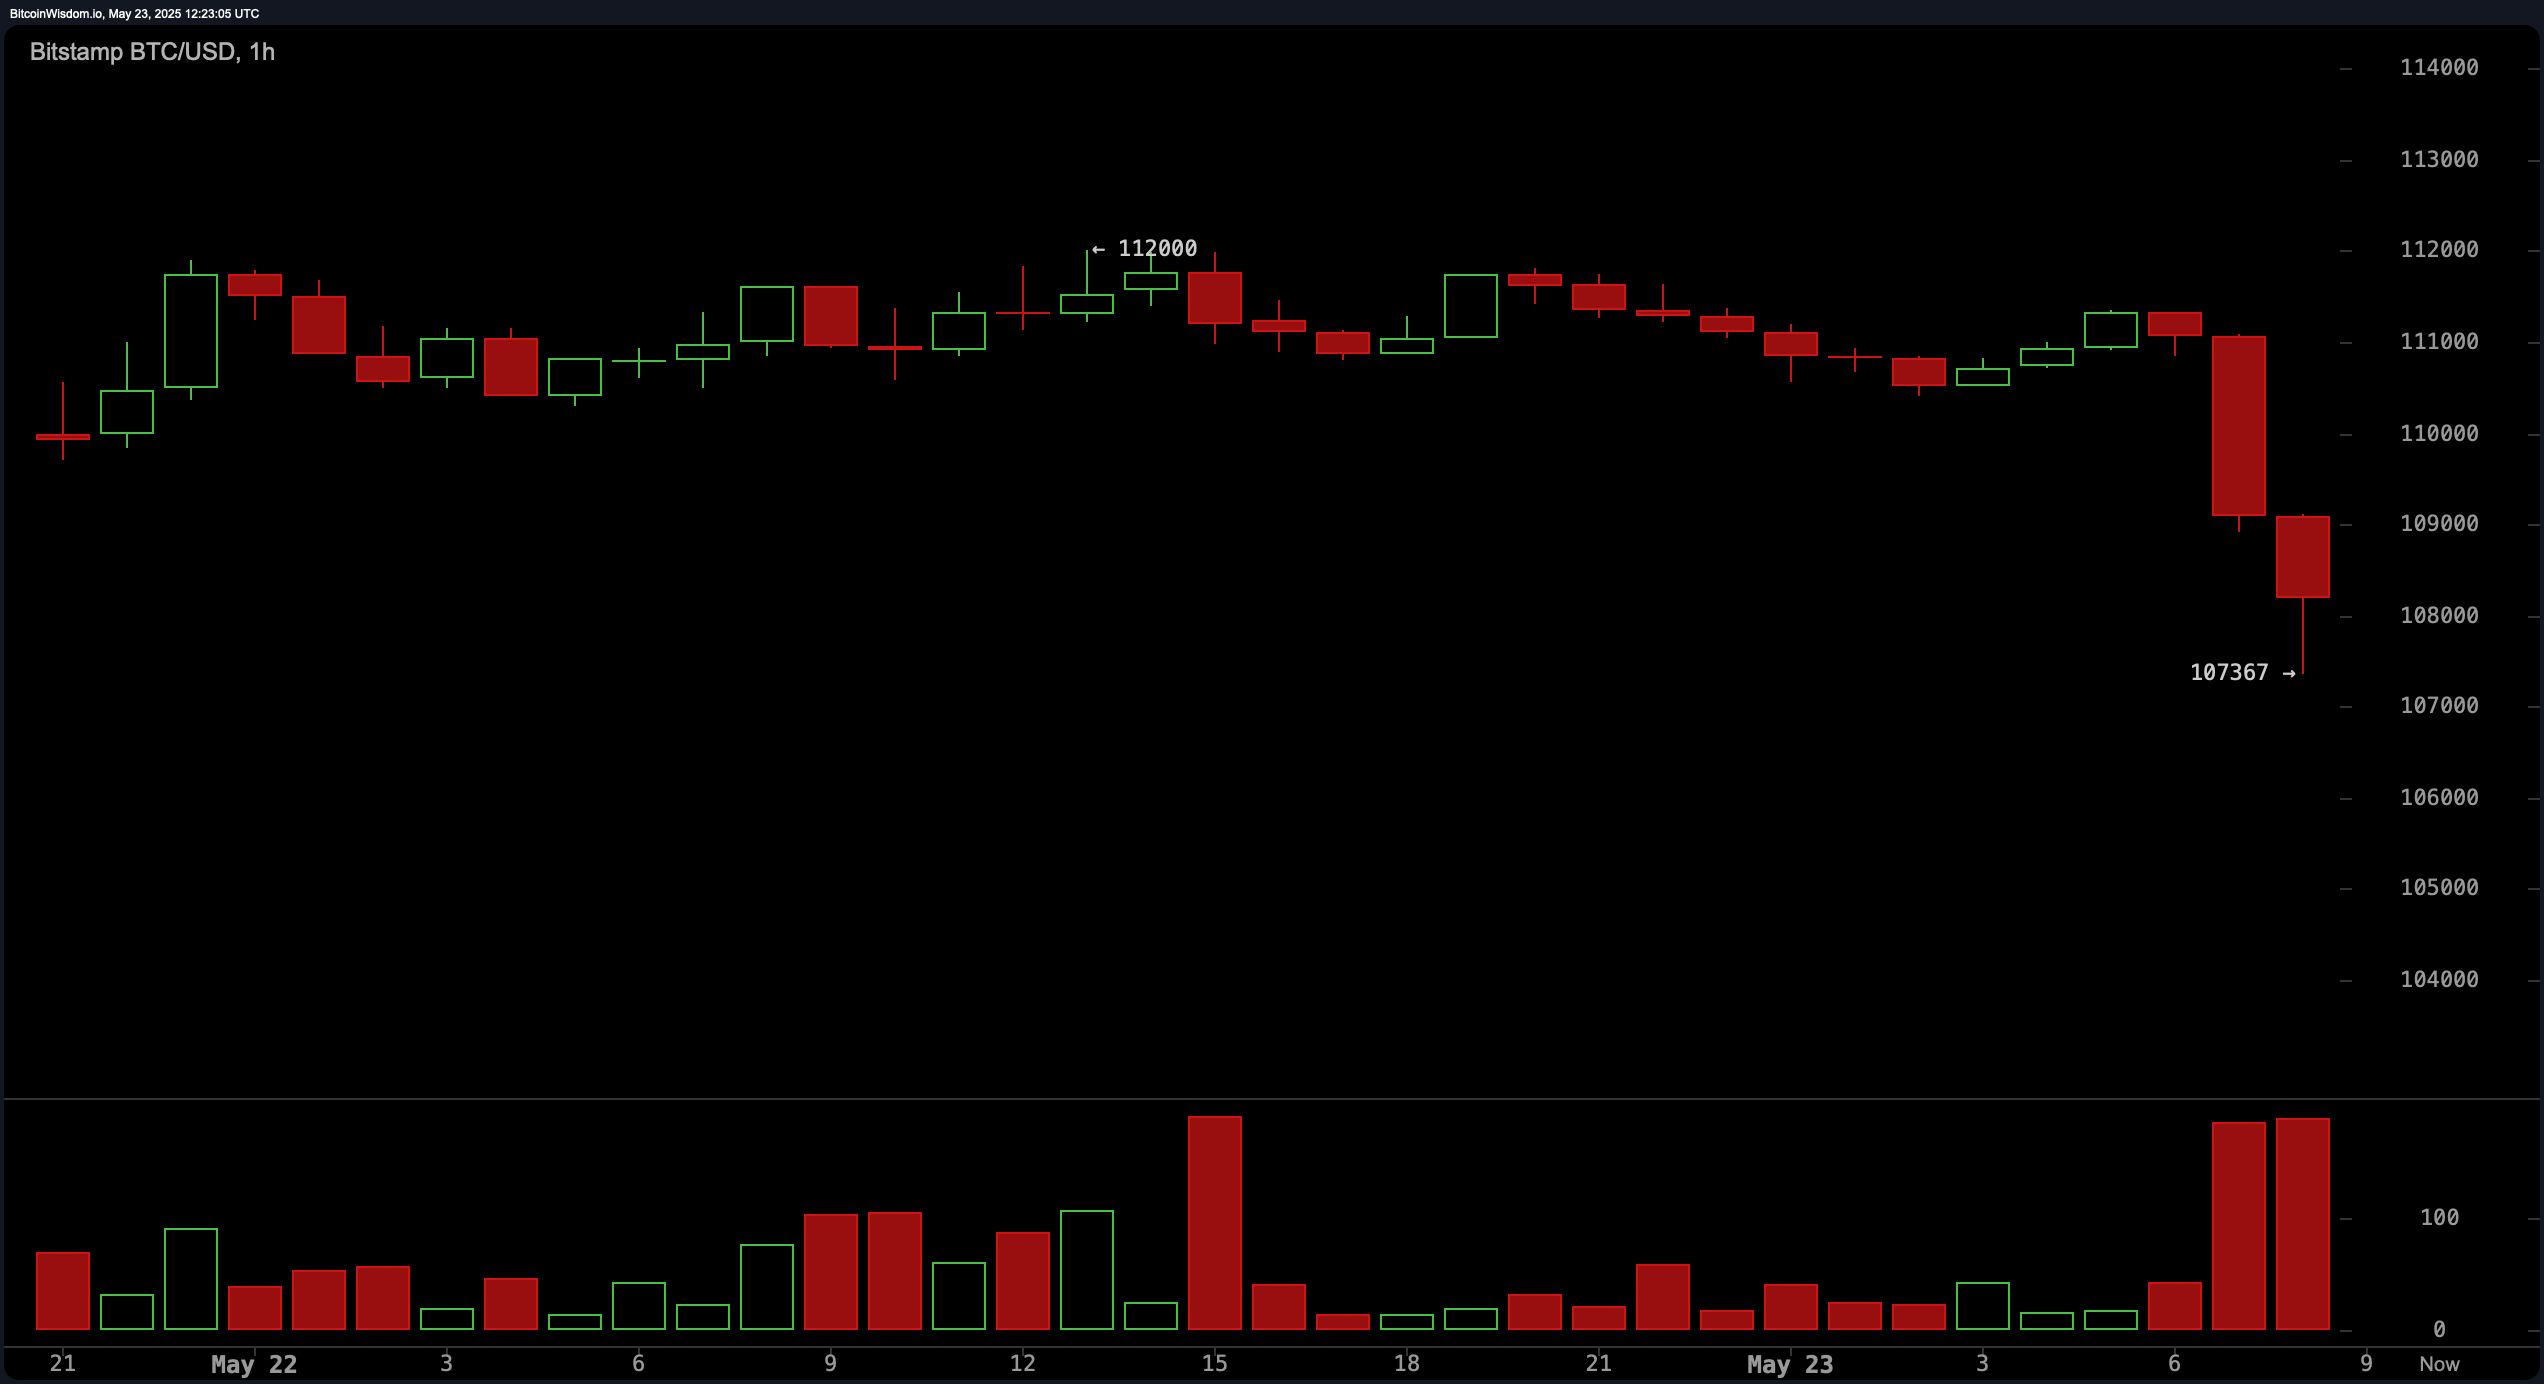
Now, let’s talk about the 1-hour chart, which is like the dramatic climax of our story. A big red candlestick just sent Bitcoin tumbling from around $111,000 to below $108,000, which is like watching your favorite ice cream cone fall to the ground. This is often a sign of panic selling, so keep your eyes peeled for a potential double bottom or an RSI divergence around $105,500 to $106,000. It’s like waiting for the other shoe to drop.
Technical indicators are giving us mixed signals, like a bad date. The RSI is at 67, and the ADX is at 35, which is neutral, while the Stochastic at 87 and CCI at 140 are waving red flags. Meanwhile, the MACD at 4,167 is trying to be the optimist in the room, suggesting some bullish momentum. All the moving averages are flashing green, like a traffic light that’s stuck on go. So, what’s the takeaway? Bitcoin’s broader trend is still bullish, but it’s like a rollercoaster that’s about to take a dive.
Even with today’s 1% dip, Bitcoin is still strutting its bullish stuff, supported by buy signals across all key moving averages. If it can stabilize above $108,000 and show some bullish candlestick patterns, we might just see it retest that $112,000 resistance. Fingers crossed! 🤞
Bear Verdict:
But wait! The bearish candlestick formations are lurking like a bad smell. If Bitcoin can’t hold the $108,000 support, it might just slip down to the $105,000 zone or lower. So, dear bullish traders, keep your eyes peeled and your caution flags waving until we get clearer signs of support. It’s a wild world out there!
Read More
- Clash Royale Best Boss Bandit Champion decks
- Vampire’s Fall 2 redeem codes and how to use them (June 2025)
- Mobile Legends January 2026 Leaks: Upcoming new skins, heroes, events and more
- World Eternal Online promo codes and how to use them (September 2025)
- How to find the Roaming Oak Tree in Heartopia
- Clash Royale Season 79 “Fire and Ice” January 2026 Update and Balance Changes
- Best Arena 9 Decks in Clast Royale
- Clash Royale Furnace Evolution best decks guide
- Best Hero Card Decks in Clash Royale
- FC Mobile 26: EA opens voting for its official Team of the Year (TOTY)
2025-05-23 15:57