In a world where the arcane rites of Fibonacci sequences are consulted with the reverence once reserved for astrologers, Bitcoin’s price chart has been reduced to a mere tapestry of golden ratios. According to the enigmatic oracle known as CryptoCon, the next logical step in this cosmic Fibonacci blueprint is a price tag of $166,754—a number so absurd it could only be conjured by a cryptocurrency analyst with a calculator and a death wish.
- Since the nadir of $15,500 in late 2022, Bitcoin has performed a waltz across Fibonacci levels: $30,362, $46,831, $71,591, and $109,236. Each pause, it seems, was a mere pirouette in the grand ballet of market manipulation.
- CryptoCon, the self-proclaimed prophet of proportionality, insists the 5.618 extension is “inevitable.” One wonders if inevitability includes the inevitable collapse of sanity.
- Institutional demand, bolstered by U.S. spot Bitcoin ETFs now hoarding $150 billion like Scrooge McDuck in a Bitcoin vault, continues to inflate this digital Ponzi scheme with the enthusiasm of a Victorian balloonist.
- Analysts, those modern-day Nostradamuses, caution of September’s “seasonal corrections”—a polite euphemism for the market’s annual ritual of self-destruction. Sentiment metrics, meanwhile, suggest investors are indulging in profit-taking with the abandon of a drunkard at a champagne bar.
Fibonacci’s fingerprints on Bitcoin’s rise
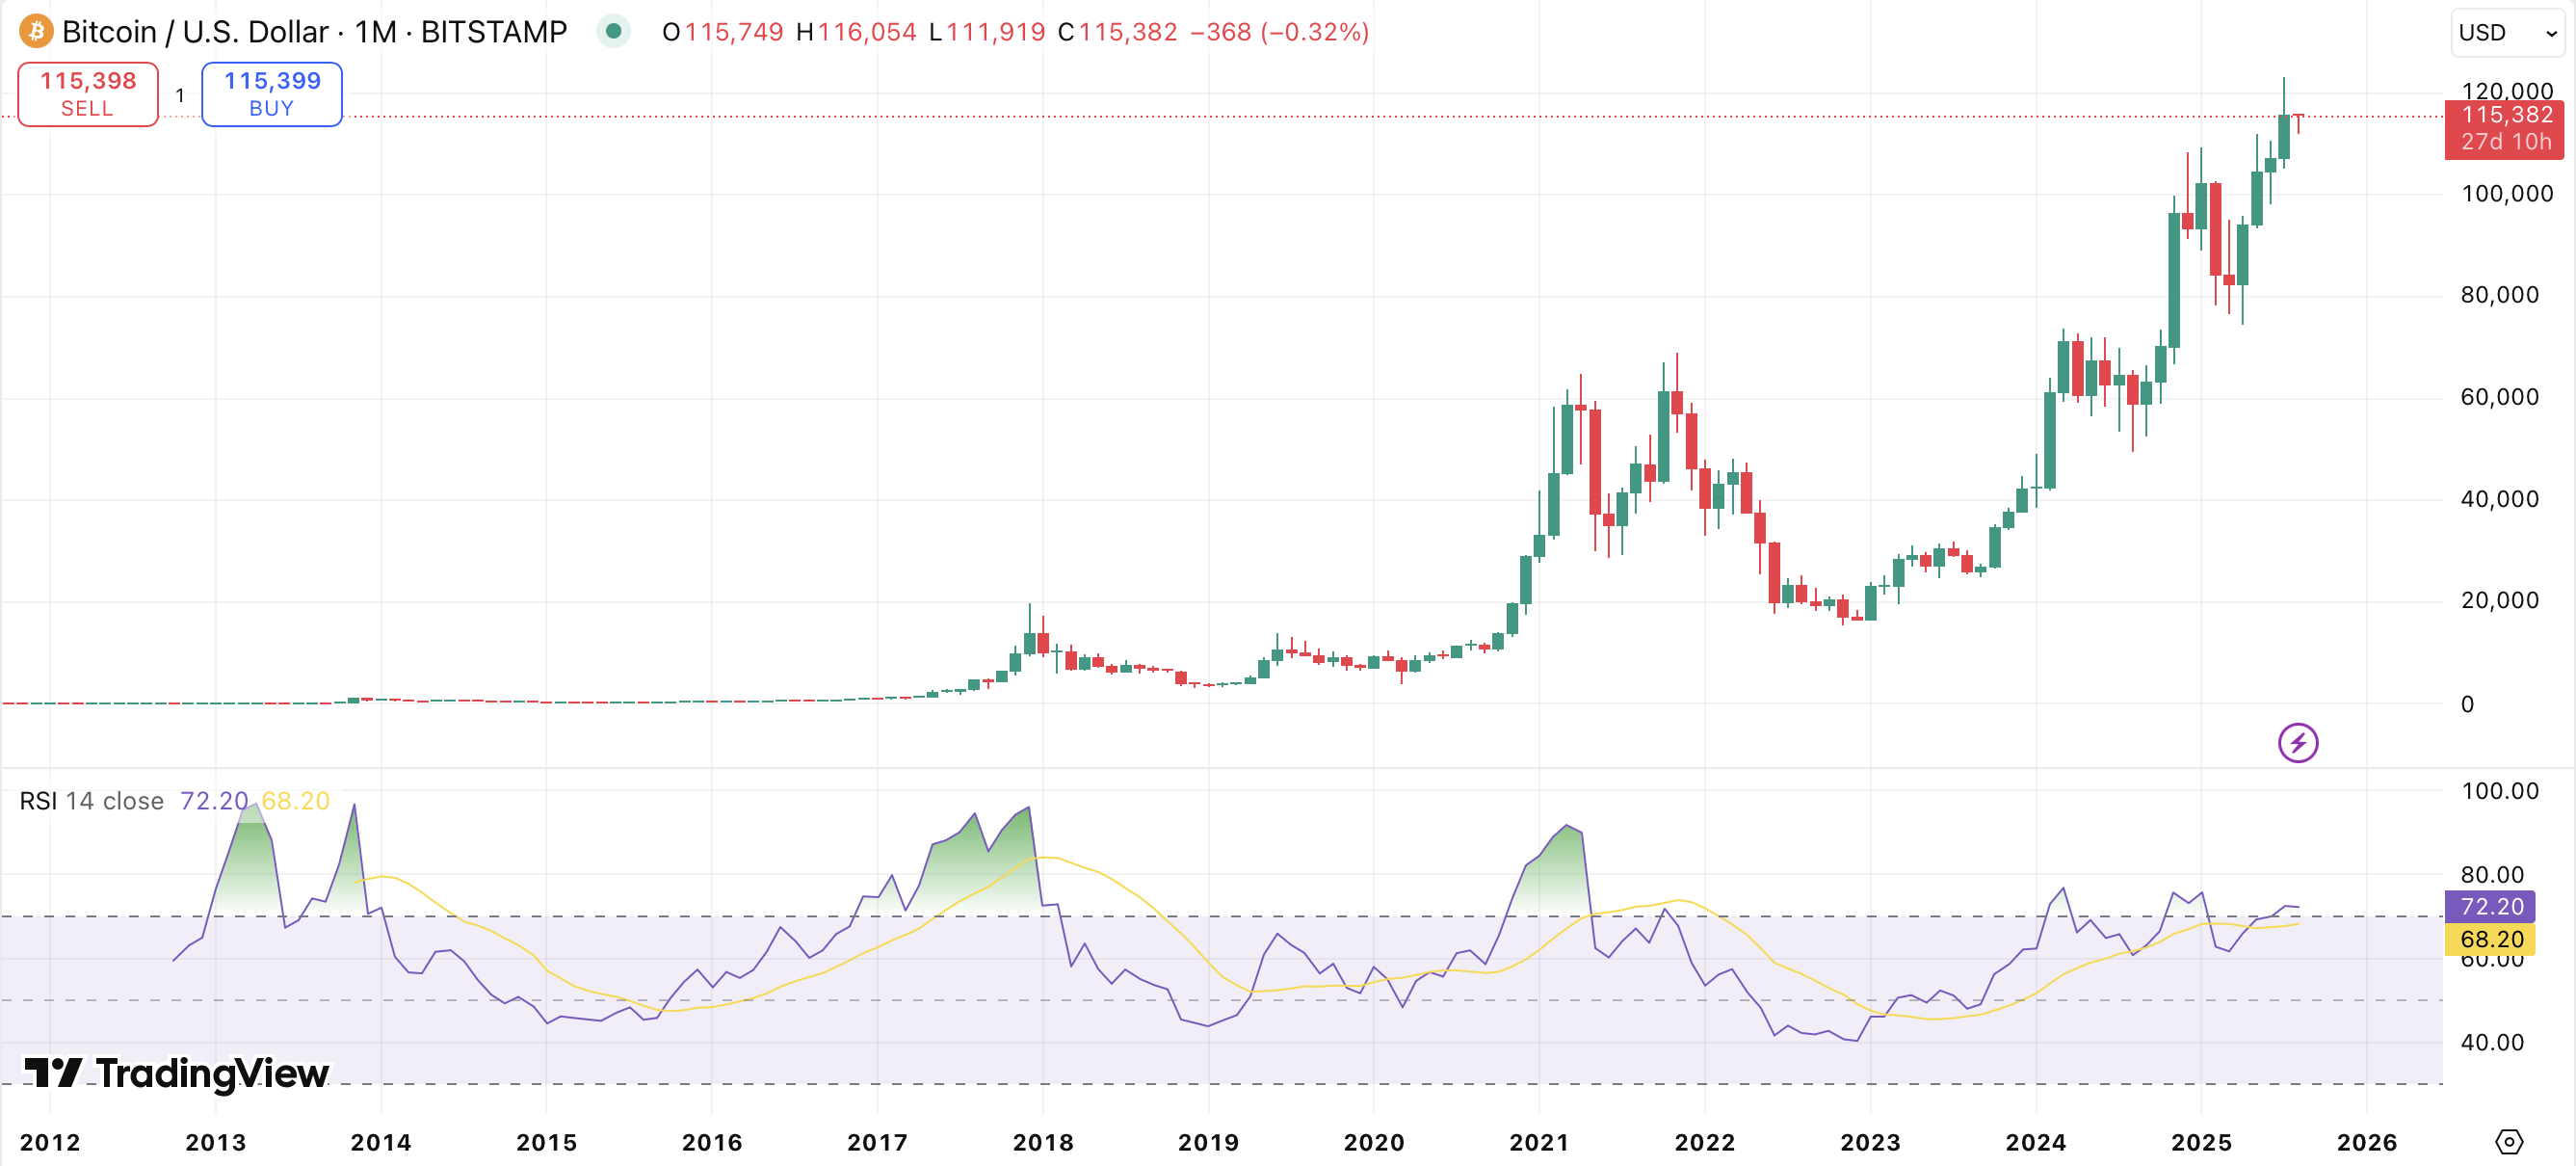
Bitcoin’s recent all-time high near $123,000 has once again summoned the age-old question: Is this the summit, or merely a hill in the foothills of madness? As of this writing, BTC has retreated to $114,500—a 7% drop from its peak and a 4% decline over seven days. One suspects the market is simply taking a breather to collect its thoughts.
CryptoCon, that tireless acolyte of numerology, claims Bitcoin is following a “repeating pattern” akin to a broken record. His model, he assures us, has been validated over two years of meticulous observation. If this trajectory holds, the next destination—$166,754—is as inevitable as a Brexit deal.
During every Bitcoin decline, people start to fear the worst.
I see 123k here, which is not $166,754.
Every breakout this cycle has led to the perfect retest of a .618 extension.
The 5.618 is inevitable!
— CryptoCon (@CryptoCon_) August 1, 2025
The saga begins in late 2022, when Bitcoin plummeted to $15,500 after the FTX implosion. CryptoCon dubs this “Retrace Point Zero,” a term that sounds suspiciously like a GPS coordinate for financial ruin. From there, Bitcoin embarked on a series of ascents, pausing at Fibonacci levels like a tourist on a checklist.
In April 2023, BTC reached $30,362—a 1.618 extension. It lingered, then resumed its climb. By January 2024, it had touched $46,831 (2.618), consolidating before another ascent. In 2024, it flirted with $71,591 (3.618), twice failing to break through, before surging to $109,236 (4.618) in January 2025. Now, at $123,000, it teeters between Fibonacci levels, a ghost in the machine.
CryptoCon insists this is a “transition zone.” If history repeats, the next stop is $166,754—a number so round and inviting it could be a trapdoor.
Why history still rhymes at $166,000
CryptoCon’s Fibonacci model, while technically complex, is not new. The same “rhyming” has occurred in prior cycles. In 2013, Bitcoin peaked at $1,150 (5.618 from 2012). In 2017, it hit $20,000 (4.618 from 2015). Even 2021’s $69,000 peak aligns with the 3.618 extension of the 2018 lows. One might conclude that Bitcoin’s ascent is less a bull market and more a Fibonacci-themed circus.
The spacing between these levels—95%, 54%, 53%, 52%—suggests a market climbing in bursts, pausing to catch its breath before continuing its ascent. If this pattern persists, the next 52% jump would land at $166,754. A number so precise it could be the work of a mad mathematician.
Non-technical factors also conspire to support this madness. The 2024 halving, which slashed miner rewards, has historically preceded price surges. We are now 16 months into that cycle, and the market is behaving as if it’s been handed a script by a 1920s vaudeville troupe.
Macro moves and policy shifts
Previous cycles were driven by retail mania and the anarchic whims of exchanges. This cycle, however, is shaped by macroeconomic policies and political theater. The U.S. Federal Reserve, in its infinite wisdom, has kept rates at 4.25-4.5%, a level so high it could be used as a paperweight for the economy’s balance sheet.
Inflation, that old specter, remains stubbornly above 2%. Core inflation hovers at 3%, and the Fed remains as cautious as a cat on a hot tin roof. A CPI report in August could hint at rate cuts, but until then, policy remains as rigid as a Victorian corset.
Regulatory shifts also play a role. The GENIUS Act, passed in July 2025, has given stablecoins a legal framework, while the Strategic Bitcoin Reserve pilot program allows the government to hold Bitcoin like a modern-day gold standard. Enforcement actions have slowed, and the SEC now seems more interested in integration than incarceration.
ETF demand is the cherry on this institutional sundae. BlackRock’s iShares Bitcoin Trust now holds 740,000 BTC, and total ETF assets have hit $150 billion—6.5% of Bitcoin’s market cap. Institutions now control one in fifteen Bitcoins. A number so large it could be the opening line of a dystopian novel.
Behavioral clues and what comes next
The $166,000 target, while mathematically elegant, is also subject to behavioral quirks and seasonal whims. Analyst Benjamin Cowen, in a recent tweet, noted a pattern: post-halving years see gains in July and August, followed by a September correction. This year, July was green. If August follows suit, September may bring a seasonal slump—like a financial Groundhog Day.
In all prior post-halving years (2013, 2017, 2021), #Bitcoin was green in July and August, then red in September.
So far this year we have a green July. If August is also green, we might get a seasonal drop in September before a bounce in October.
— Benjamin Cowen (@intocryptoverse) August 2, 2025
Analyst Axel Adler Jr., meanwhile, focuses on metrics like NUPL and MVRV, which suggest holders are selling coins like hot potatoes. In March and December 2024, these metrics peaked before corrections. Now, at 1.73, they hint at a lower high and a market increasingly wary of its own hubris.
The problem of the late-stage bull cycle is that investors’ risk appetite decreases. The chart shows that in March and December 2024, the metric displayed values above 1.9, but now the metric is forming a lower peak and holders are beginning to actively sell coins, putting…
— Axel 💎🙌 Adler Jr (@AxelAdlerJr) August 4, 2025
Axel predicts two more rallies before the market enters a “slower phase”—a euphemism for the inevitable comedown. Taken together, the technical model still points to $166,000, but near-term corrections and macroeconomic shifts could turn this into a rollercoaster of regret.
In the end, the market remains a realm of uncertainty. Bitcoin’s journey is a farce of proportions only Evelyn Waugh could appreciate. Trade wisely, or as the poet said, “Invest in Bitcoin and weep.”
Read More
- Clash Royale Best Boss Bandit Champion decks
- Mobile Legends January 2026 Leaks: Upcoming new skins, heroes, events and more
- Clash Royale Furnace Evolution best decks guide
- Vampire’s Fall 2 redeem codes and how to use them (June 2025)
- Best Hero Card Decks in Clash Royale
- Mobile Legends: Bang Bang (MLBB) Sora Guide: Best Build, Emblem and Gameplay Tips
- Best Arena 9 Decks in Clast Royale
- Clash Royale Witch Evolution best decks guide
- Brawl Stars Steampunk Brawl Pass brings Steampunk Stu and Steampunk Gale skins, along with chromas
- Brawl Stars December 2025 Brawl Talk: Two New Brawlers, Buffie, Vault, New Skins, Game Modes, and more
2025-08-04 21:19