Ah, May 24, 2025. Bitcoin, ever the drama queen, is strutting around at a stunning $109,273—because why not? With a market cap that would make even the stock market blush at $2.17 trillion and a 24-hour trading volume of $46.66 billion, the price flirted between $107,156 and $109,840, like a love affair with volatility.
Bitcoin
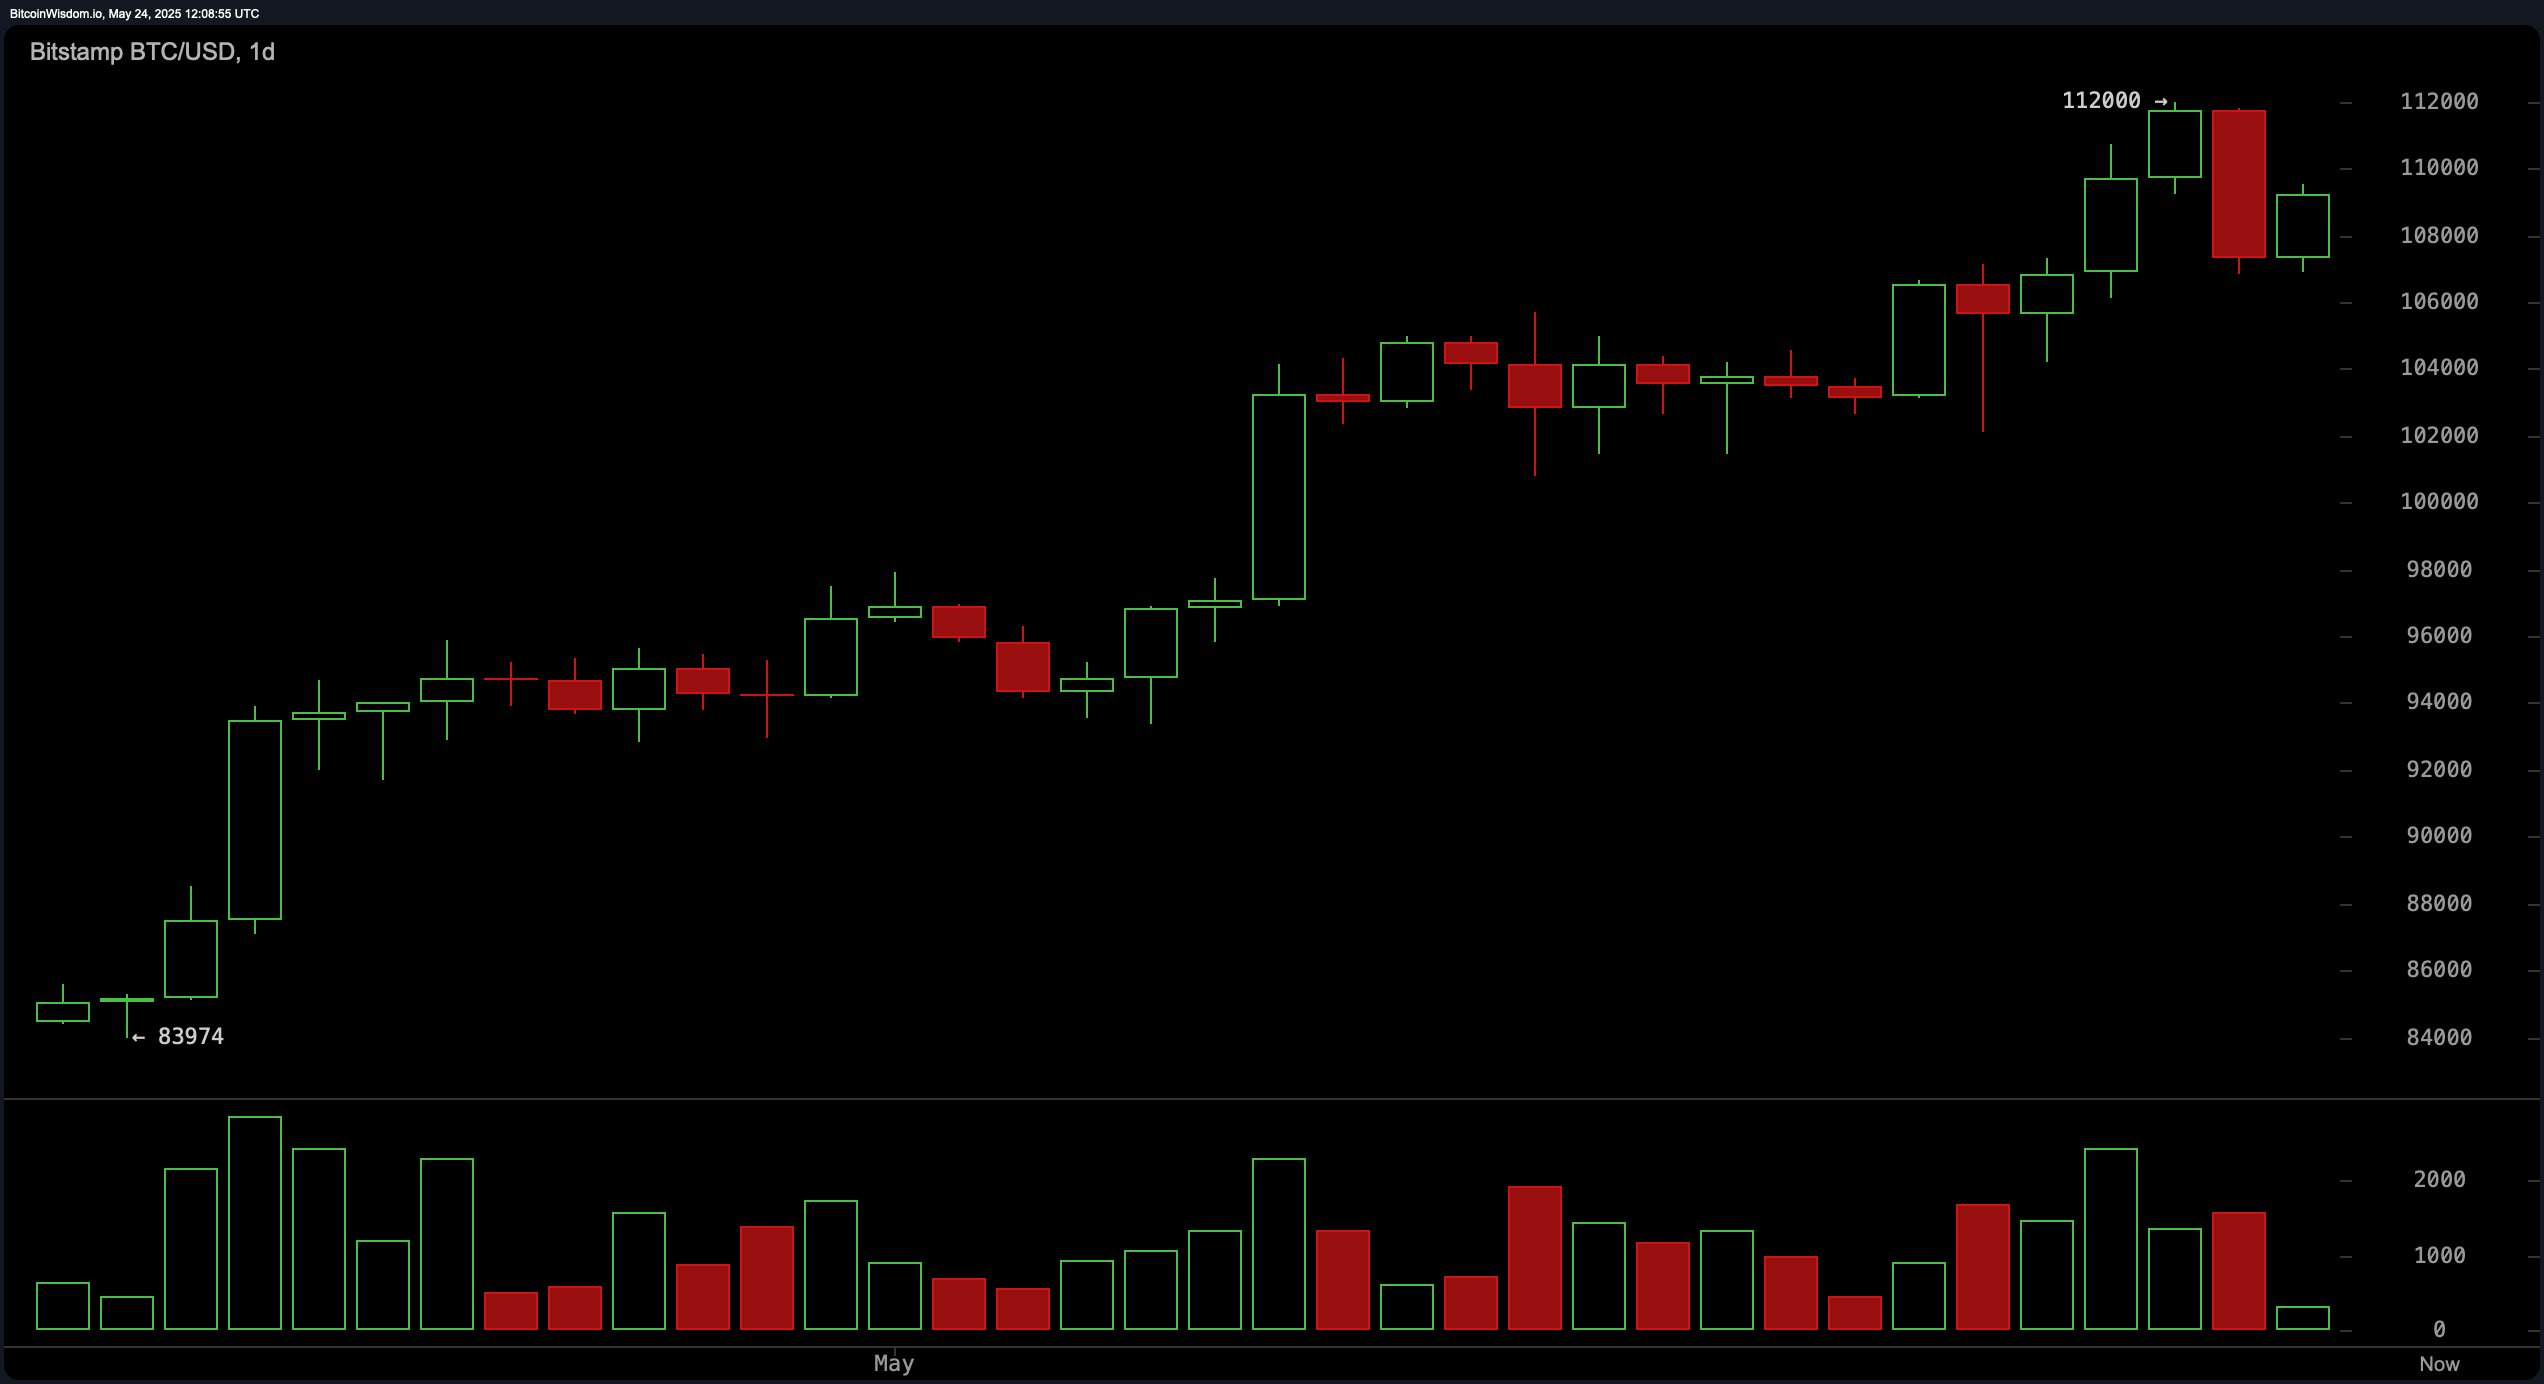
On the daily chart, Bitcoin (BTC) is riding high, but not without its hiccups. The rally took a little breather from a flirtation with $112,000. Support, darling, is safely nestled around $98,000–$100,000, and history kindly reminds us that this zone has been a loyal friend. Resistance, however, is a bit more demanding at $112,000, where sellers appear to have had enough of the fun. Yes, green candles were positively delighted earlier, but that red one at the top—well, let’s call it a cautionary wink. If Bitcoin hangs around above $106,000–$107,000 and prints a bullish engulfing candle, traders might see it as an invitation for a cheeky entry. But if it falters near $112,000, darling, it’s time to exit gracefully.
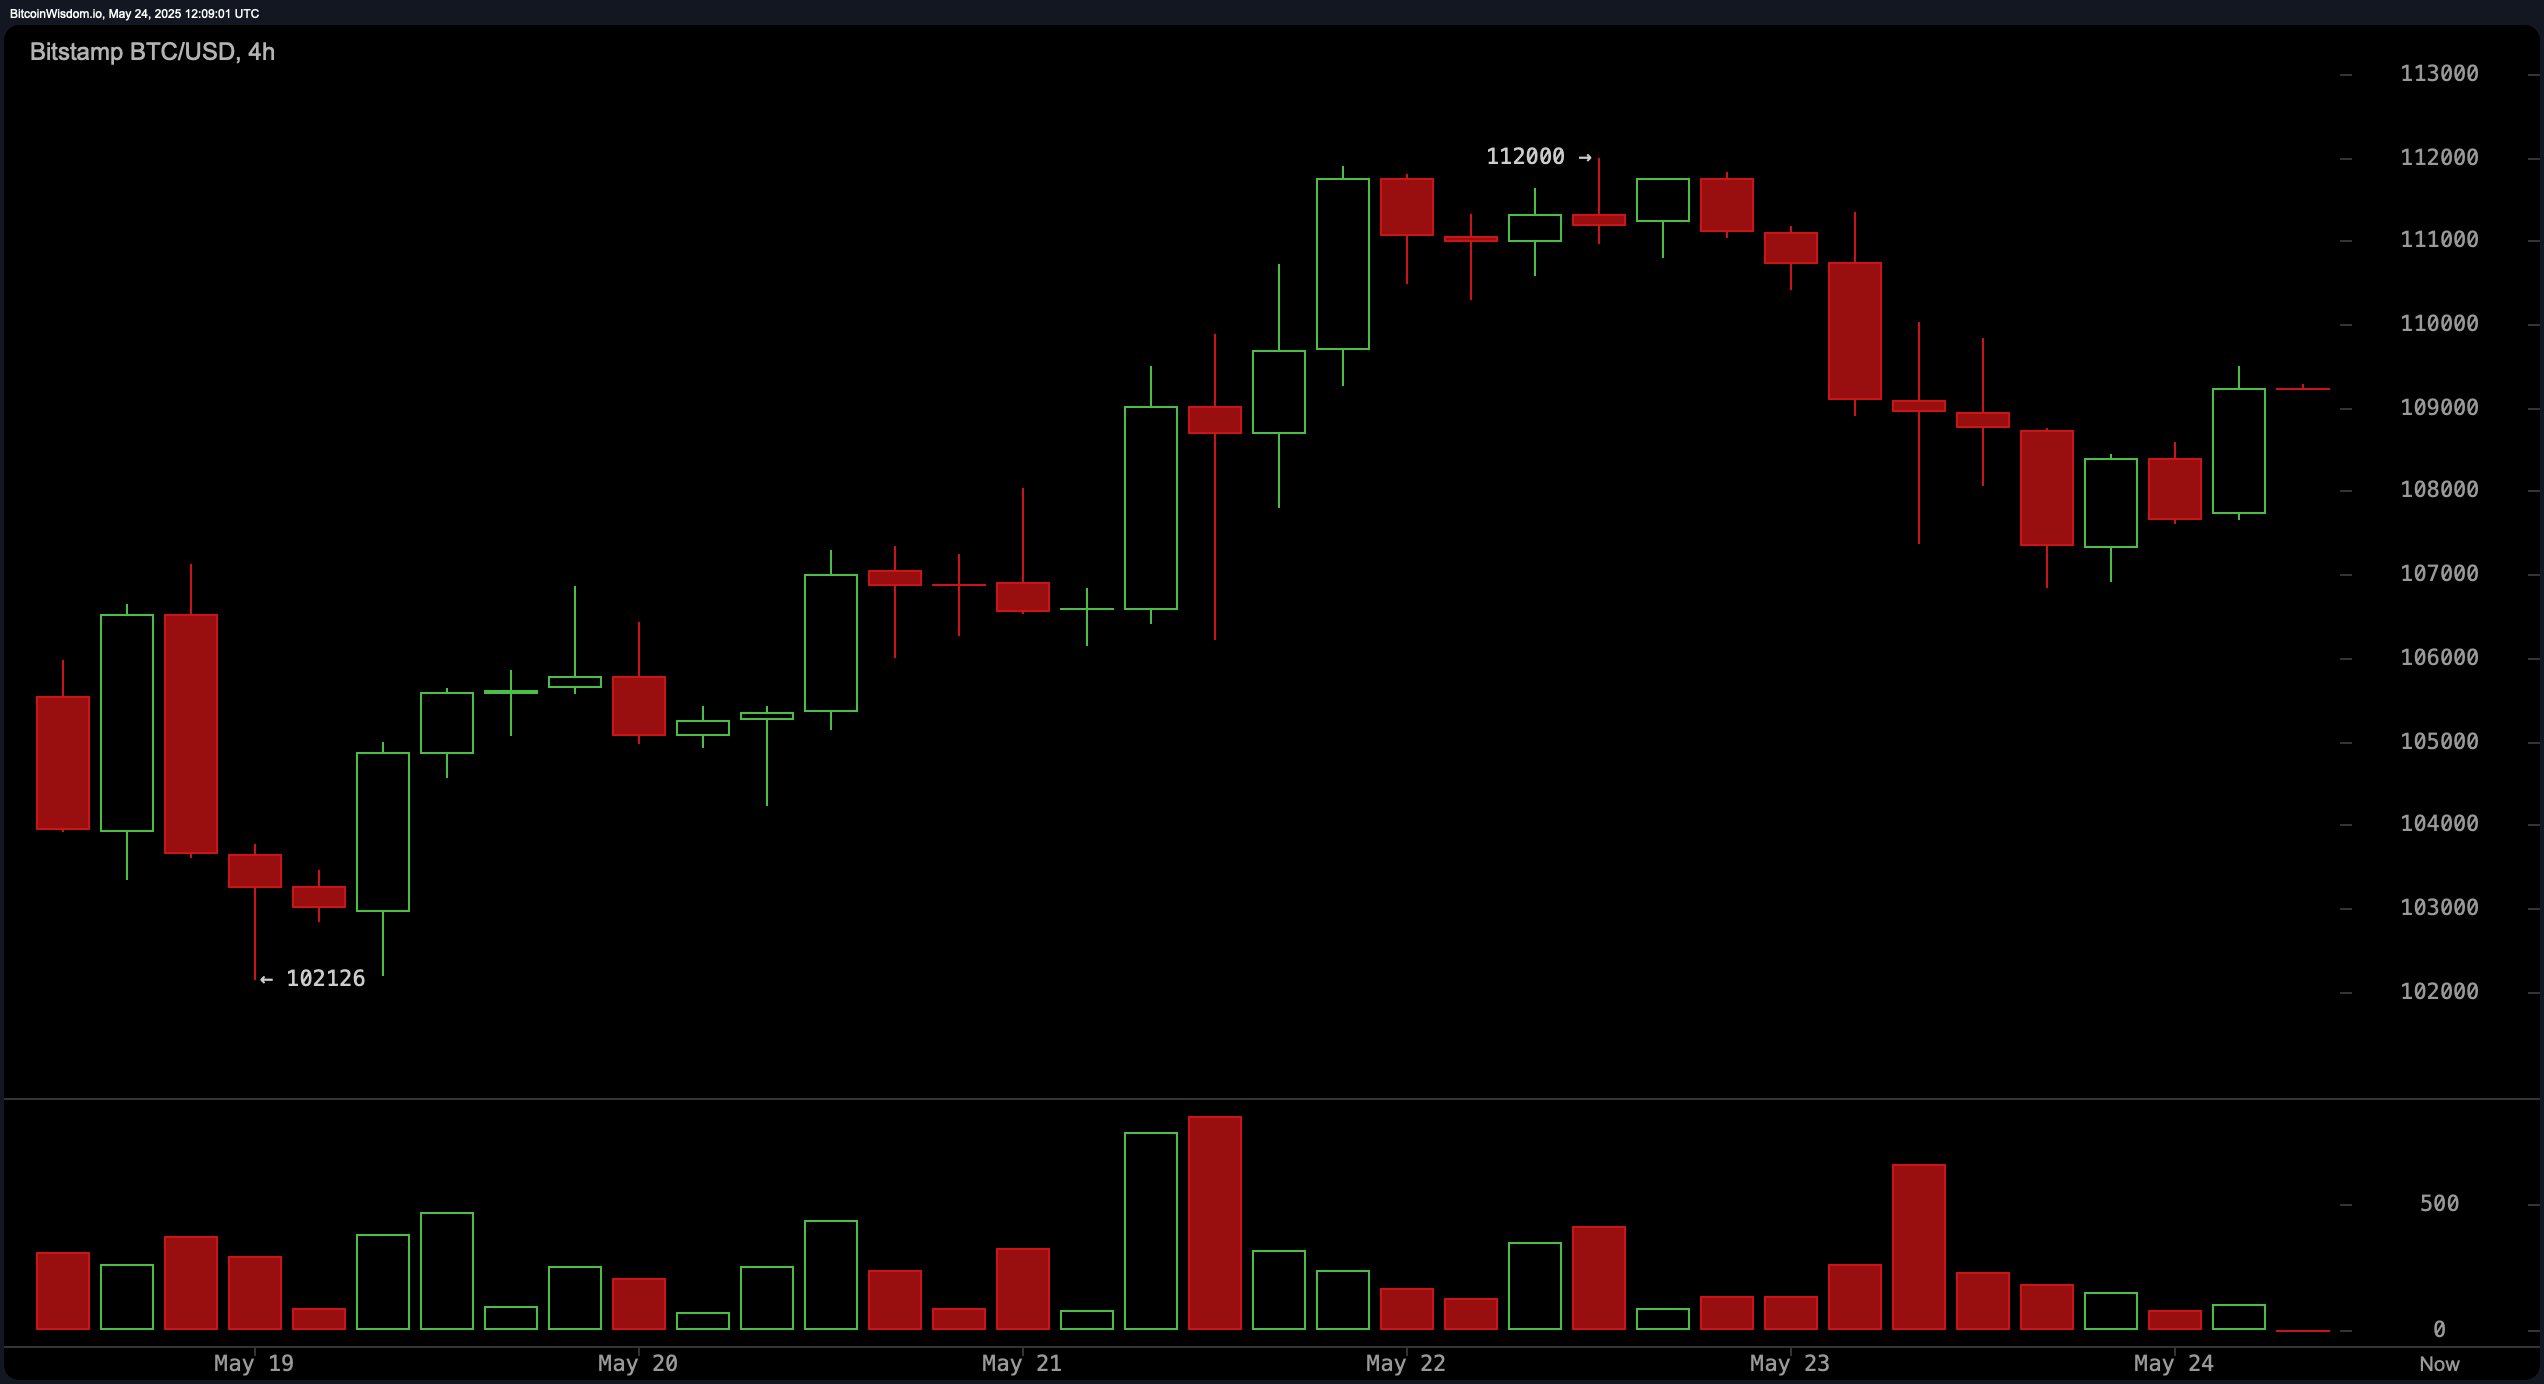
The 4-hour chart? Oh, it’s practically a novella. After peaking at $112,000, Bitcoin decided it needed some time off and retraced. But don’t be too quick to call it quits. A recovery to over $109,000 could signal a reversal—though, volume’s a bit like an apathetic extra in this show. If Bitcoin manages to close above $110,000 with a little volume flare, we might be in for a dramatic upside break. However, if it drops below $108,000 with a bit of bearish flair, expect a return to $106,000—cue the dramatic music.
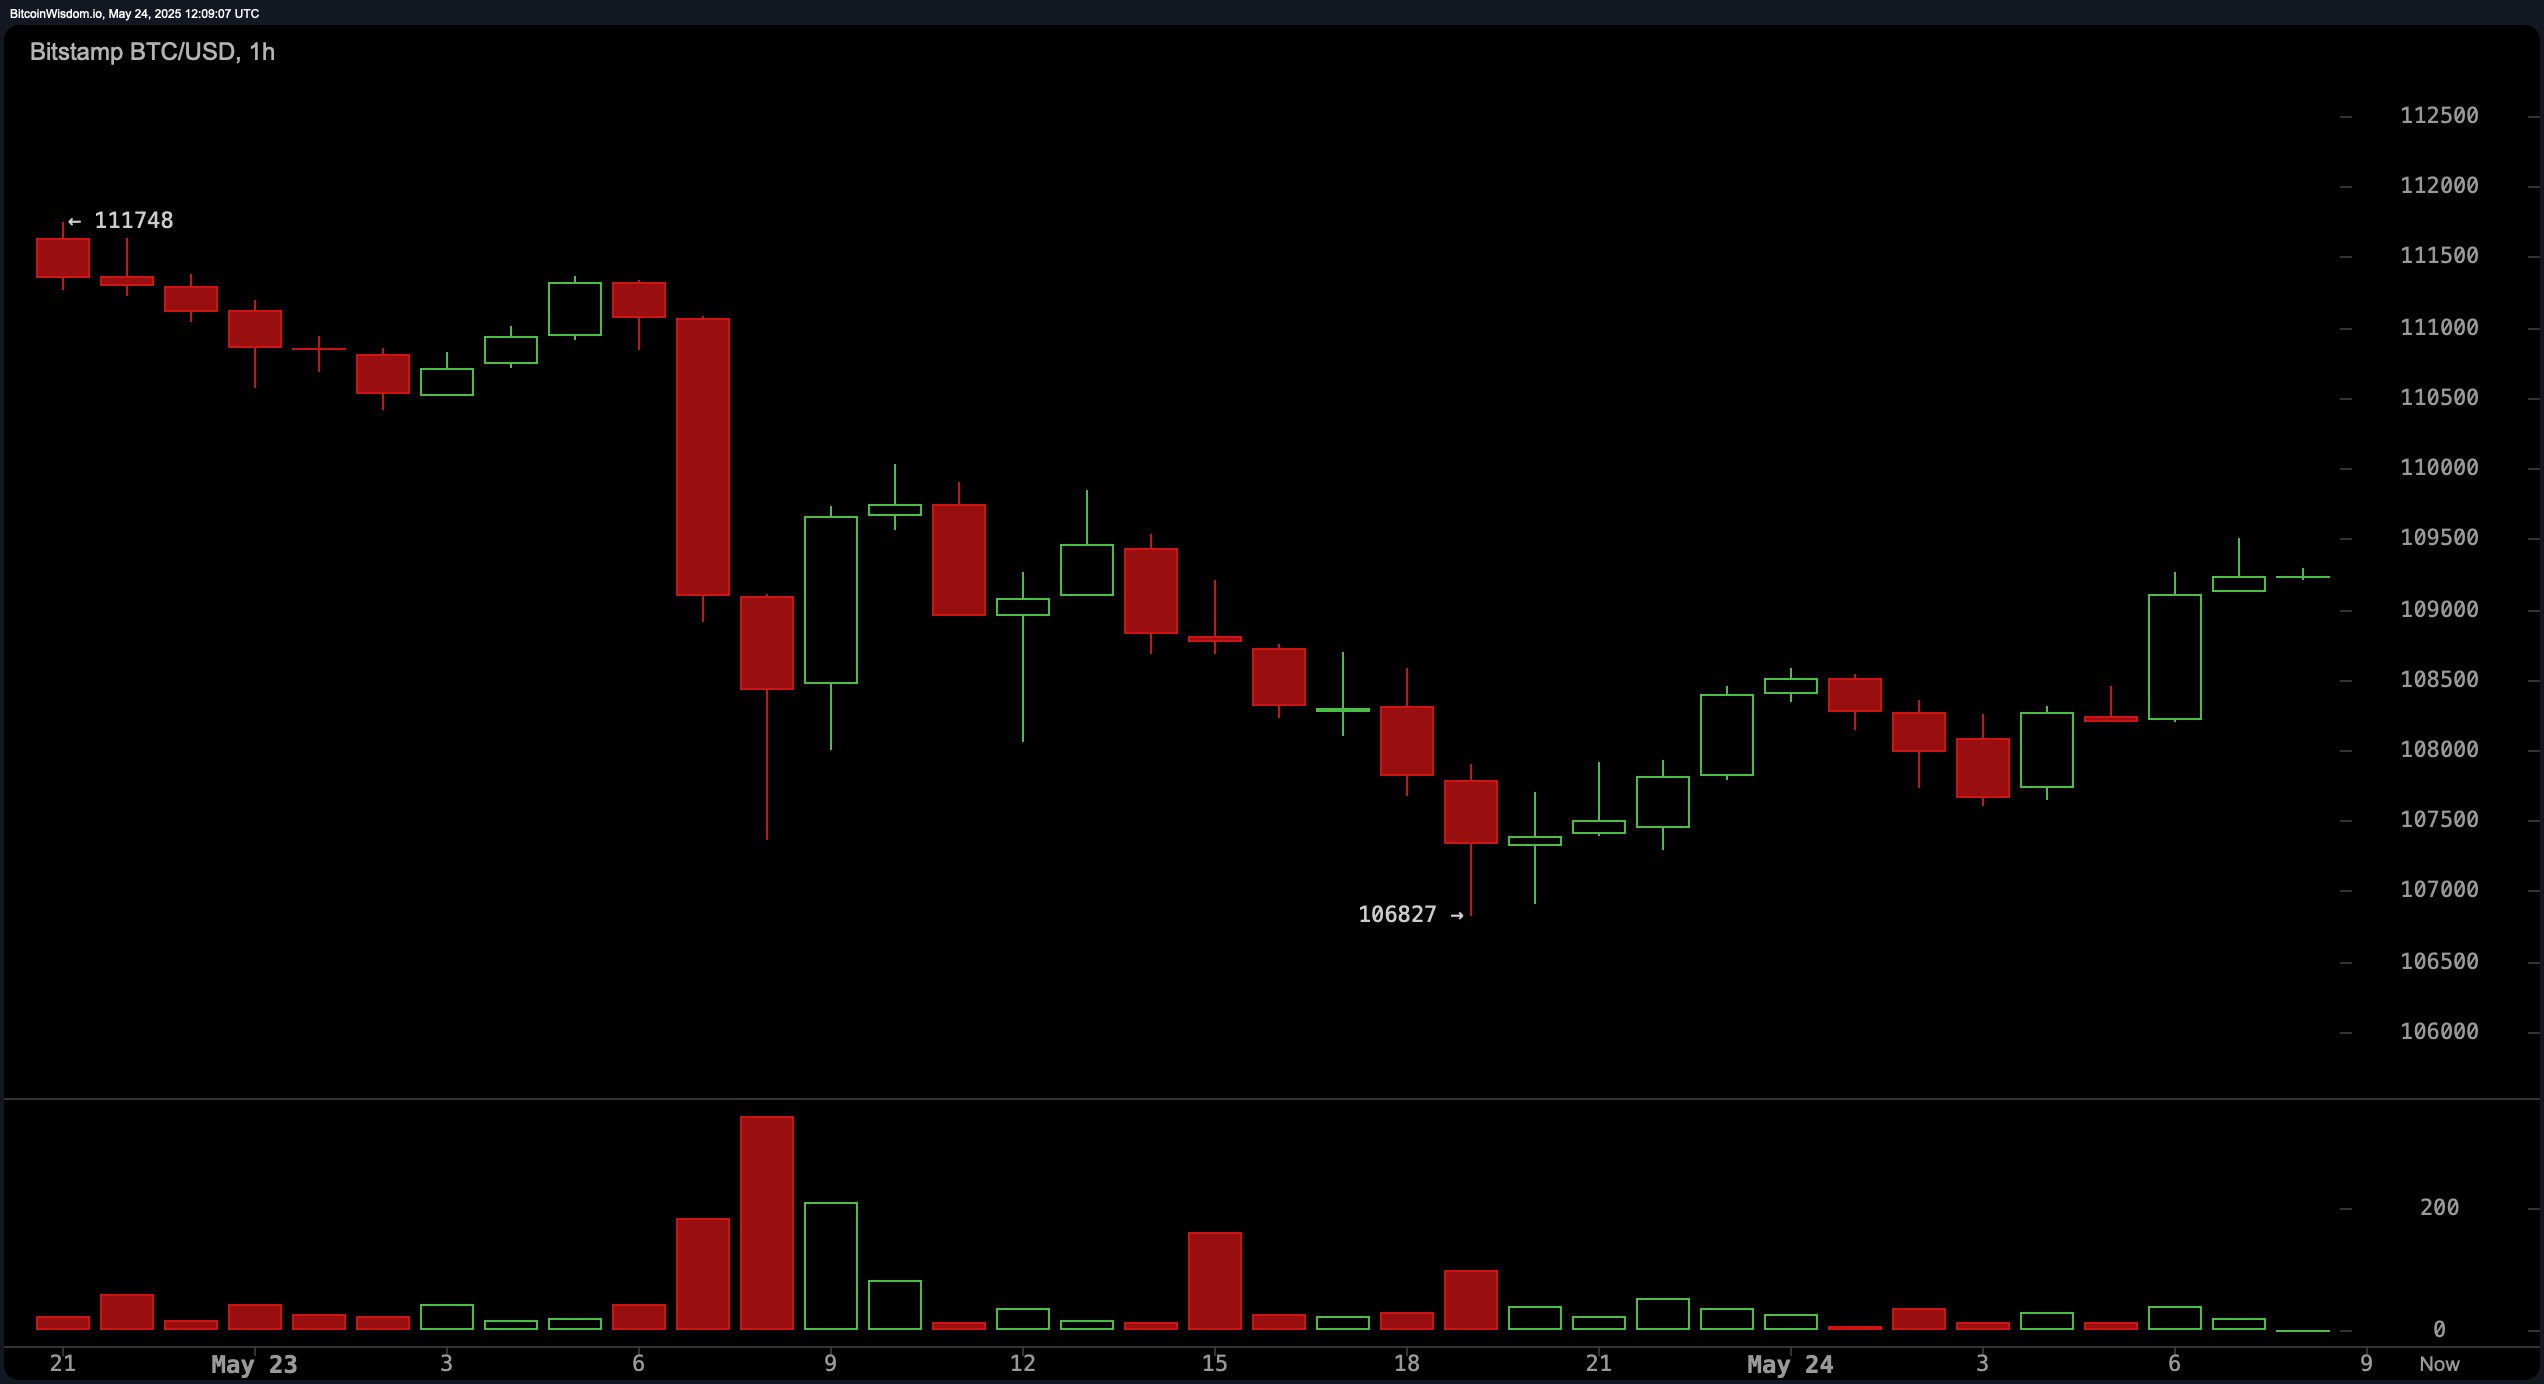
On the 1-hour chart, it’s a thrilling descent from $111,748 to $106,827, but don’t fret—it’s followed by a subtle rebound. An inverse head and shoulders pattern emerges, which sounds dramatic, but trust me, it’s all about the right shoulder. If we break out between $109,500 and $110,000, prepare for an encore. But if Bitcoin decides to dip below $108,000 with sell-side activity, the whole reversal idea might just vanish into thin air. How utterly disappointing!
Oscillators are sending us mixed signals—just like a love affair gone wrong. The Relative Strength Index (RSI) is sitting pretty at 66, Stochastic at 77, and the Average Directional Index (ADX) is serenely neutral at 33. But the momentum oscillator at 5,747 and the MACD at 4,016 are giving off a bullish vibe, while the Commodity Channel Index (CCI) at 113 is throwing a tantrum and flashing a sell signal. Classic overbought drama. The Awesome Oscillator? It’s just there, acting neutral as usual. We do appreciate a good performer.
Moving averages, bless their hearts, are still playing for Team Bull. Whether it’s the 10-period EMA at $107,056 or the 200-period EMA at $89,495, they’re all in sync, giving us a green light for growth. So, even with the occasional correction, the overall trend is unmistakably bullish. If Bitcoin manages to conquer $110,000 with volume confirmation, darling, the sky’s the limit—maybe even beyond $112,000.
Bull Verdict:
Despite all the drama, Bitcoin’s technicals remain as strong as ever. If it breaks above $110,000 with volume, we might just see a fresh push to $112,000—and beyond. The broader trend is bullish, darling, and the momentum is certainly on its side.
Bear Verdict:
But don’t get too comfortable. A slip below $108,000, especially with sell volume joining the party, could lead to a more profound pullback to $106,000 or lower. Those mixed oscillator signals and the looming resistance at $112,000—well, they’re certainly giving us something to think about.
Read More
- Clash Royale Best Boss Bandit Champion decks
- Vampire’s Fall 2 redeem codes and how to use them (June 2025)
- Mobile Legends January 2026 Leaks: Upcoming new skins, heroes, events and more
- World Eternal Online promo codes and how to use them (September 2025)
- How to find the Roaming Oak Tree in Heartopia
- Clash Royale Season 79 “Fire and Ice” January 2026 Update and Balance Changes
- Best Arena 9 Decks in Clast Royale
- Clash Royale Furnace Evolution best decks guide
- Best Hero Card Decks in Clash Royale
- FC Mobile 26: EA opens voting for its official Team of the Year (TOTY)
2025-05-24 15:57