Bitcoin waltzed into Dec. 26, 2025, slapping on a $88,630 price tag like it’s a Friday night Tinder profile pic. But behind the bling, the crypto market’s basically a nervous Nellie clutching a bag of Doritos, sweating over whether $89K is the trampoline to the stratosphere or the trapdoor to the basement. Market cap? A cool $1.76T. Trading volume? $38.17B-basically Monopoly money at this point. The real tea? The price is stuck in a tug-of-war so tight it makes Brexit negotiations look chill.
Bitcoin’s Chart: A Soap Opera 📈
The daily chart reads like a rehab diary: range-bound between $86K (the “floor of despair”) and $89.5K-$91K (the “ceiling of hope”). Our crypto hero’s been doing the sideways shuffle since plummeting from $94.65K-less “I Will Survive” and more “I Will… Maybe Sit Down.” Bulls? They’re pacing the locker room, stretching like they’re waiting for a bus that might never come.
Volume’s ticking up, sure, but only when the candles turn red-aka when the bears throw a tantrum. Without a breakout above $89.5K that screams “I MEAN BUSINESS,” this rally’s about as convincing as a vegan convincing a steakhouse crowd.

Zoom into the 4-hour chart and it’s a “recovery” crawling out of a $90,536-$86,363 crater. The bounce? Hopeful but sluggish-like a sloth on Ambien. Volume during the fall? Titanic. Volume during the rise? A polite cough. This isn’t a bull run; it’s a timid toe-dip while the bears play Jaws on repeat. If BTC clings to $88.8K-$89K, maybe-maybe-we’ll get a Disney moment. But don’t uncork the bubbly yet. 🍾

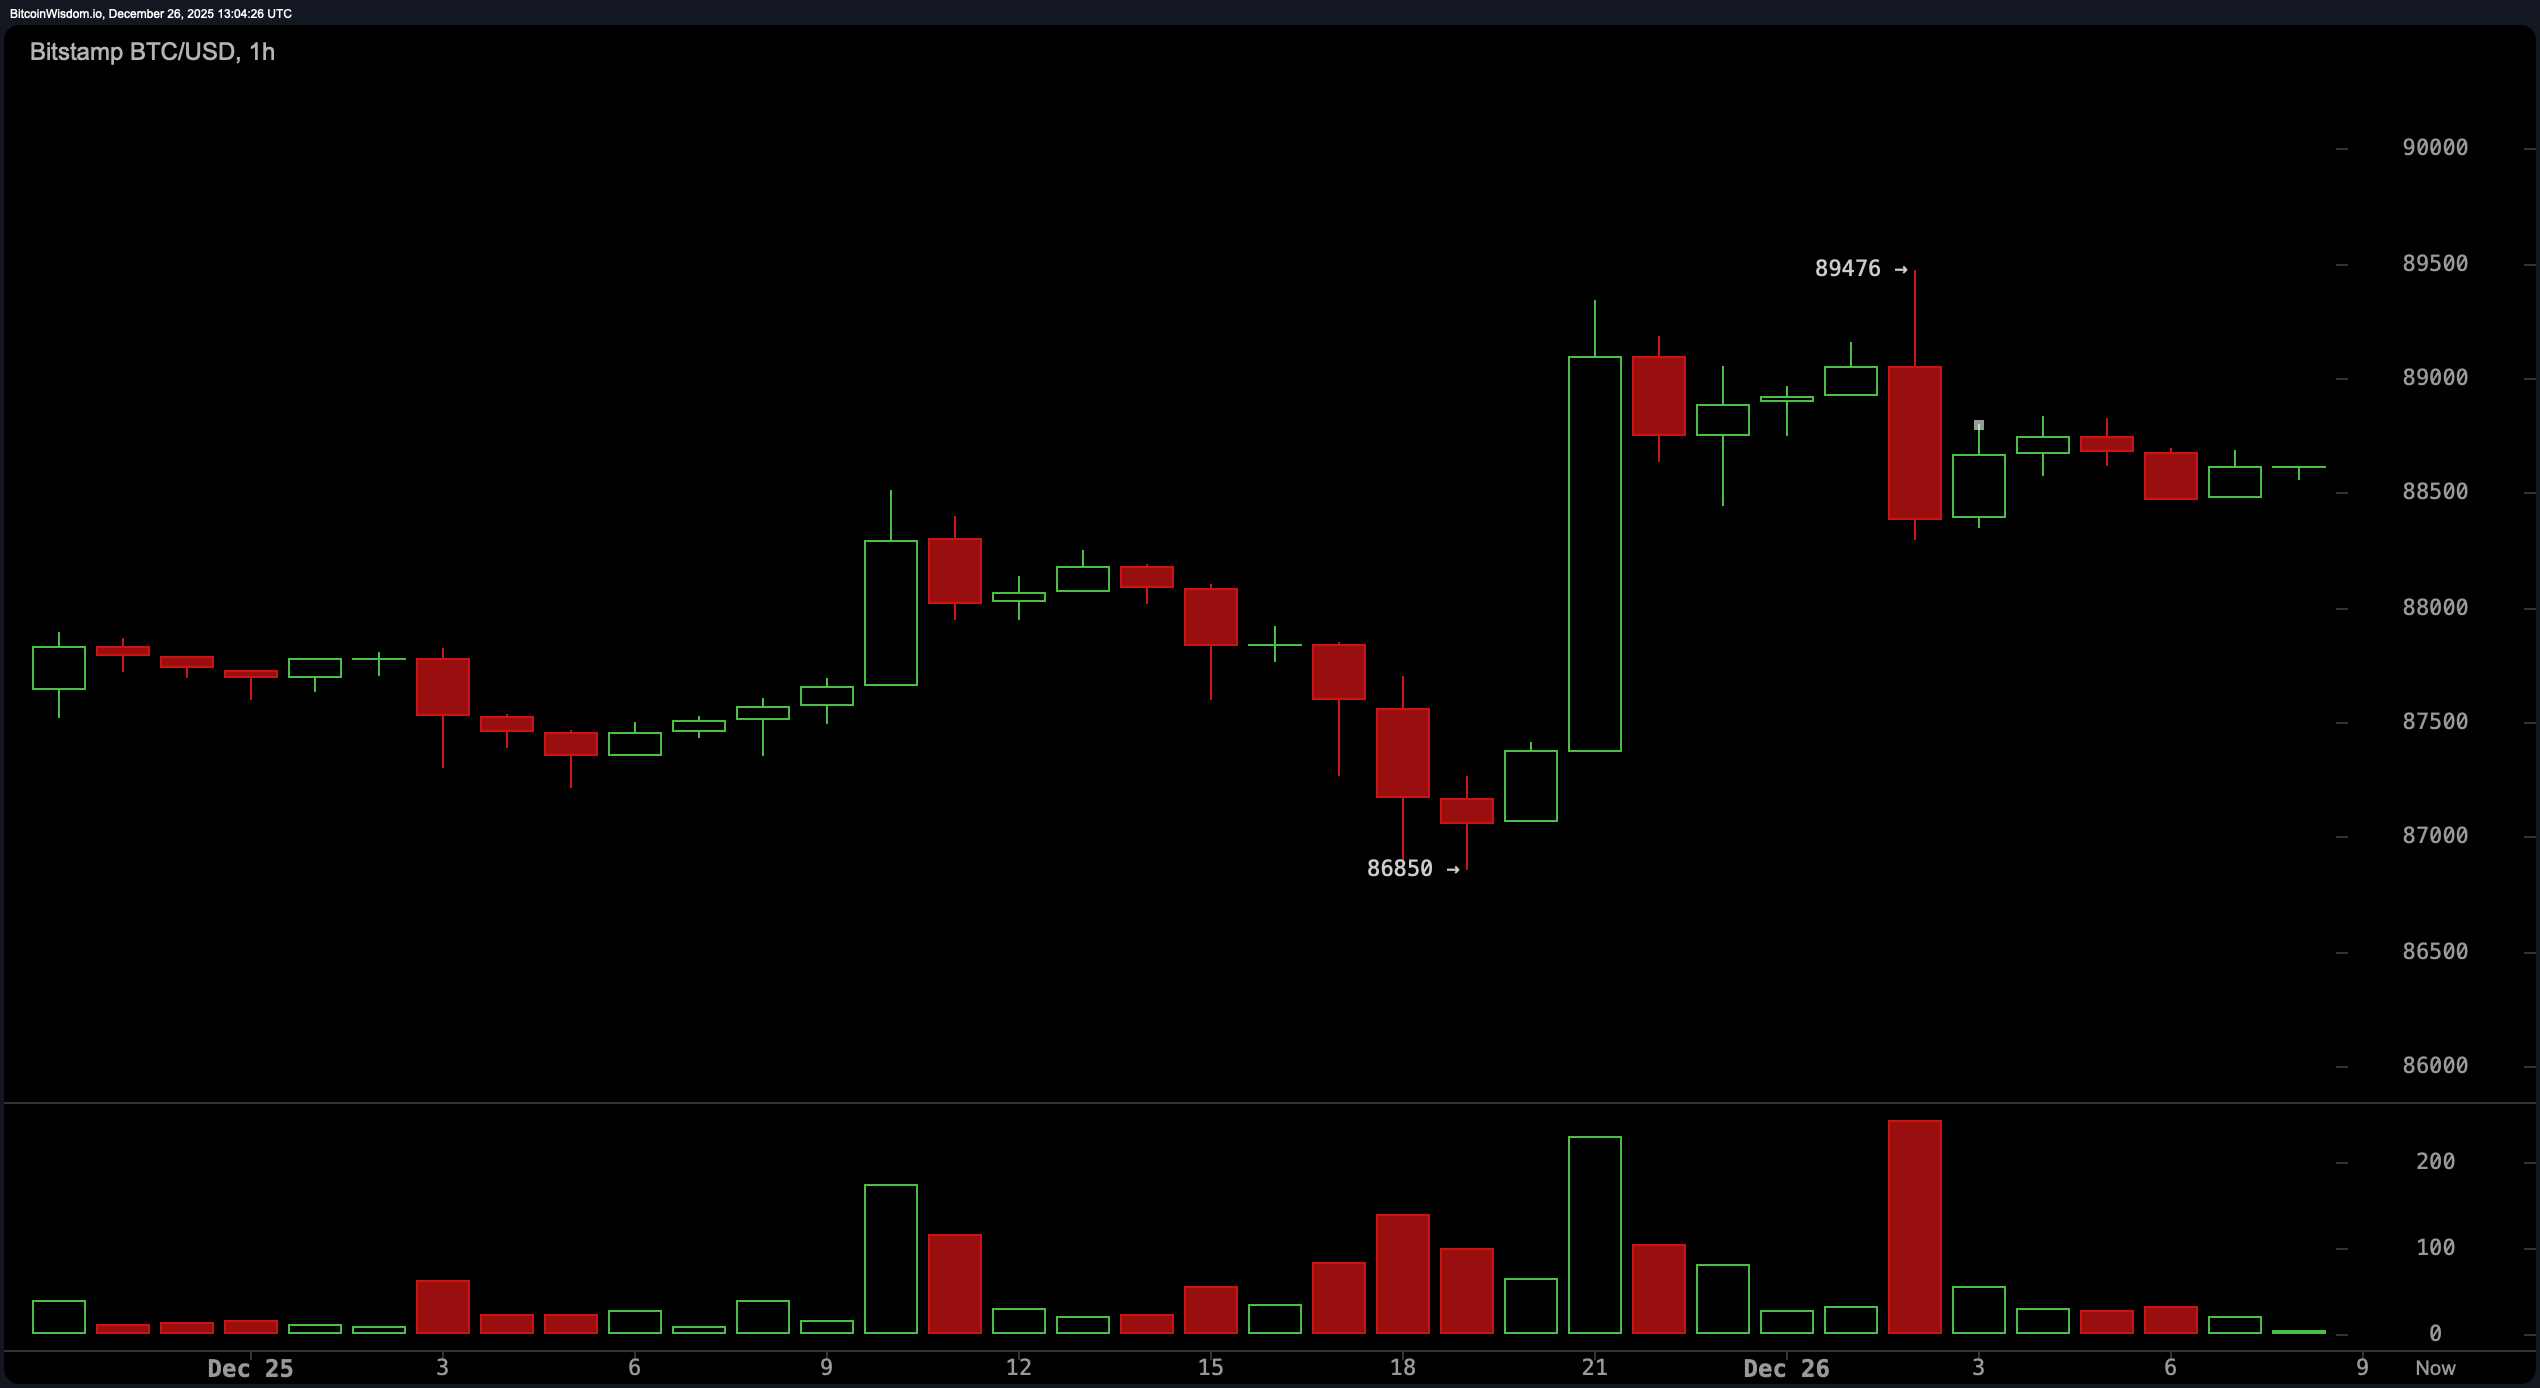
Check the 1-hour chart and the short-term crowd’s cheering a rebound from $86,850 to $89,476-followed by a pullback that’s almost romantic. A bullish engulfing candle? Cute. But without volume, it’s just “hopium” with a bowtie. Micro support at $88,500 is the last life preserver, while $89,500 looms like a final boss. Break above it? $90,500’s the next pit stop. Fail? Brace for a slide faster than a toddler on a Slip ‘N Slide. 🛑
Oscillators? More confused than a chameleon in a bag of Skittles. RSI at 47, Stochastic at 45, CCI at -27-their vibe is “meh.” ADX at 21? Basically napping. Awesome Oscillator’s -1,291 says “yawn,” while MACD’s -1,209 is like a shrug emoji 🤷♂️. Verdict? The market’s playing poker with a blank expression. Bluff or royal flush? No clue.
Moving Averages? They’re the ex who still owes you money. Short-term EMAs/SMA love $88K-$87.6K, but the long-term crew’s all red flags down to $107.5K. Trend? What trend? This isn’t a friend zone-it’s a friend zone with a restraining order.
In short: Bitcoin’s stuck in a chess game with its own momentum. Short-term optimists? They’re like kids peering into a candy store. Long-term? The bears are sharpening their knives and their Twitter bios. 🗡️
Bull Verdict:
Crack $89.5K with volume that screams “I’M SERIOUS,” and BTC zooms to $94K like a caffeinated squirrel. 1-hour chart’s bullish vibes, perky MAs, and MACD’s timid nod up? Bulls might charge-if they can find their horns. 🦍
Bear Verdict:
Fail the $89.5K test and BTC’s diving to $86K faster than a politician avoiding taxes. With MAs heading south and oscillators yawning, the rally’s about as sturdy as a gluten-free gingerbread house. 🏚️
FAQ ❓
- What’s Bitcoin’s price today?
$88,630 as of Dec. 26, 2025. Basically the crypto version of “I’m fine, I swear.” - Key resistance?
$89.500-the glass ceiling even Cinderella couldn’t shatter. - Support zone?
$86K-$86.5K. The last slice of bread in the toaster. - Up or down trend?
Sideways with commitment issues. Think “it’s complicated” on Facebook. 🤐
Read More
- Clash Royale Best Boss Bandit Champion decks
- Vampire’s Fall 2 redeem codes and how to use them (June 2025)
- World Eternal Online promo codes and how to use them (September 2025)
- How to find the Roaming Oak Tree in Heartopia
- Mobile Legends January 2026 Leaks: Upcoming new skins, heroes, events and more
- Best Arena 9 Decks in Clast Royale
- ATHENA: Blood Twins Hero Tier List
- Clash Royale Furnace Evolution best decks guide
- Brawl Stars December 2025 Brawl Talk: Two New Brawlers, Buffie, Vault, New Skins, Game Modes, and more
- What If Spider-Man Was a Pirate?
2025-12-26 17:34