Bitcoin‘s been doing its best impression of a teenager trying to find their way in life – all moody and confined within a very strict range, stuck between the 100 and 200-day moving averages. It’s like that awkward phase, you know? But guess what? It’s showing some early signs of life – just a little spark, but enough to get the crypto gossip going. So, will this “mild recovery” turn into a full-blown love affair, or is it just another brief fling? 🧐
Technical Analysis (aka: Let’s Look at Some Charts)
By Shayan (Crypto’s favorite fortune teller)
The Daily Chart (aka: BTC’s Daily Drama)
So, on the daily chart, Bitcoin is still stuck in its comfort zone, trapped like that friend who just can’t decide whether to stay in or go out. The 200-day moving average is sitting pretty near $109K, playing the role of solid support – like the friend who always picks up the tab. Meanwhile, the 100-day MA is acting like the friend who insists on wearing something weird and stands at $115K, blocking the exit. The $108K zone? That’s where the demand is, like the best pizza place in town. 🍕
The recent rebound from $108K is cute, but the real drama is at the $115K-$116K level. That’s where the bulls get their first real test – a test of strength, courage, and maybe even a bit of luck. If they push through this, we could see a run for $120K-$122K, and if we’re feeling really spicy, maybe even a revisit of the $126K all-time high. 🎉
But, if Bitcoin gets knocked back from the 100-day MA? Prepare for a serious emotional rollercoaster and a potential drop back to $108K. I’m talking less “feel good movie” and more “plot twist that no one saw coming.” 🎬
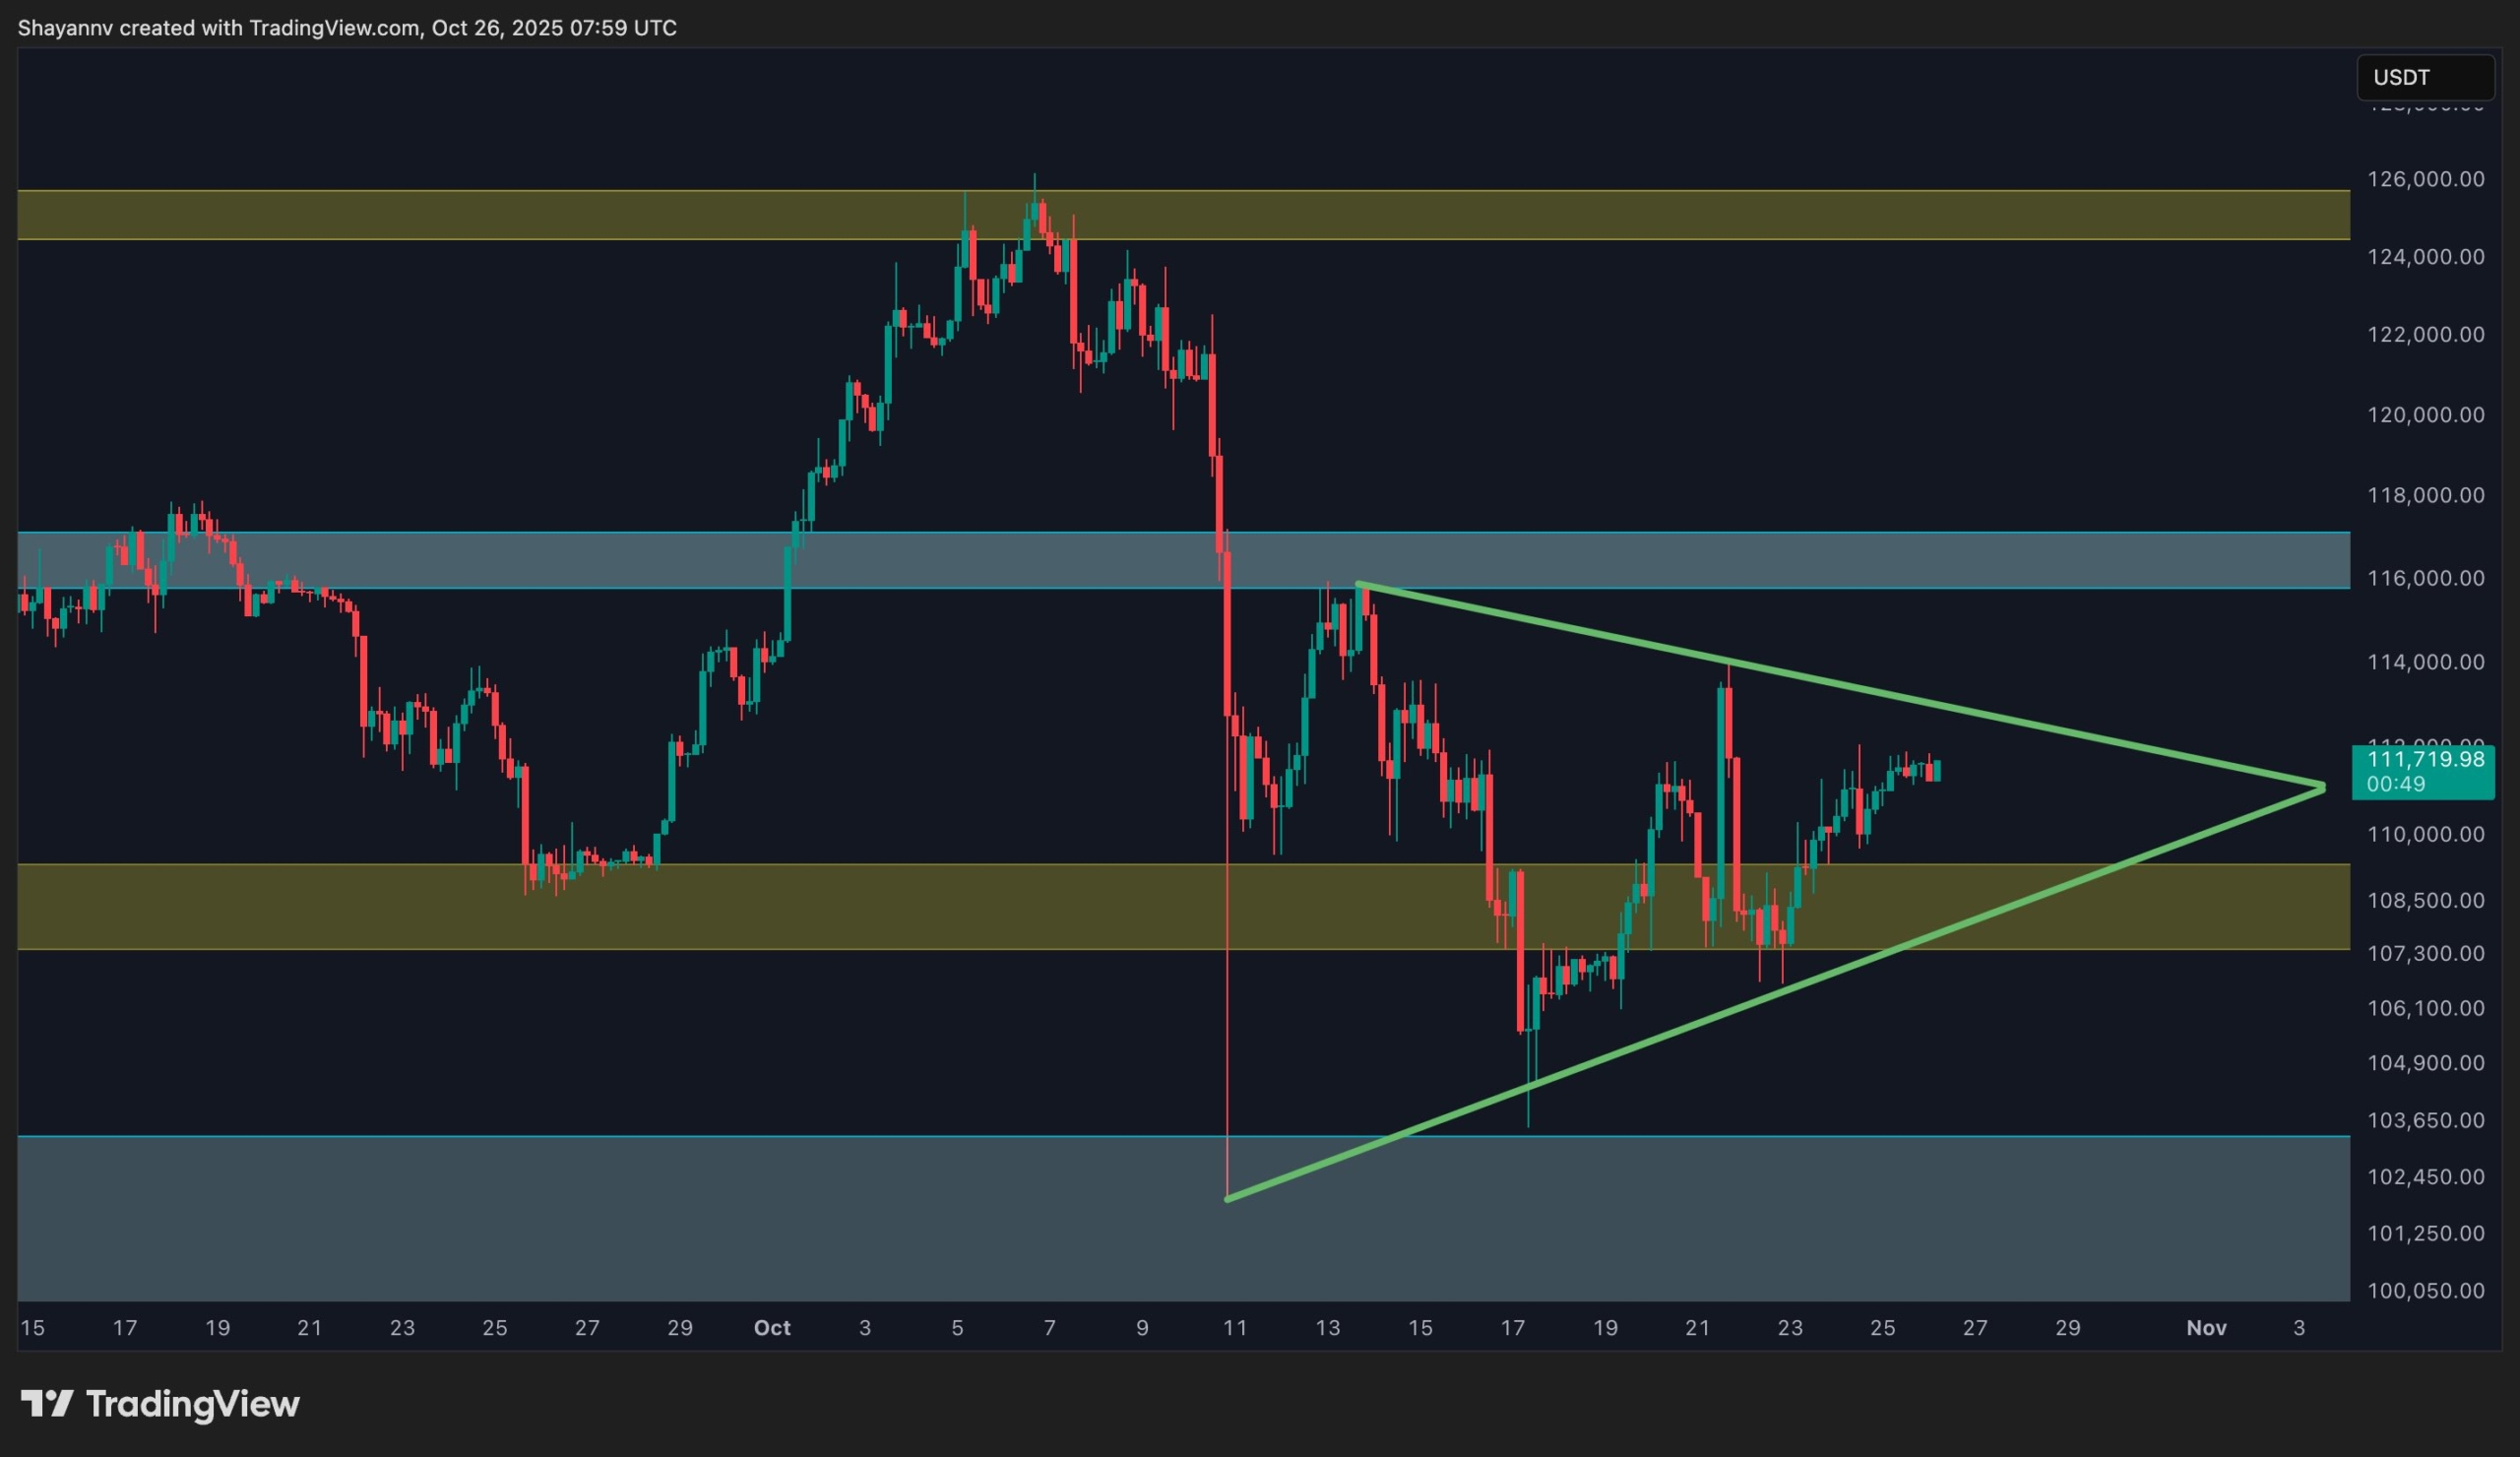
The 4-Hour Chart (aka: BTC’s Short-Term Fling)
The 4-hour chart? Oh, it’s like a game of “will they won’t they” between Bitcoin and its upper trendline. There’s some action here, people. Bitcoin’s making a move from the $102K-$104K demand zone like a desperate person checking their DMs. It’s forming a symmetrical triangle (no, not the geometric kind – that would be too easy), which usually leads to either a big breakout or a facepalm moment. We’re watching this one closely. ⏳
If Bitcoin finally breaks above the upper trendline, we might see that sweet $120K-$122K zone. But if it doesn’t? Yeah, don’t hold your breath – we could be back to the dreaded $108K zone. And no one likes that place. 😬
But hey, momentum’s still in the game, though fragile, like a soap opera character’s love life. Time for some decisions, folks. Is this a breakout moment? Or just another cliffhanger?
On-chain Analysis (aka: The Crypto Crystal Ball)
By Shayan (Now we’re getting to the juicy stuff)
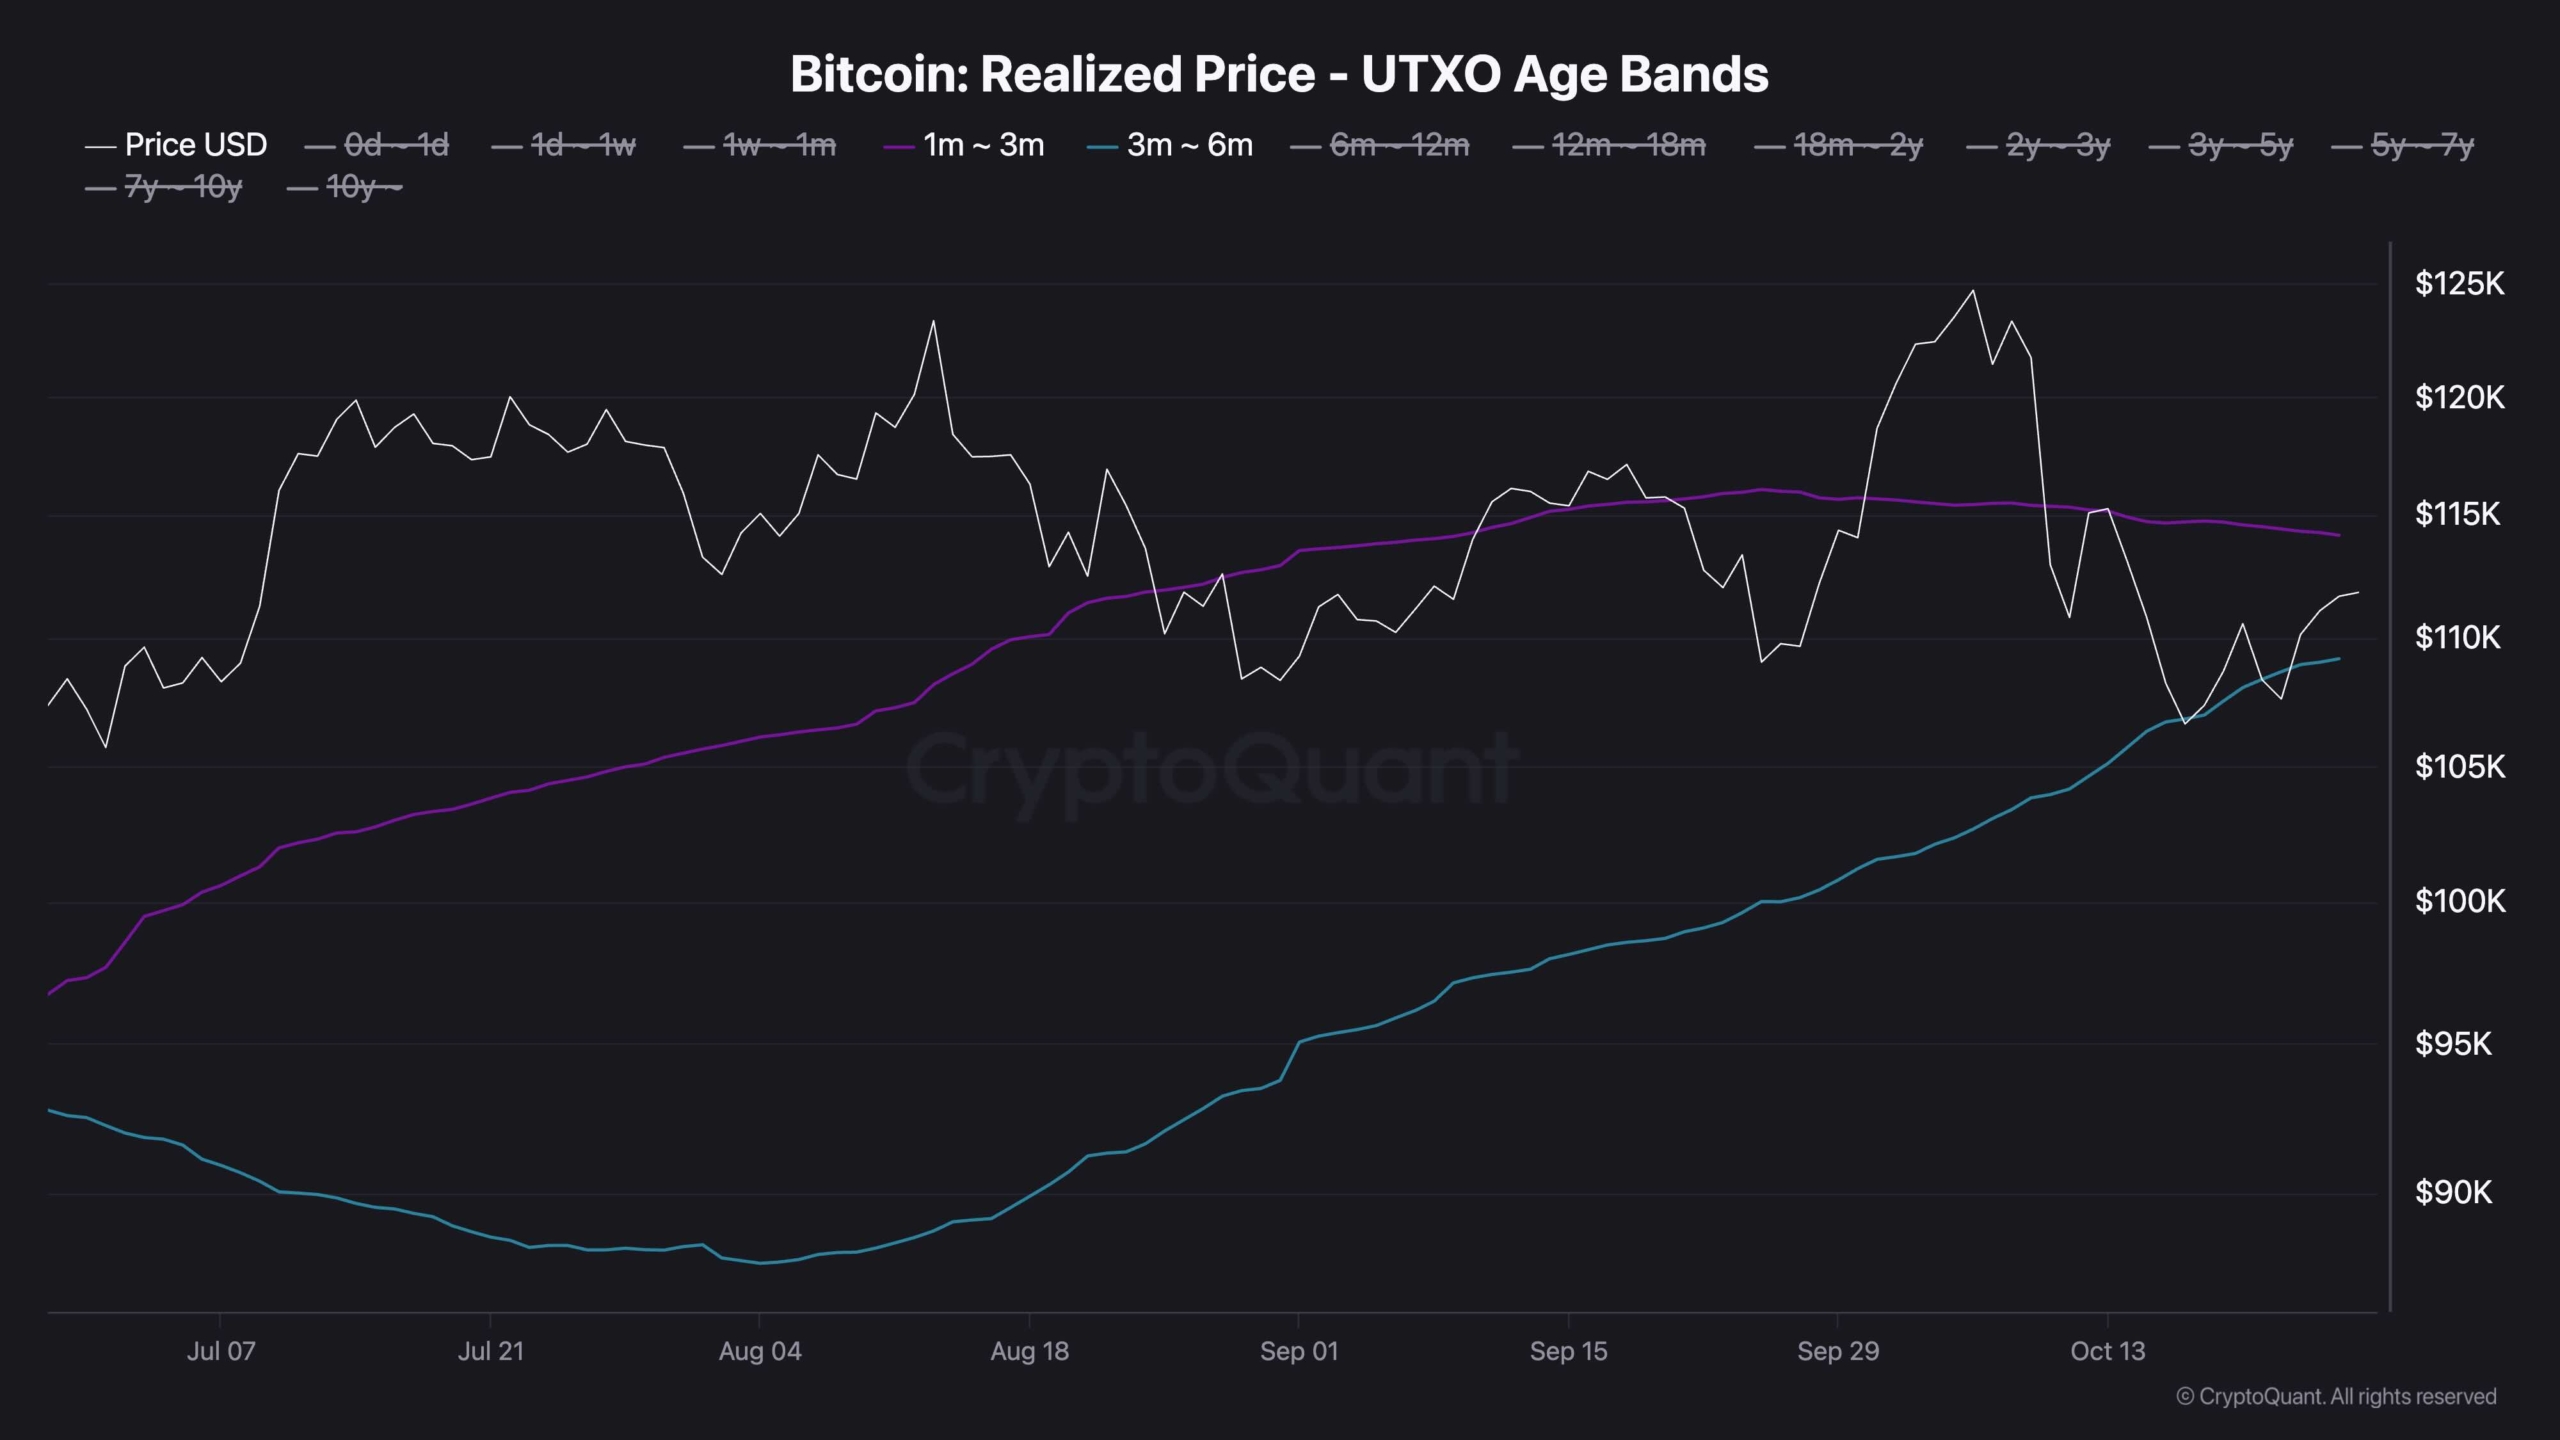
The Realized Price of mid-term holders (3-6 months) is playing a starring role in this drama. This number is like the mood ring of Bitcoin – it’s either blue (support) or red (resistance), depending on how you look at it. It gives us a glimpse into the emotions of Bitcoin’s mid-term holders – are they happy? Sad? Just meh? 🧐
Bitcoin’s recent move from $102K has made mid-term holders slightly profitable, so the selling pressure has cooled off a little. Imagine your friend who just got a new job and is finally paying rent on time. Things are looking up. If Bitcoin holds above the $114K level, the mid-term holders will be dancing in the streets – or at least in the crypto forums. But, if Bitcoin drops below it? Get ready for a whole lot of second-guessing and a potential correction. Cue dramatic music. 🎶
Read More
- Clash Royale Best Boss Bandit Champion decks
- Vampire’s Fall 2 redeem codes and how to use them (June 2025)
- Mobile Legends January 2026 Leaks: Upcoming new skins, heroes, events and more
- Clash Royale Furnace Evolution best decks guide
- M7 Pass Event Guide: All you need to know
- Clash of Clans January 2026: List of Weekly Events, Challenges, and Rewards
- Best Arena 9 Decks in Clast Royale
- Clash Royale Season 79 “Fire and Ice” January 2026 Update and Balance Changes
- World Eternal Online promo codes and how to use them (September 2025)
- Clash Royale Witch Evolution best decks guide
2025-10-26 14:22