As the digital world twirls around its fragmented pixels, Bitcoin teeters at $68,577 on April 1, 2026, with a market cap hovering around the astounding $1.37 trillion. Oh, the drama of numbers! Trading volume sighs at a modest $53.39 billion. The currency of kings? Maybe, but today it seems more like a sullen monarch confined to its chambers. The price wavers in a humble $66,218 to $69,135 range-like a guest who refuses to leave the party, neither at the top nor the bottom. A true dance of the stagnant!
Bitcoin Chart Outlook
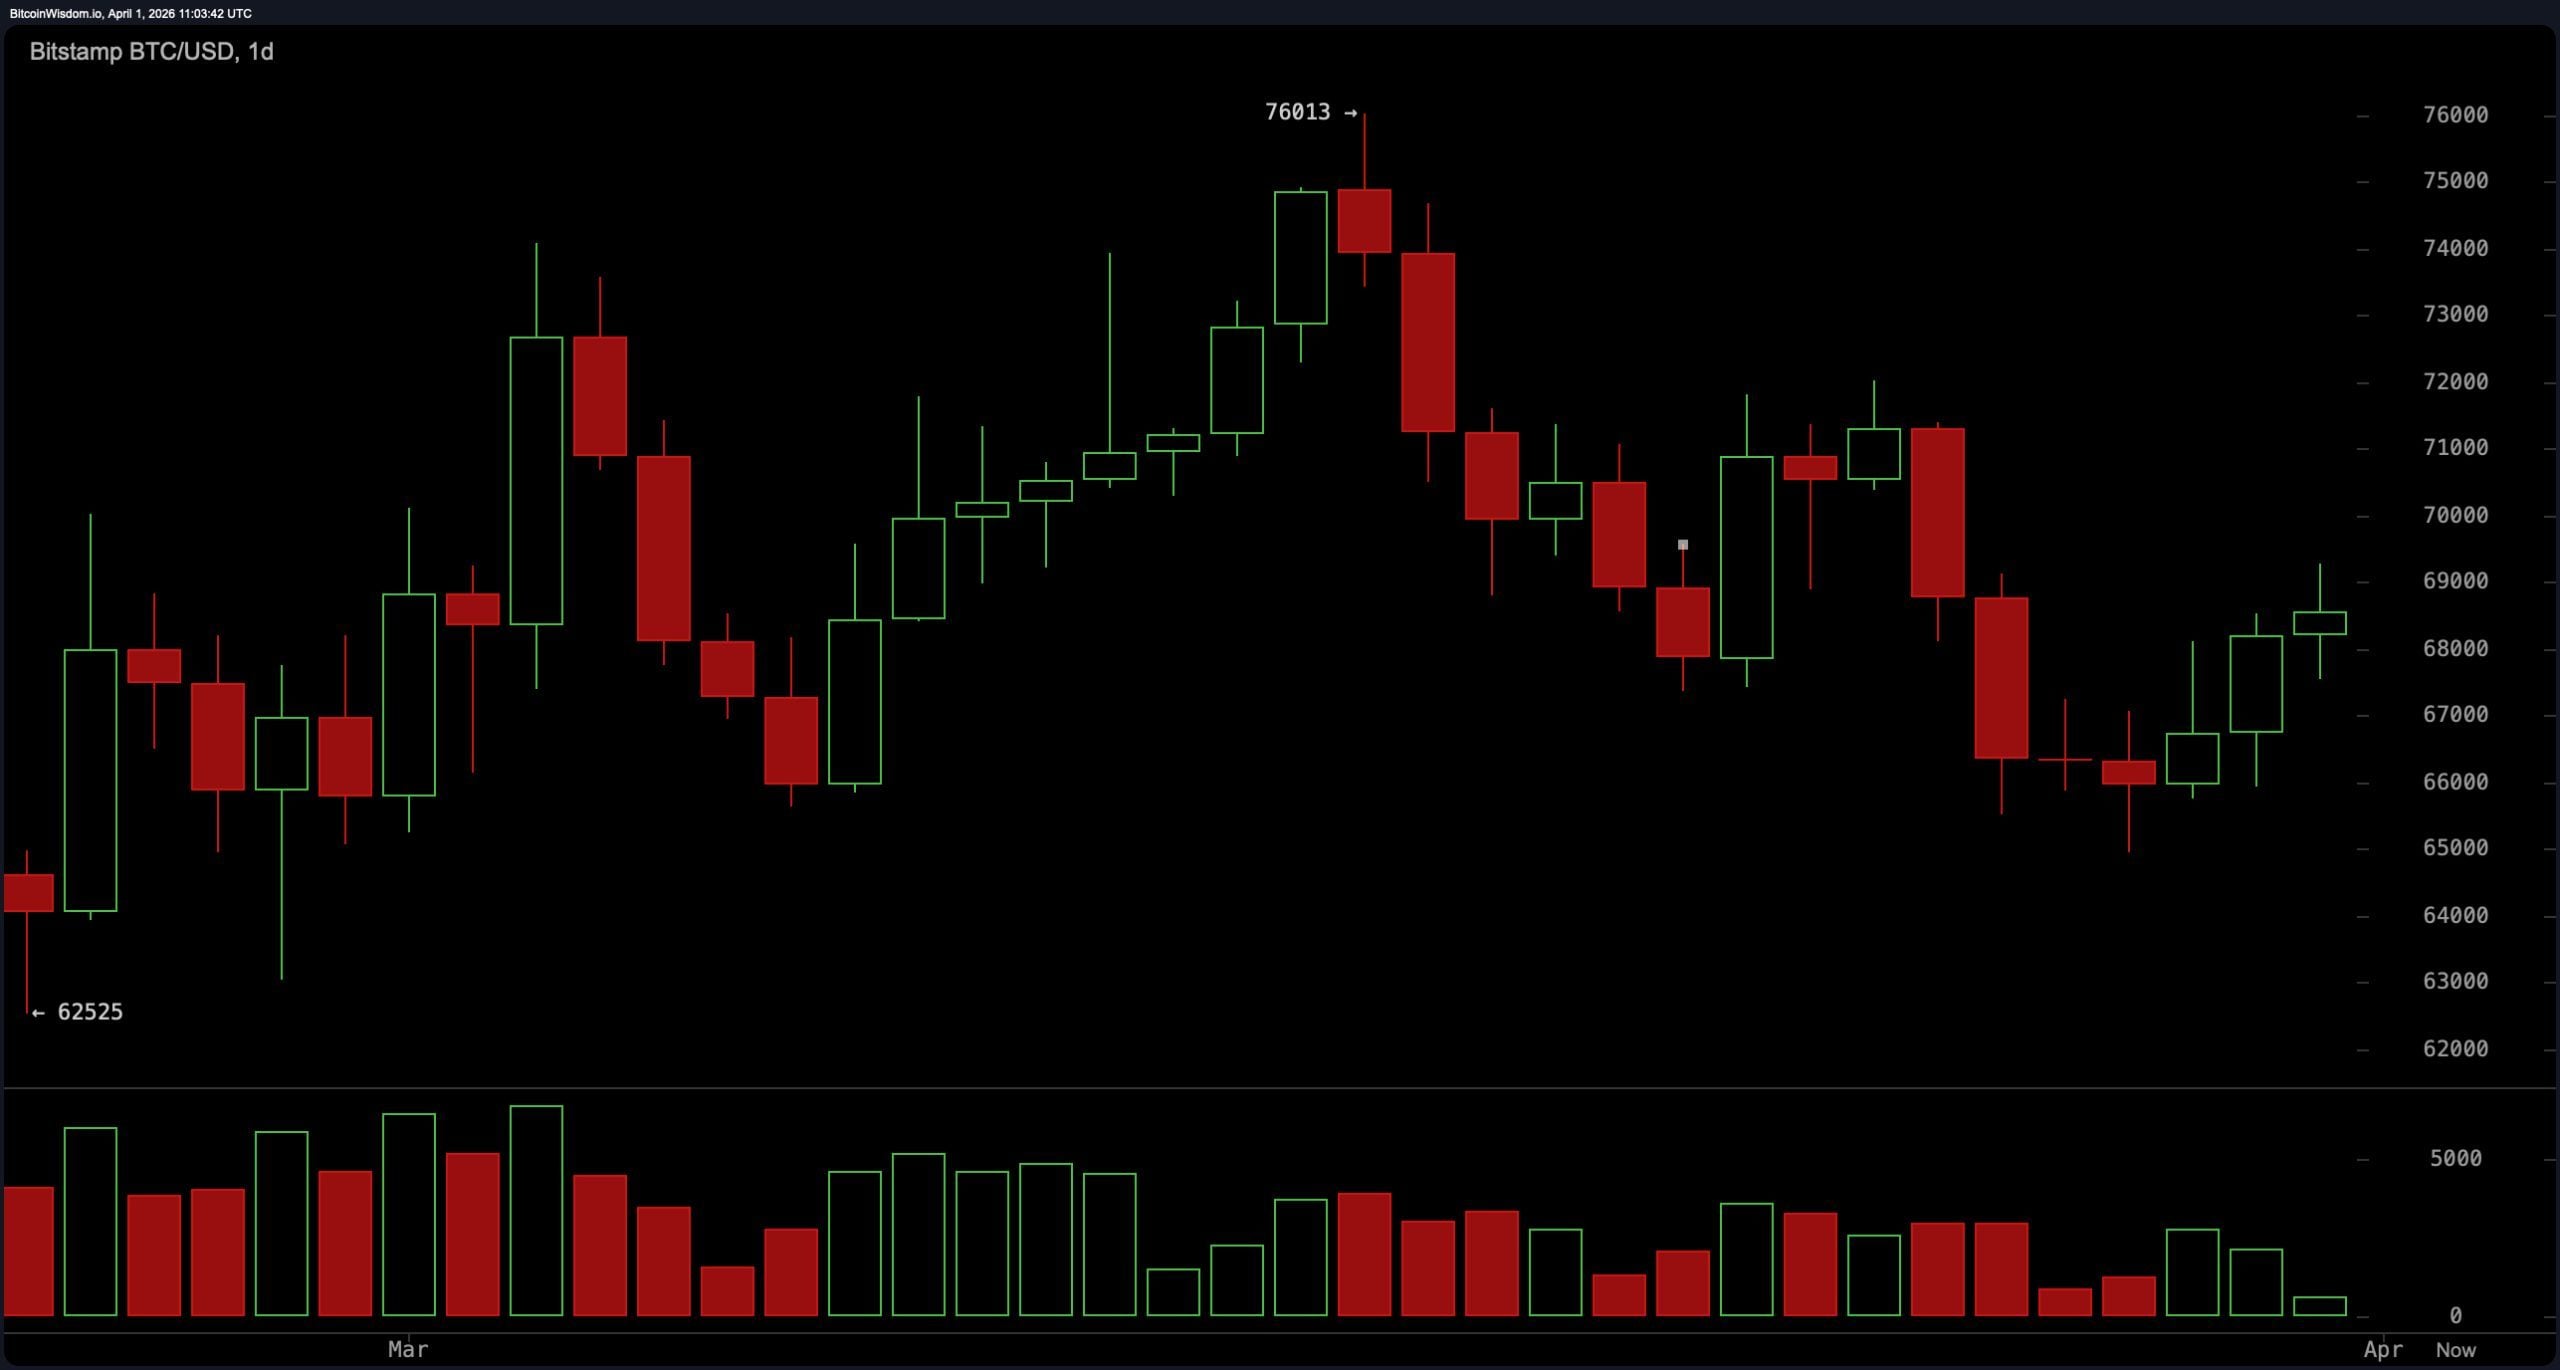
Bitcoin, ever the cryptic creature, has shackled itself within the cage of the daily chart, clinging desperately to a range without a hint of rebellion. Resistance at $69,135 is like an invisible wall, while support at $66,218 acts as a comforting, yet useless, cushion. The range? Oh, it’s a tight one, an all-too-comfortable trap for those hoping for fireworks. But no, dear reader, Bitcoin simply refuses to move with any conviction. It has become the market’s greatest enigma-paused, not progressing. If only the digital coin could show some nerve.
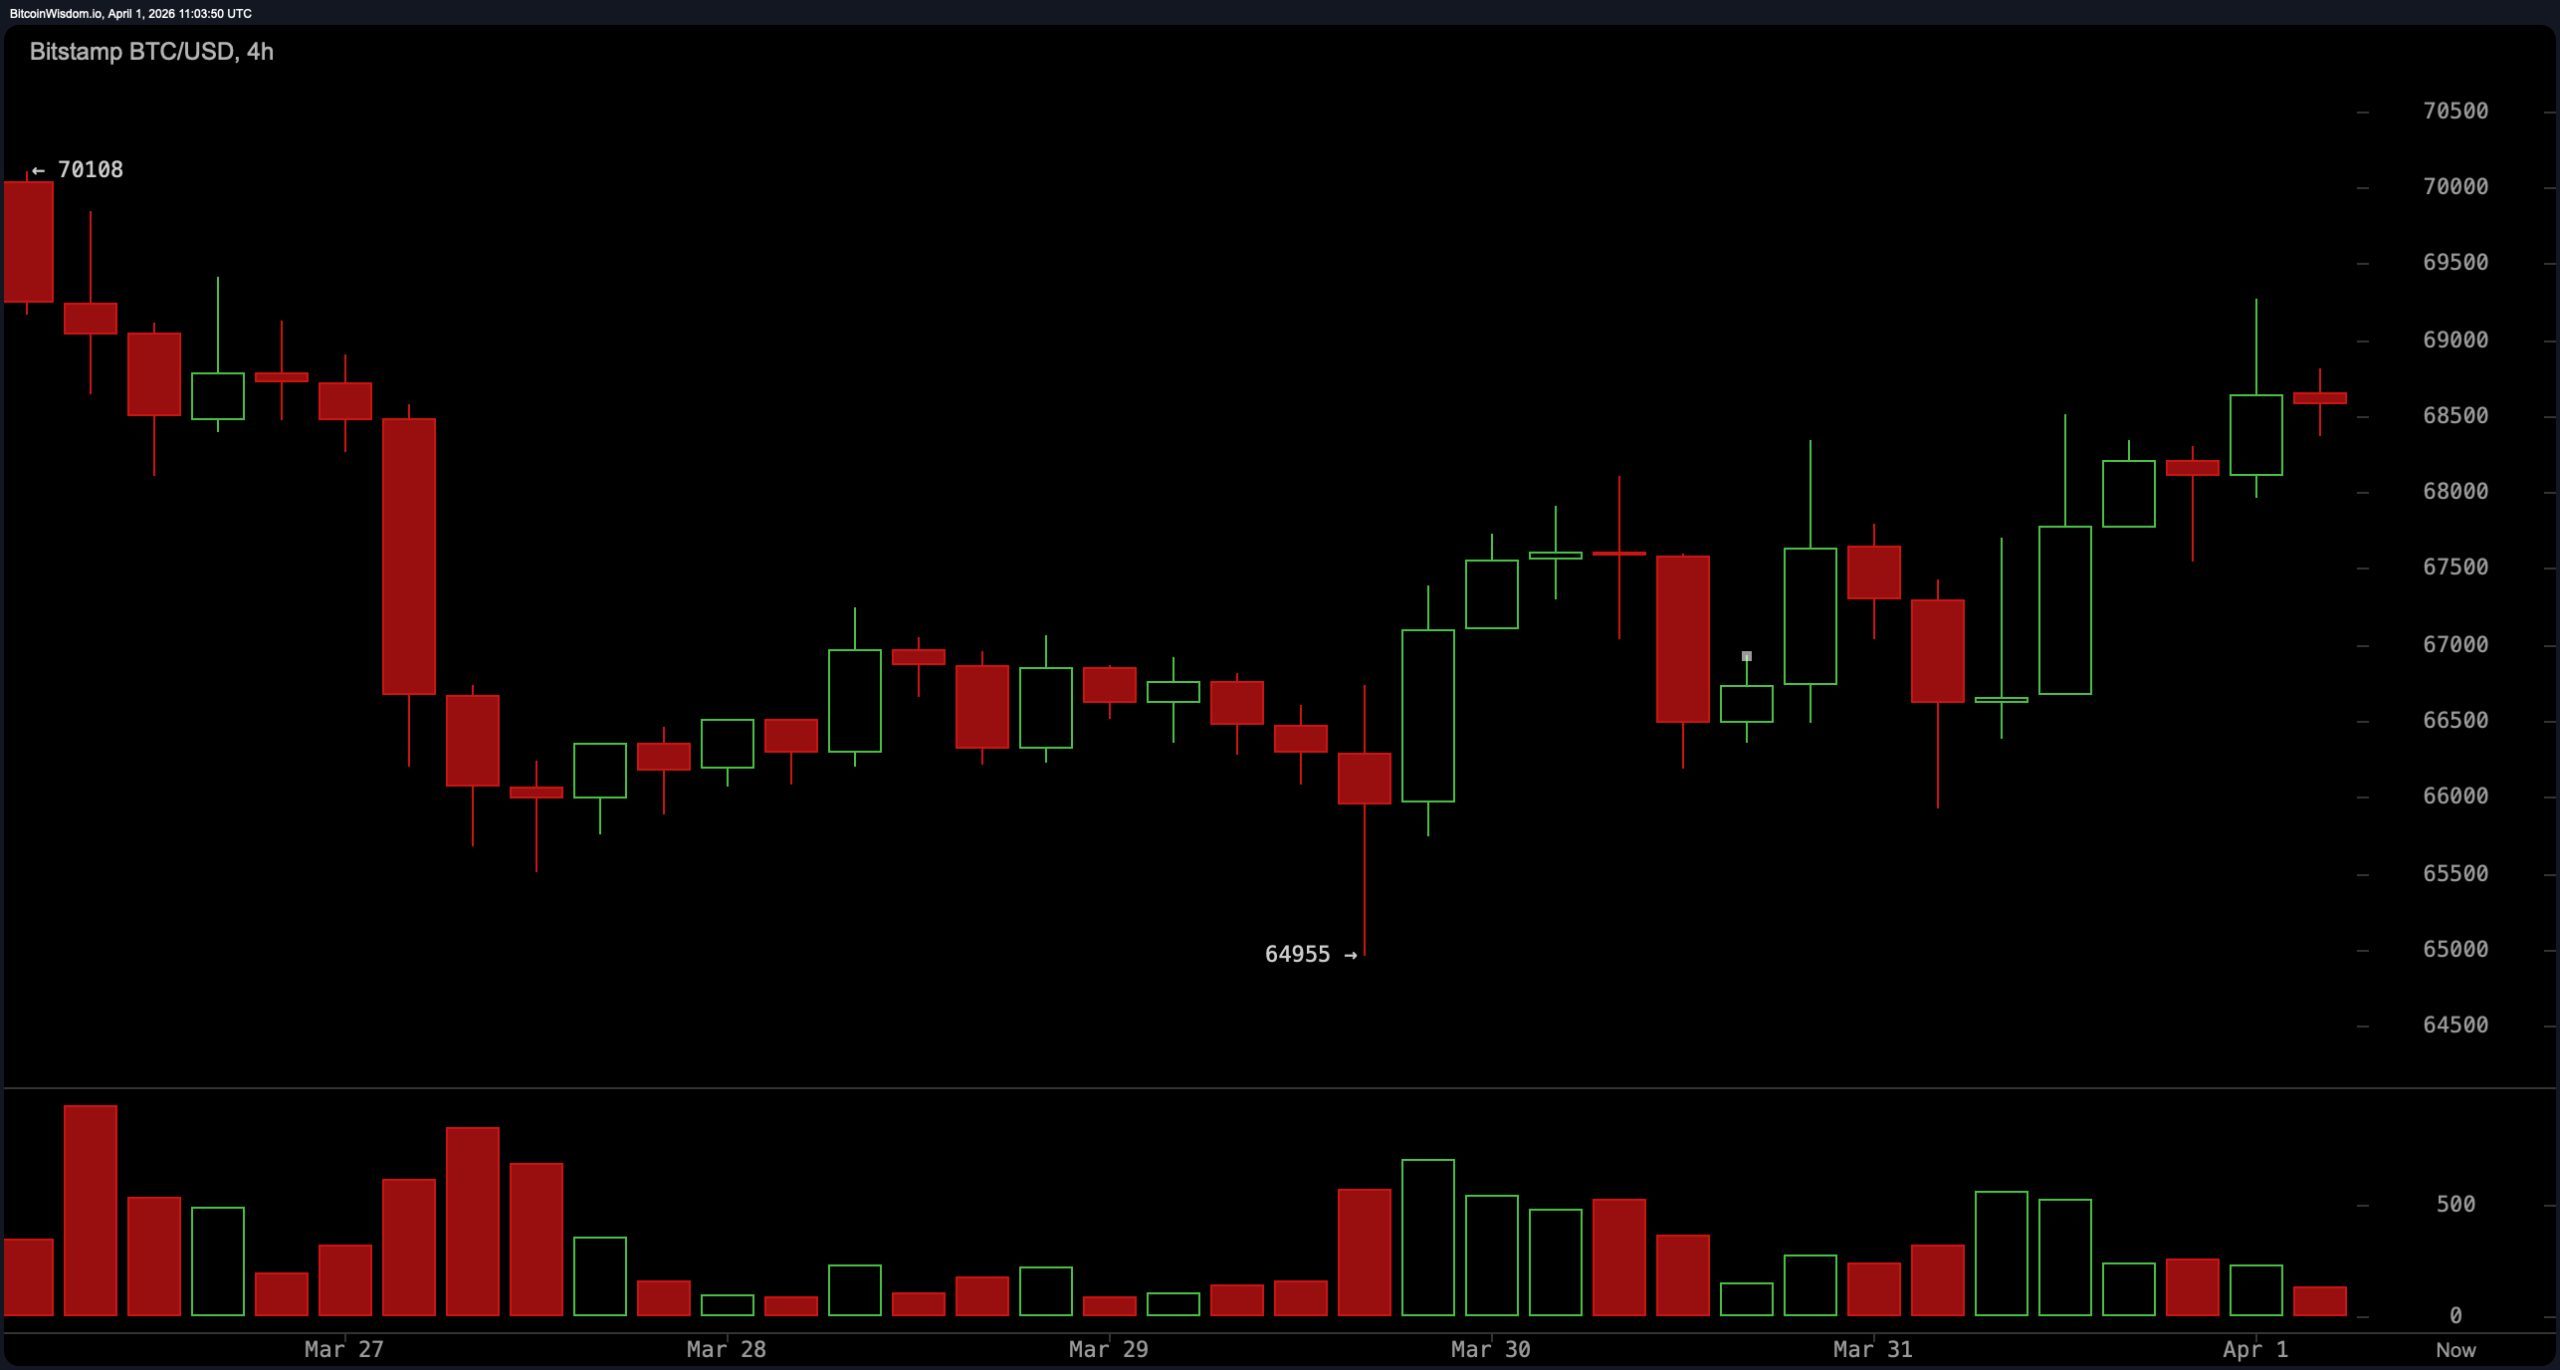
Zooming into the four-hour chart, Bitcoin behaves just as predictably-a circus that never starts. Prices squish themselves into a narrow band, whimpering at the prospect of volatility, which, frankly, is nonexistent. The tight range of $66,740 to $66,760 shows no flair, no fire. It’s the market in a deep, existential pause, not quite daring to pick a side. The crowd waits, in absolute silence, for the show to begin. Spoiler: It won’t. Not yet.
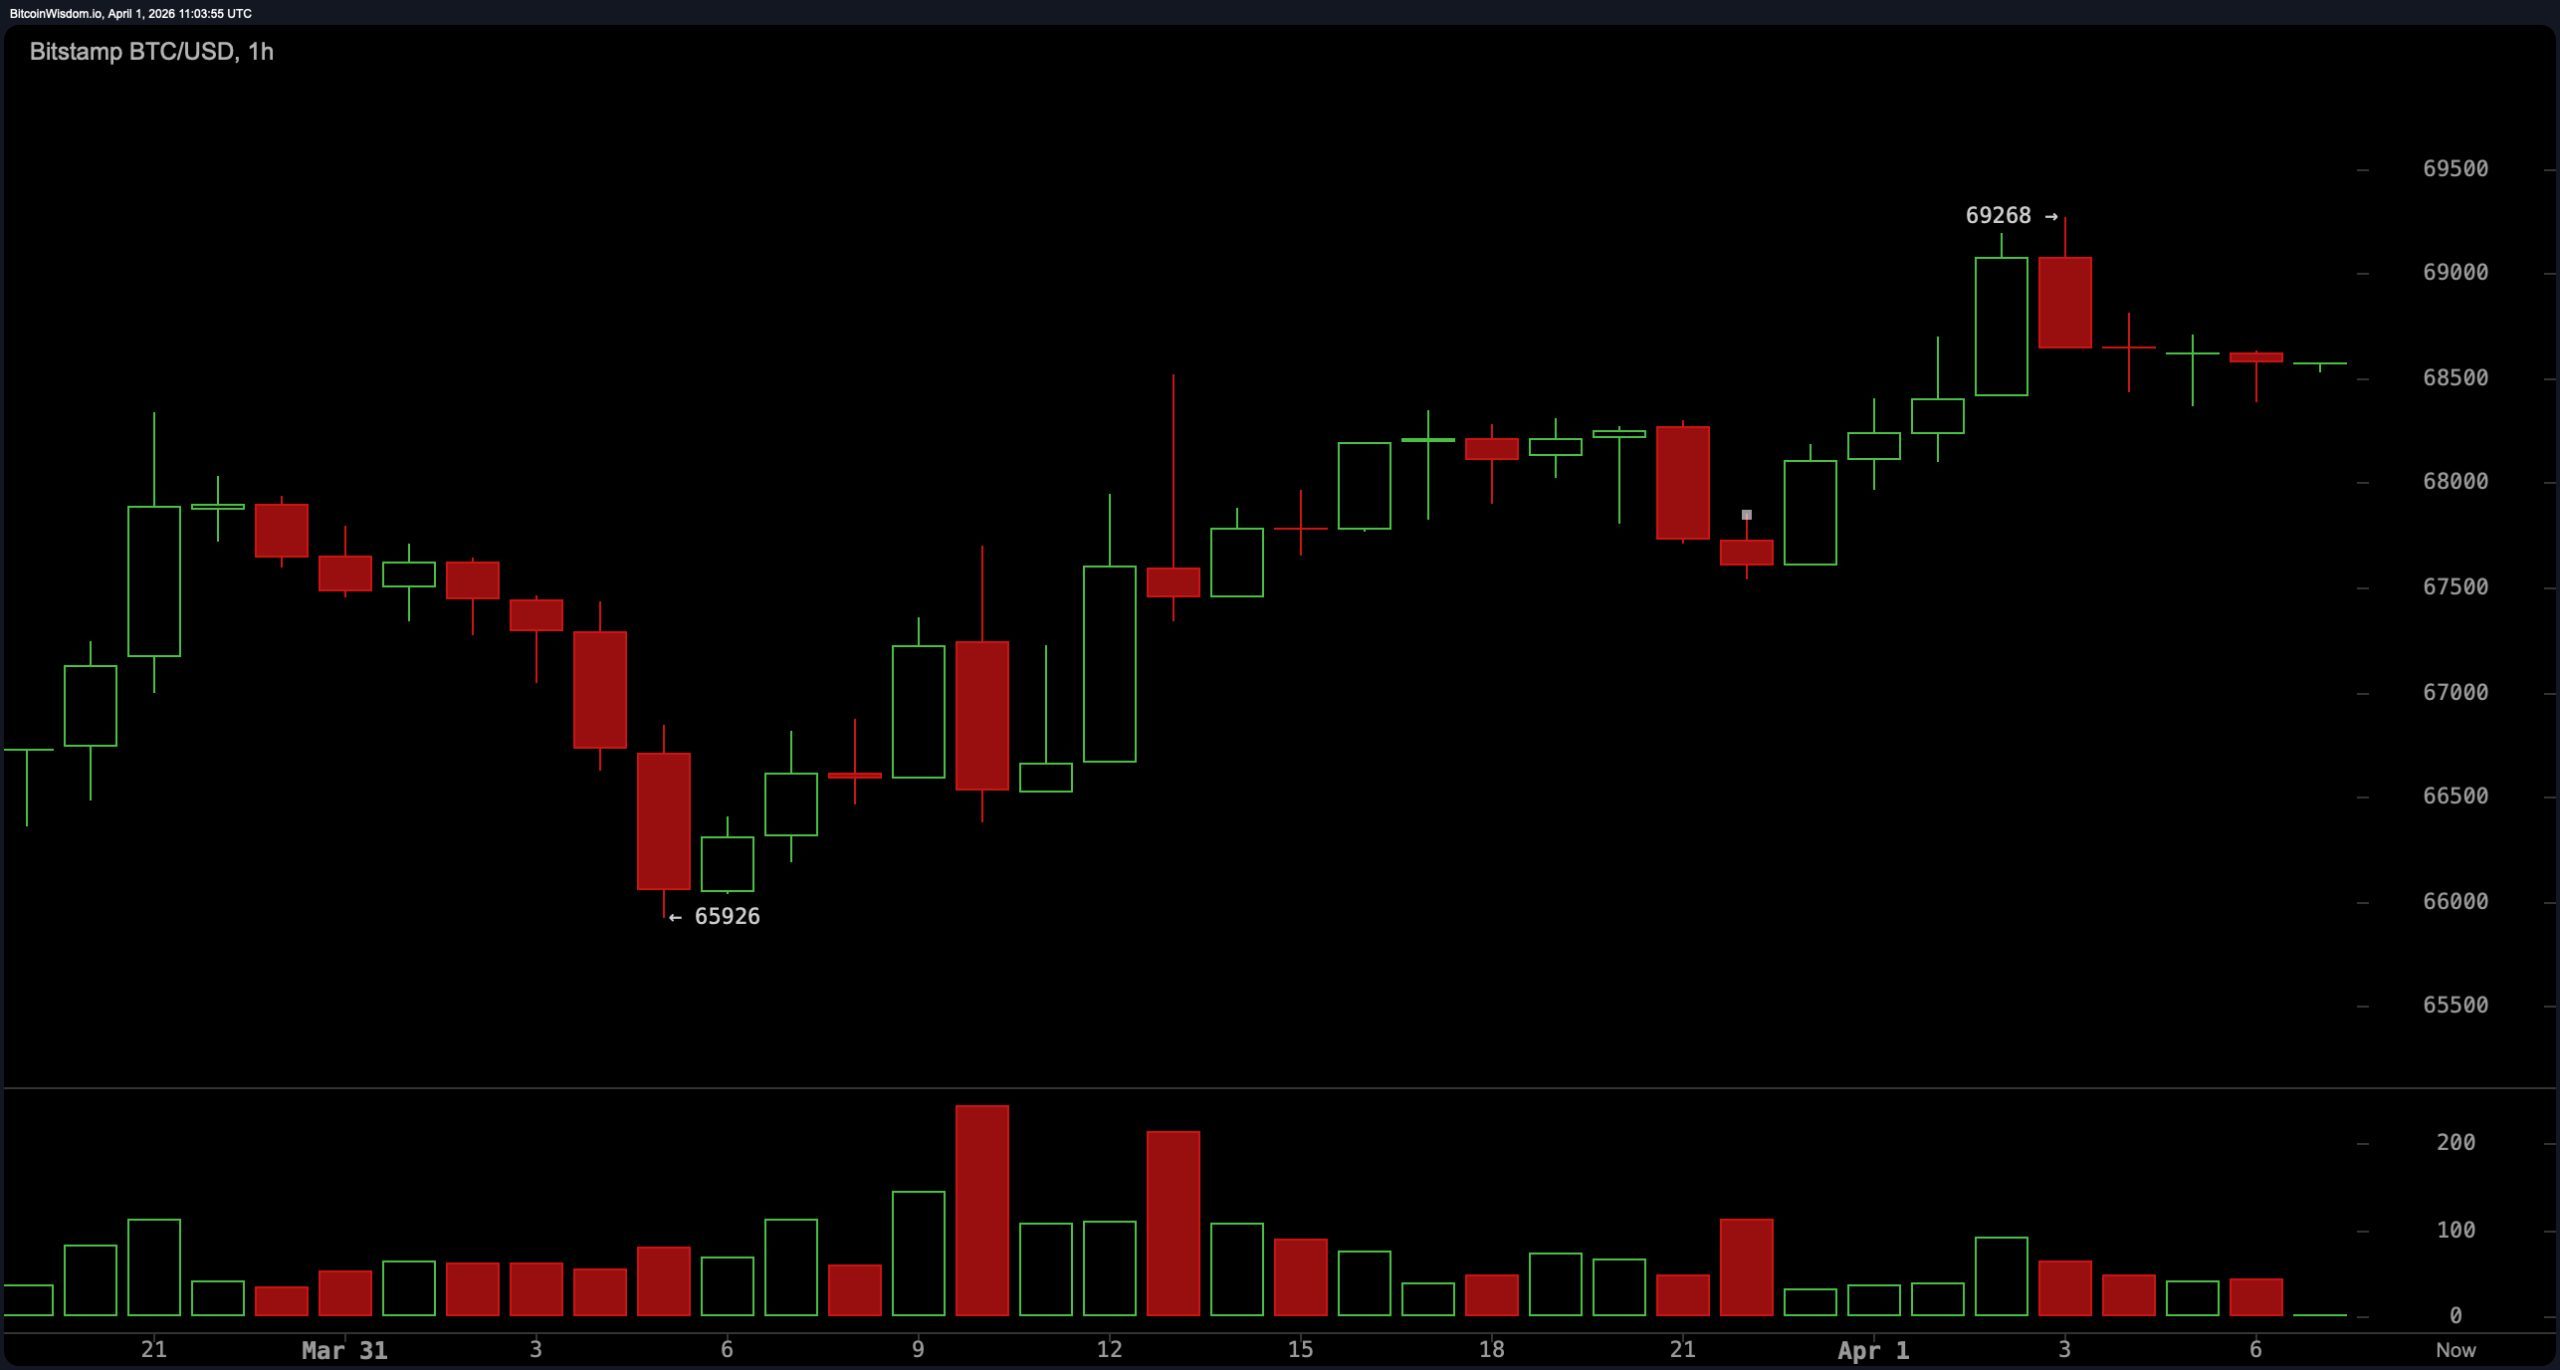
And then, behold, the one-hour chart-a spectacle of indecision. Bitcoin refuses to leave its cozy little micro-range, lolling between $66,710 and $66,794. The averages? Well, they’ve cuddled up near each other, with the buy average at $66,775.80 and the sell average at $66,724.50-do you see the resemblance? Yes, my dear friends, there is no clear winner here. The market, like an impassive observer, sits and watches. A soft murmur ripples through the crowd, but no one dares speak up.
Now, let’s dabble in the oscillators, those fickle creatures of fate. The RSI (Relative Strength Index), lounging at 48, suggests balance. Neither side strong enough to claim victory. The Stochastic at 33 and the CCI at -49? Well, they’re just chilling-unmoved by any great ambition. It’s a playground of neutrality. A teeter-totter with no children playing. How utterly delightful for those who live for the thrill of unpredictability. Which, if you haven’t noticed, is precisely absent here.
Ah, the trend strength? The ADX sits at a tepid 15, signalling, well, almost nothing. Weak trend strength, weak emotions, weak everything. The Awesome Oscillator? With a gentle -2,298, it’s more of a sad violin playing in the background. Momentum, however, creeps up to 667, and if you squint hard enough, you might catch a glimmer of hope. But then again, why bother? It’s the kind of hope you find at the bottom of an empty bottle.
The moving averages (MAs) offer some entertainment for those with a penchant for the gloomy. Short-term support comes in at $68,188 (EMA 10) and $68,359 (SMA 10). But any hopefuls should beware-there’s a veritable fortress of resistance at the top. EMA (20) at $68,826? SMA (20) at $69,792? The bulls won’t break through those walls without divine intervention. And just when you think it’s all over, there are the long-term moving averages lurking in the shadows-EMA (50) at $70,966, SMA (100) at $77,425, and EMA (200) at $84,945. Long-term resistance, of course, always carries a heavy sigh.
Bull Verdict:
The short-term stability above $66,200 may look like a hopeful oasis in the desert. But let’s not get ahead of ourselves. Momentum, though weak, lingers just enough to hint at a possible upward resolve. Should Bitcoin manage to break past $69,135, the market could, theoretically, embrace optimism. But until then, we remain in the world of “maybe.”
Bear Verdict:
Despite the fleeting stability, the persistent presence of long-term moving averages signals one thing: resistance. With the MACD in negative territory and trend strength waning, Bitcoin faces an uphill battle. Until resistance at $69,135 is vanquished, expect Bitcoin to meander, perhaps even dip, into the abyss of range-bound oblivion.
FAQ 🔎
- What is bitcoin’s price outlook on April 1, 2026? Bitcoin is trading sideways within a tight range, signaling consolidation rather than a clear trend.
- Is bitcoin bullish or bearish right now? Bitcoin shows neutral short-term signals but remains under longer-term bearish pressure from moving averages.
- What are the key support and resistance levels for bitcoin? Key support sits near $66,218 while resistance is forming around $69,135.
- What do bitcoin technical indicators suggest today? Most oscillators are neutral, indicating weak momentum and lack of directional conviction.
Read More
- ‘Project Hail Mary’s Unexpected Post-Credits Scene Is Worth Sticking Around
- Beyond Accuracy: Gauging Trust in Human-AI Teams
- How Martin Clunes has been supported by TV power player wife Philippa Braithwaite and their anti-nepo baby daughter after escaping a ‘rotten marriage’
- Clash Royale Balance Changes March 2026 — All Buffs, Nerfs & Reworks
- Gold Rate Forecast
- CookieRun: OvenSmash coupon codes and how to use them (March 2026)
- eFootball 2026 is bringing the v5.3.1 update: What to expect and what’s coming
- The most surprising Hannah Montana cameos: From John Cena to Dwayne Johnson and even a Coronation Street soap star as show celebrates its 20th anniversary
- Genshin Impact Version 6.5 Leaks: List of Upcoming banners, Maps, Endgame updates and more
- Total Football free codes and how to redeem them (March 2026)
2026-04-01 15:27