On July 27th, the price of Ethereum jumped 5% to $1,966. This increase was driven by strong buying, the closing of losing short positions, and a decrease in the amount of Ethereum available, bringing the price closer to the important $2,000 level.
Summary
- Ethereum price gained 5% to $1,966, while 24-hour spot trading volume jumped 118.53% to $9.21 billion.
- The daily chart places $1,981.50 and $2,000 as the next major resistance zones.
- 4-hour RSI reached 73.36, showing strong momentum but raising the risk of a short-term pullback.
- Liquidation data shows large leverage clusters near $1,980–$2,000, with downside liquidity around $1,930.
- Analysts see $2,350–$2,500 as possible targets if ETH establishes support above $2,000.
Ethereum price rally targets $2,000
Ethereum’s price rose to about $1,966, continuing an upward trend that started in June when it hit a low of around $1,512. This increase from near $1,870 brings the cryptocurrency very close – within 2% – of reaching the significant $2,000 mark, according to crypto.news.
Trading activity jumped significantly in the last day, reaching $9.21 billion – a rise of 118.53%, as shown by recent market data. This increase in buying volume along with rising prices indicates genuine demand is driving the price up, not just low trading levels.
Today, Ether (ETH) peaked at $1,981.24 before dropping slightly to around $1,964. This peak is very close to a key technical level – specifically, the 100% Fibonacci retracement at $1,981.50. This means the $1,981–$2,000 range will be an important area to watch as ETH attempts to recover.
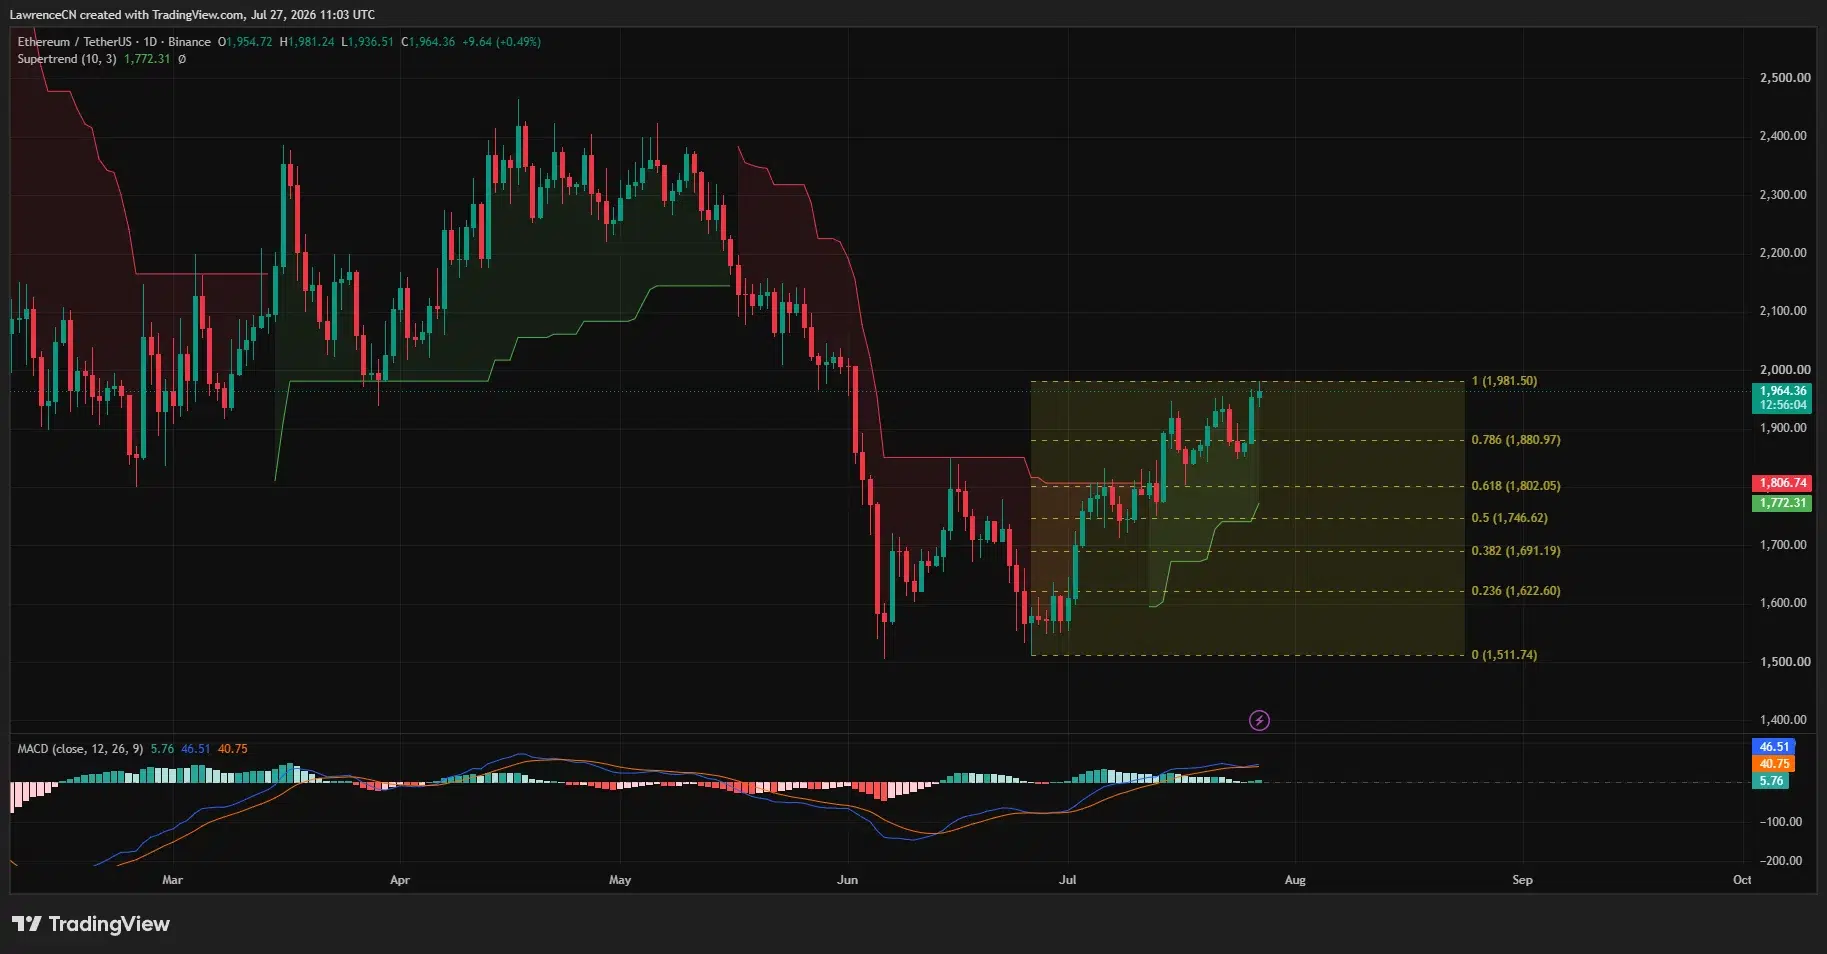
Ethereum has risen above $1,880.97, a key technical level. If it drops below that point, potential support levels to watch are around $1,802.05, $1,746.62, and $1,691.19.
The Supertrend indicator now suggests a support level around $1,772.31, which is a positive sign. For the current recovery to be considered at risk, the price of ETH would need to drop below this level.
Spot demand and supply pressure support ETH
Ethereum’s price increase happened at the same time as a surge in trading and a record number of users locking up their tokens – reaching 34%. Because these locked-up tokens aren’t available for immediate sale, it limits the supply for buyers when demand goes up.
More activity on Layer 2 networks and in decentralized finance is leading to more smart contract usage. With a recent Ethereum upgrade (EIP-1559), a portion of transaction fees is destroyed, reducing the total amount of ETH available, especially when the network is busy.
While these factors don’t promise price increases, they can make price swings bigger when demand goes up. Because there’s less ETH readily available, buyers might have to offer increasingly higher prices to make substantial purchases.
Ethereum ETFs recently launched in the US are adding to the demand for the cryptocurrency. After experiencing some instability in early July, these funds are now consistently attracting more investment.
If US investors continue to put money into ETFs, it would suggest growing interest in crypto alongside trading on regular crypto exchanges. However, the Federal Reserve’s next decision about interest rates is a concern – if they signal plans to raise rates, demand for riskier assets like ETH could decrease.
Technical indicators warn of short-term overheating
Looking at Ethereum’s price movements over the last four hours, it’s been steadily recovering since early July, following a clear upward trend. Recently, after touching a low around $1,850, the price bounced back up to around $1,965.
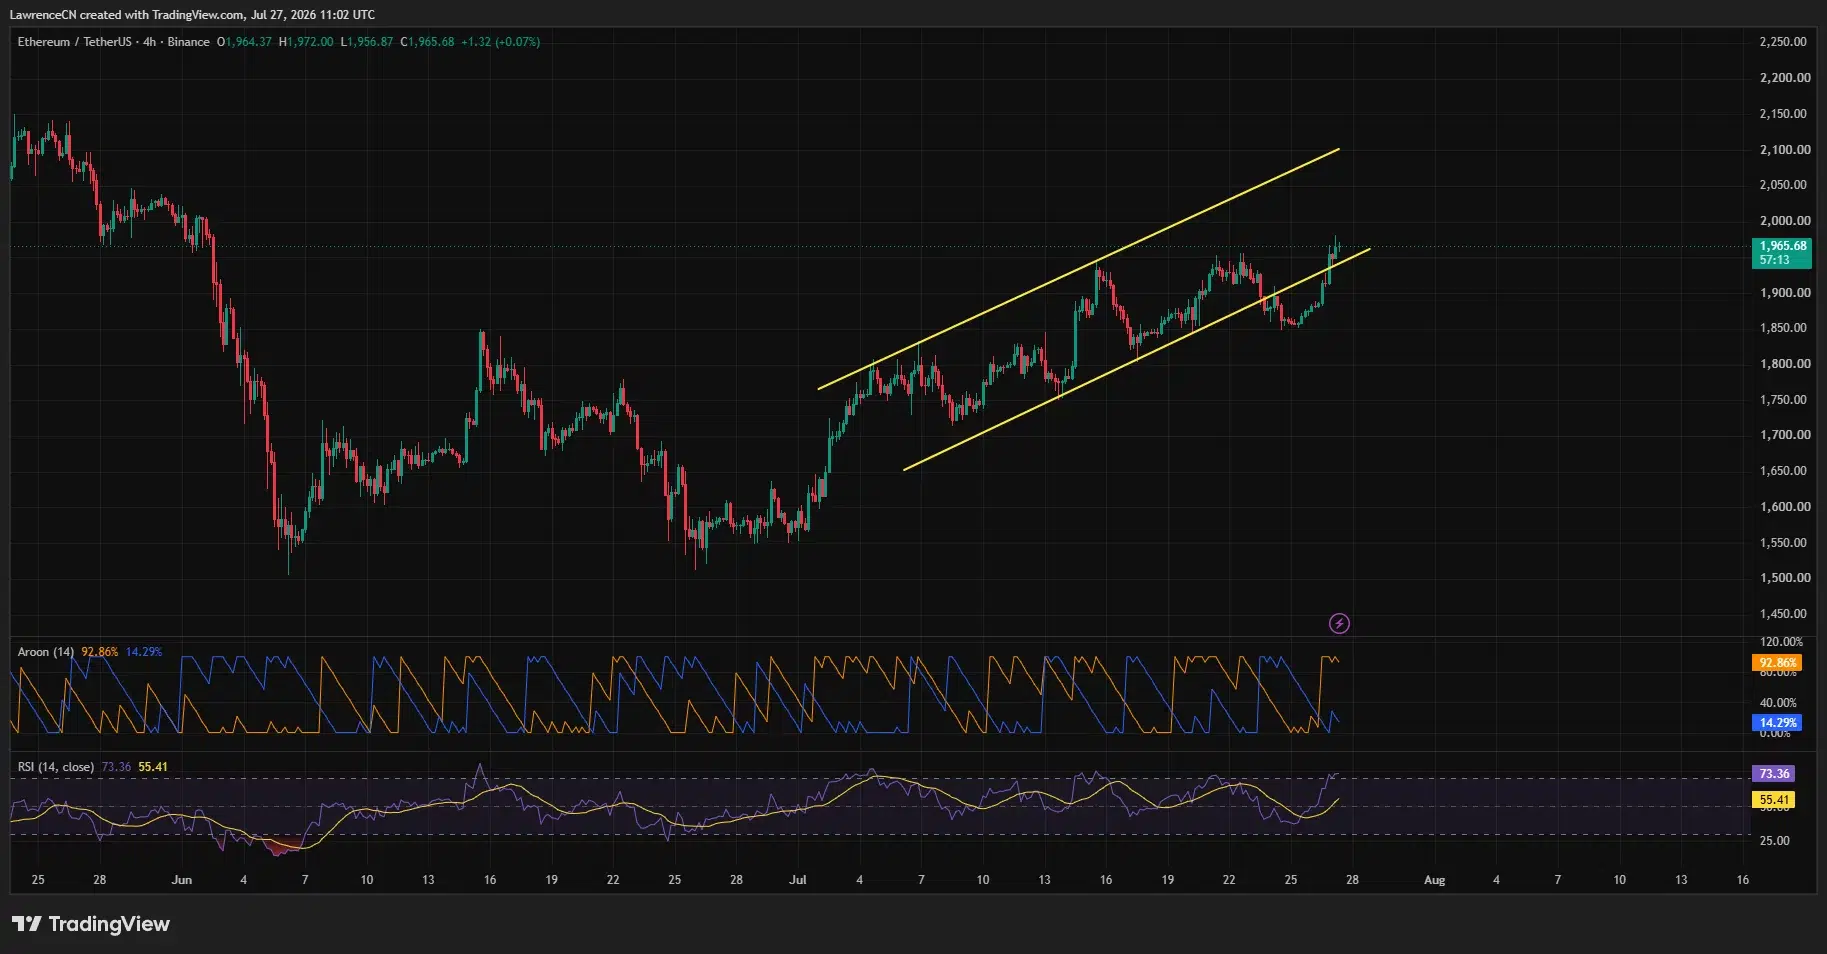
The Aroon Up indicator is currently at 92.86%, while the Aroon Down is at 14.29%. This significant difference suggests that prices are recently making higher highs more often than lower lows, which confirms a positive short-term trend.
The recent upward trend is starting to show signs of slowing down. The relative strength index (RSI) has reached 73.36 on a 4-hour chart, which indicates the market may be overbought – traditionally, a reading above 70 suggests this. While it doesn’t mean prices will immediately fall, it does increase the possibility of a pause in the rally or some investors taking profits around the $2,000 level.
The moving average convergence divergence (MACD) indicator is currently showing positive signs. The MACD line is at 46.51, which is above the signal line at 40.75, and the histogram is at a positive 5.76. This suggests that Ethereum is still gaining upward momentum, even as it nears a price resistance level.
If the price stays above $1,981.50 at the end of a trading day, it would complete a key technical recovery level. After that, buyers would need to push the price back up past $2,000 to confirm their control, with a potential target range of $2,050 to $2,100.
Ethereum liquidations could accelerate the breakout
CoinGlass data reveals a high concentration of leveraged positions just above the current price. The largest clusters of these positions are between $1,980 and $2,000, with further liquidity available up to $2,040. This suggests potential price resistance and areas where liquidations could occur.
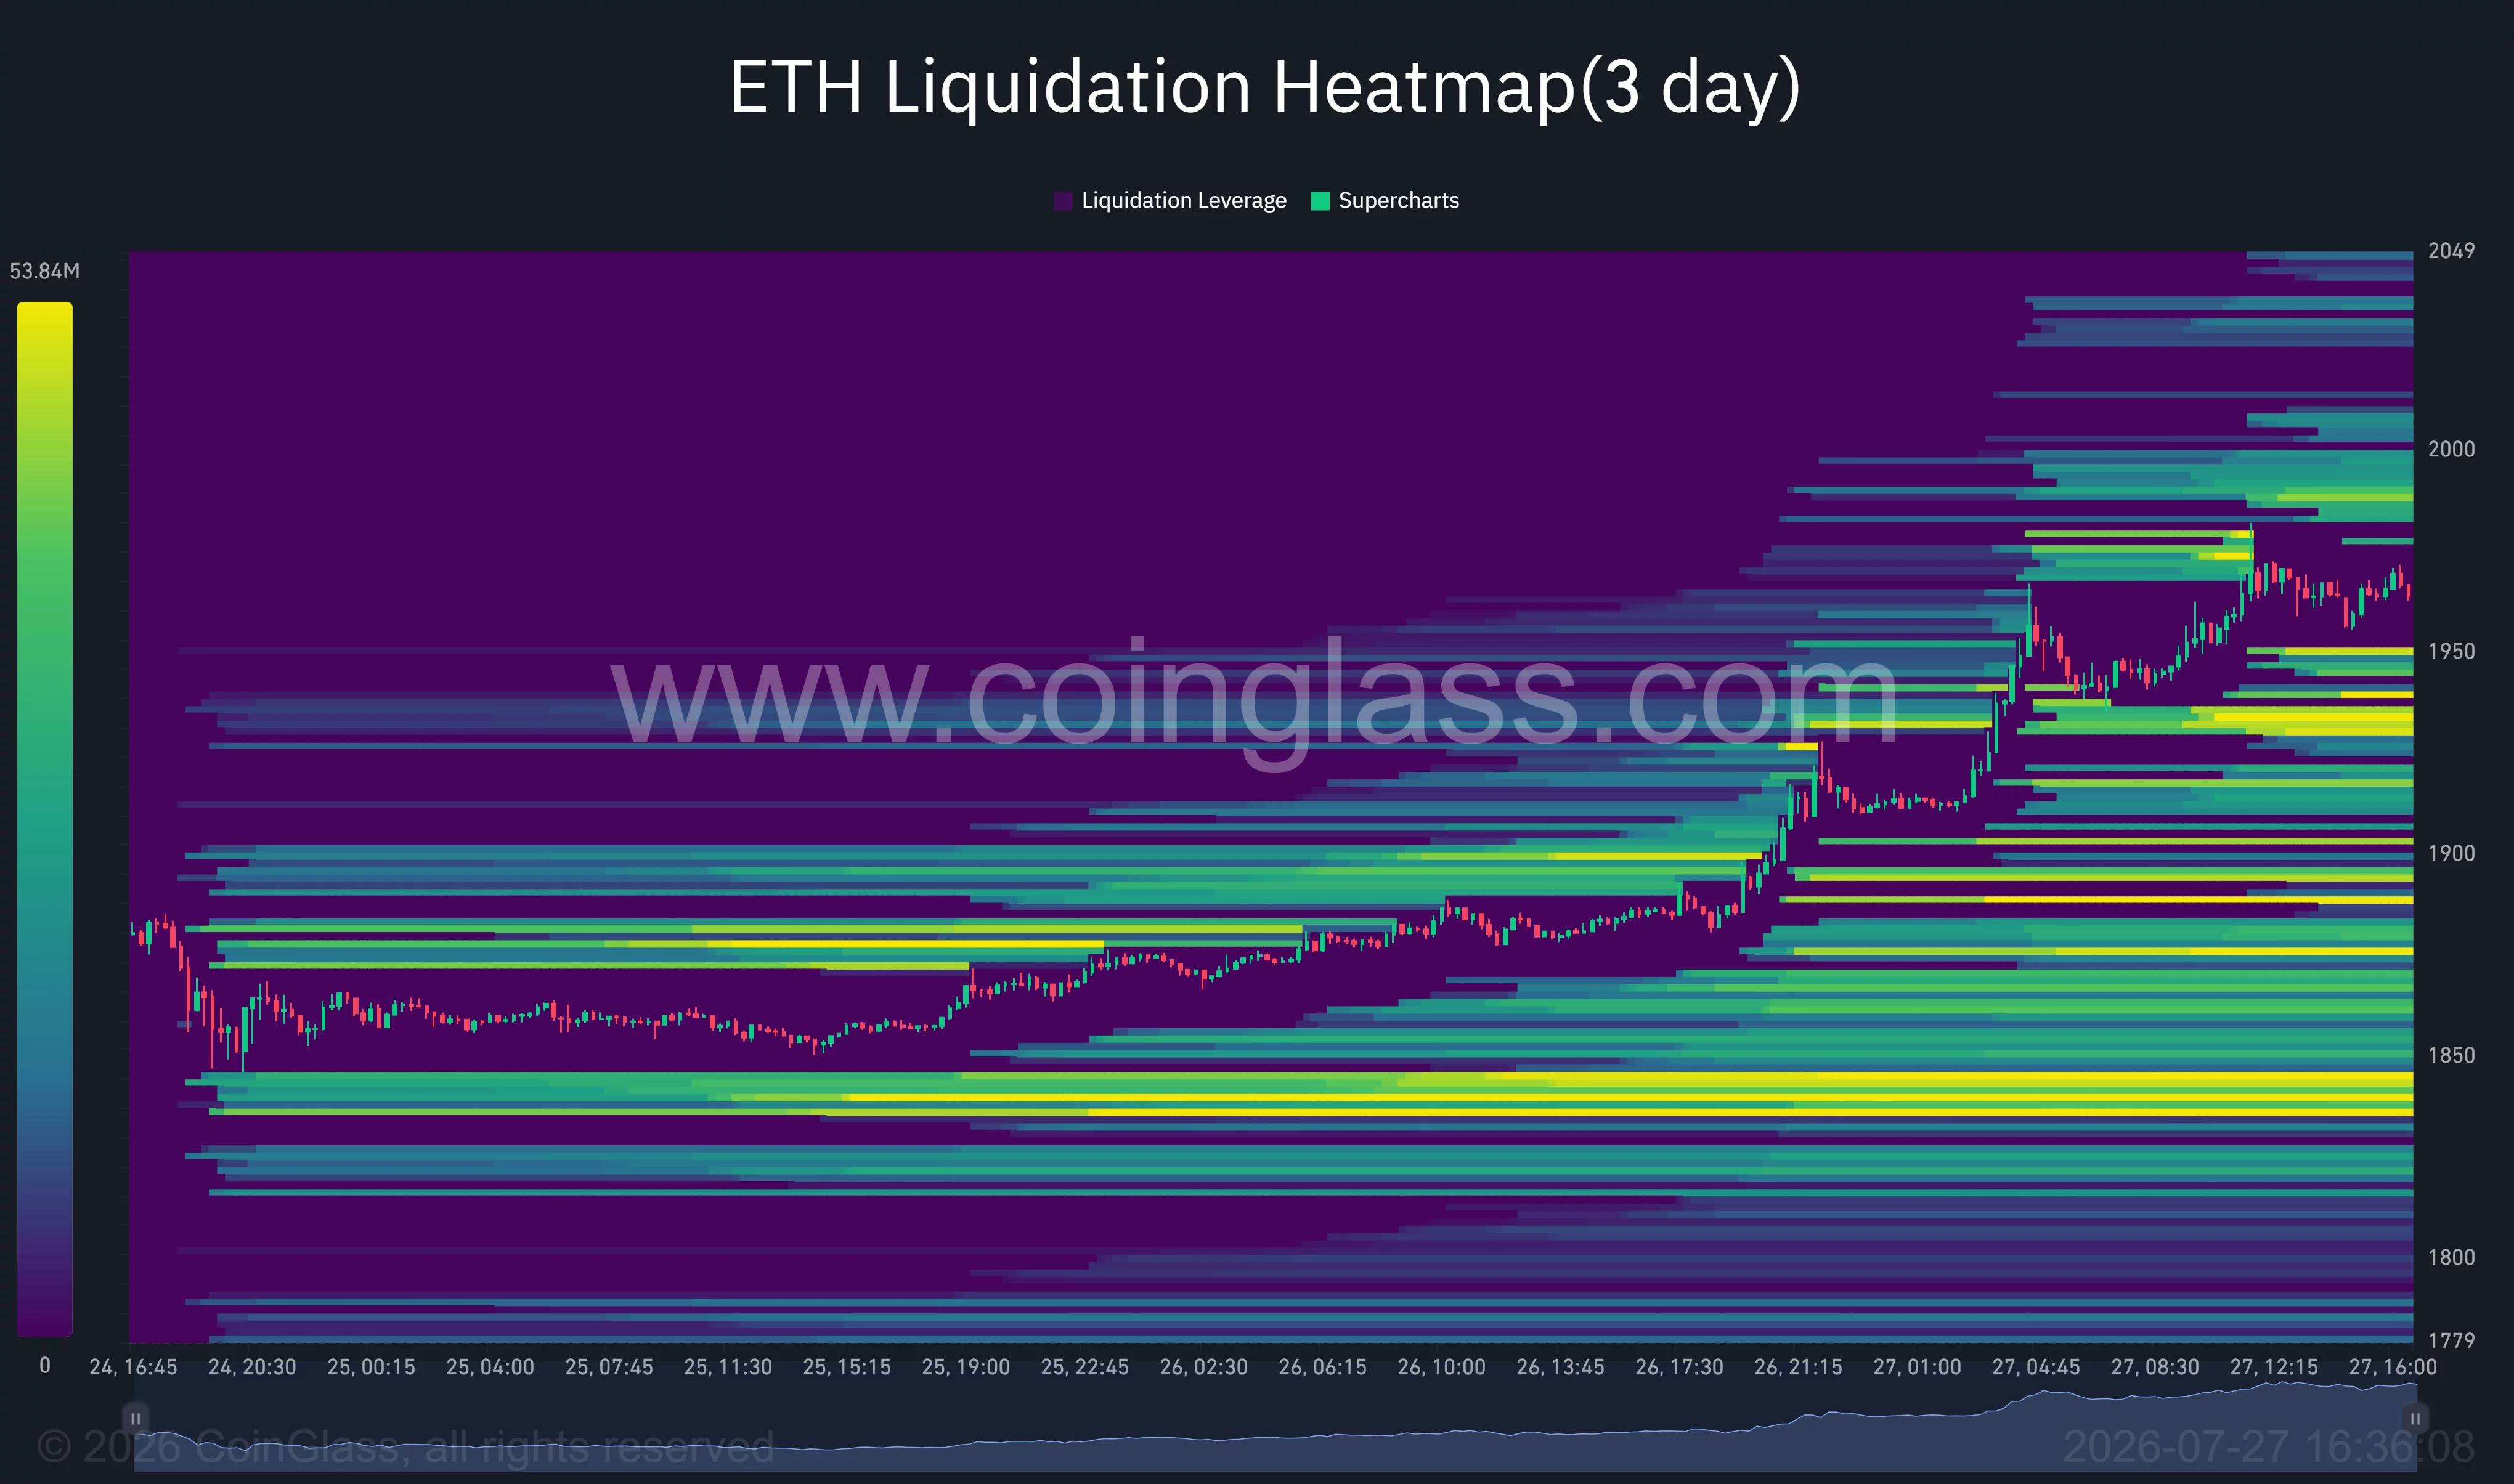
If the price rises to those levels, traders who bet against Ethereum (by ‘shorting’ it) might be forced to buy ETH to cover their losses. This could trigger another rapid price increase, pushing the price past its current resistance levels, especially if a lot of people are actively buying ETH on the market.
The heatmap shows significant support levels where buyers might step in, around $1,945 to $1,930, and even more strongly between $1,900 and $1,880. If the price fails to break through $2,000, it could fall towards these areas as traders close out their leveraged long positions.
The strongest support level is between $1,835 and $1,850, which also coincides with the bottom of a four-hour trading channel. If the price falls below $1,880, this area will be a key level for buyers to defend. If that defense fails, the price could drop to $1,802, and then potentially to around $1,772, where a daily Supertrend indicator suggests further support.
Analysts map $2,350 to $2,500 ETH targets
Market analyst Michaël van de Poppe suggests Ethereum might pause and stabilize before starting to climb again.
“Matter of time until it runs towards $2,500 (which is the other side of the range).”
Analyst Ted Pillows noted an increase in immediate demand, predicting a price point of $2,000 as a key level.
“If Ethereum manages to break and reclaim $2,000 here, it could rally to May highs.”
Pillow’s analysis suggests potential resistance for the asset around $2,191, with a bigger area of likely selling pressure between $2,350 and $2,400. However, these levels will only become relevant if the price stays above $2,000 after briefly falling back to test that level.
If the price falls below $2,000, it could lead to a temporary drop to around $1,930 or $1,881. As long as the price stays above the lower edge of the current upward trendline, the optimistic outlook remains valid. However, dropping below $1,850 would suggest the recent price increase might be losing momentum.
2026-07-27 15:57