Large investors (often called “whales”) bought $204 million worth of HYPE tokens in just one day, pushing the price to a critical support level around $57. Analysts are now looking at price charts to predict where HYPE might go next.
Large cryptocurrency holders associated with Hyperliquid have staked over $204 million in HYPE tokens in the last day.
A single investor, using 19 different digital wallets, has staked 2.93 million HYPE tokens, currently worth around $172 million. They purchased these tokens nine months ago for an average of $44 each, and now their investment shows an unrealized profit of approximately $44.5 million.
Instead of selling, the wallet moved the entire stack into staking.
I just saw something interesting – another big crypto investor, what we call a ‘whale,’ put $32.87 million into HYPE tokens. They bought it through FalconX and immediately staked all of it on Hyperliquid. That’s a significant move and shows some strong confidence in the project!
Hyperliquid Whale Wallets Choose Staking Over Selling
A trader known as Wise Crypto noticed unusual activity on the blockchain platform X. They pointed out that the amount of cryptocurrency being staked was significant, especially considering the potential profits involved. The fact that one large investor used 19 different wallets suggests they were intentionally diversifying their holdings to minimize risk, rather than keeping everything in a single account.
Whale conviction on $HYPE just hit another level.
Over the past day, a large investor—using 19 different digital wallets—staked $2.93 million in HYPE tokens on Hyperliquid, which is currently valued at around $172 million.
And here’s the really surprising part: these tokens were originally bought nine months ago for around $44 each, and now they’re worth…
— Wise Crypto (@WiseCrypto_) July 25, 2026
After holding the token for nine months despite market fluctuations, someone decided to stake it instead of selling. This suggests they believe in its long-term potential. Another user immediately staked their tokens after receiving them through FalconX, without buying or selling any first.
Together, these two wallets generated over $204 million in new staking activity within a single day. According to Wise Crypto, this suggests that experienced investors are increasing their holdings instead of selling.
When you stake cryptocurrency, those coins are temporarily taken out of circulation. This can lower the amount available for sale on exchanges. Currently, neither wallet involved shows signs of planning to unlock their staked tokens or sell them anytime soon.
Read also: Hyperliquid HIP-4 Could Transform Prediction Markets With HYPE Staking
HYPE Price Structure Weakens After Trendline Break
According to chart analyst The Boss, HYPE’s price recently fell below a key support level that had been helping it recover. This suggests the token may now face further selling pressure in the short term.
The $HYPE chart is now in a new stage after falling below a key support level.
The recent upward trend that was helping prices recover has ended, and now it looks like sellers have more control in the short term. Since this change, we’ve seen…
— The Boss (@CryptoTheBossX) July 25, 2026
Since the recent drop, any price increases have been weak and haven’t lasted. Plus, the price keeps hitting a downward-sloping resistance level, preventing significant gains. Buying activity also seems much less enthusiastic than it was during the previous increase.
The analysis noted that horizontal demand is now being tested.
If buyers step in and prevent prices from falling further at this level, we might see a period where prices move sideways instead of continuing to drop. However, if the price doesn’t manage to rise back above its previous trendline, it suggests more selling pressure could follow until buyers establish a new stable base.
HYPE Price Analysis: Key Support and Resistance Levels to Watch
At the time of this report, HYPE stock was trading at $57.92. The price had been falling recently after it couldn’t break through a resistance level between $65 and $70. Over the past two weeks, the stock’s price has consistently made lower highs and lower lows, as seen on its daily chart.
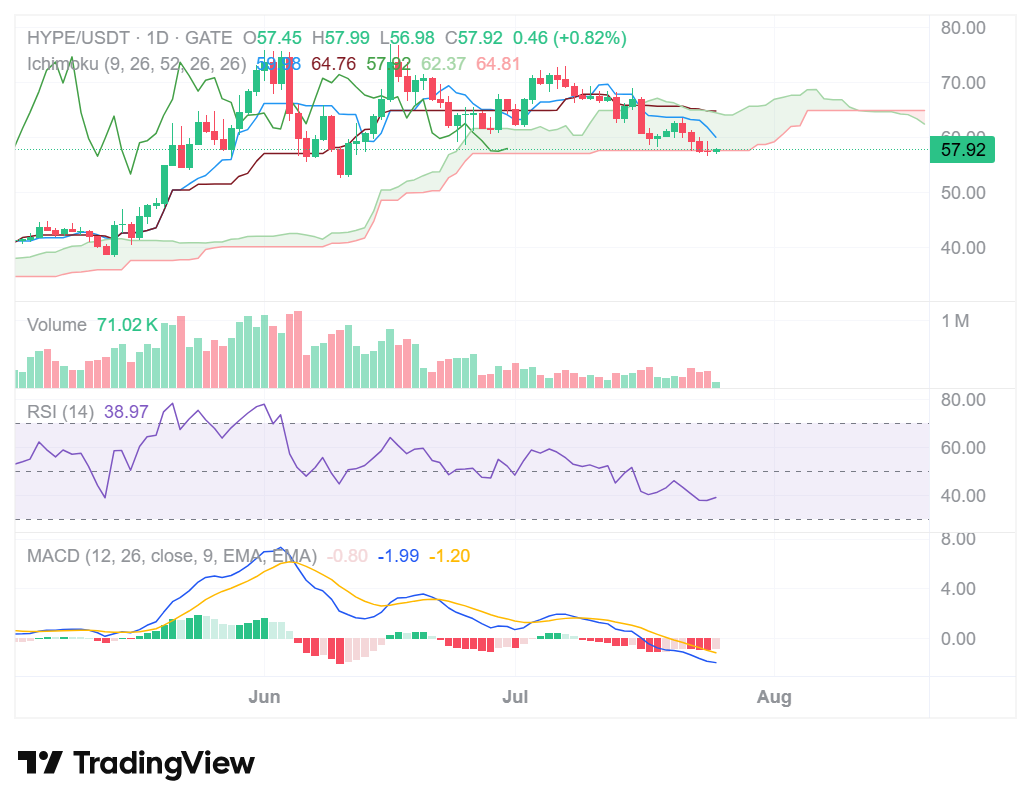
The price is currently below key levels – $59.08 and $64.76 – suggesting the price may continue to fall. Initial support can be found between $57 and $58, with further support around $55, and a strong base between $52 and $53.
The RSI reads 38.97, below the neutral 50 mark but approaching oversold territory.
From my analysis, if we see prices move back up to the 45-50 range, that would increase my confidence in a potential rebound. While the MACD is still indicating a downward trend with its line below the signal line, I’m noticing the histogram is shrinking, which suggests the selling pressure might be easing off.
Since prices rose to around $70, trading activity has consistently decreased. For the price to recover strongly, we’d probably need to see more buying and selling – and for the price to move past its current high point.
2026-07-25 22:44