Traders should watch out for a possible sudden increase in bitcoin’s volatility, which could lead to falling prices. This is sometimes referred to as a ‘volmageddon’.
This warning comes from looking at the BVIV index, which measures how much bitcoin’s price is expected to fluctuate over the next month. Many see it as similar to the VIX on Wall Street. The BVIV is affected by how many options contracts traders are buying – these contracts help protect against big, unexpected price changes. When more traders buy protection (options), volatility tends to increase, and when fewer do, it decreases.
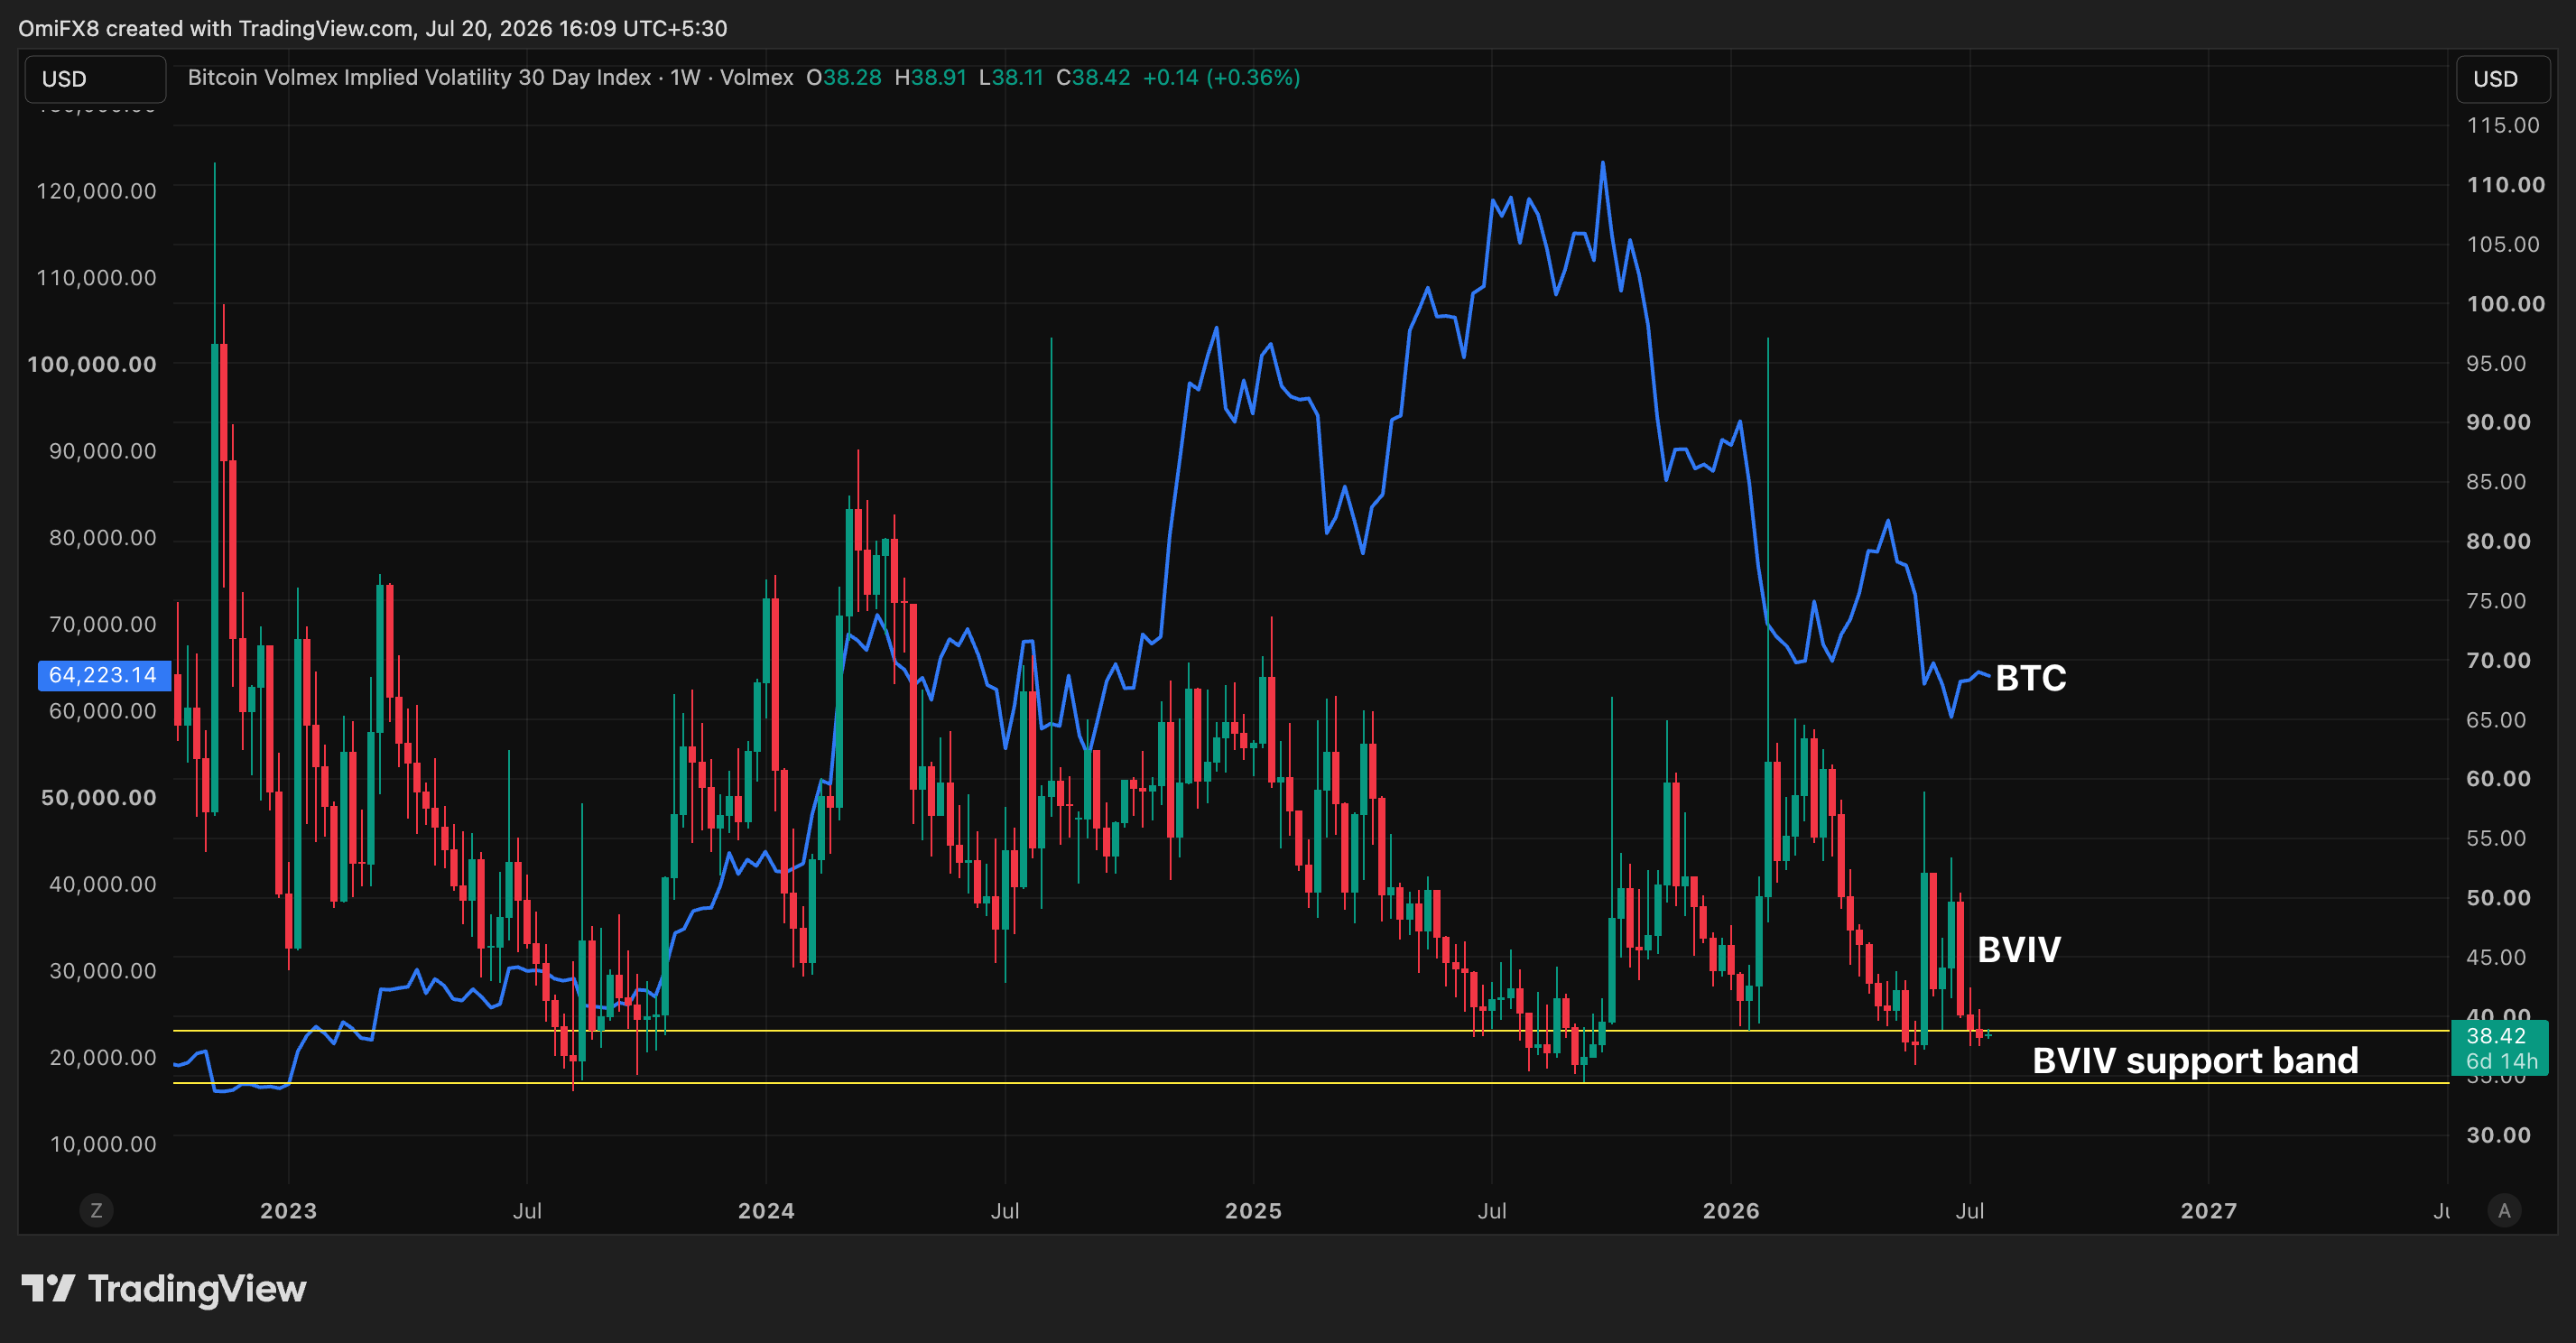
Currently, the index is stuck between 34% and 38%. Based on recent patterns, this level often precedes a period of increased market swings and a subsequent drop in prices. I’m watching this closely, as it’s a potential warning sign.
The index hit this level in late May, and shortly after, its value fell from $74,000 to below $60,000 in under a week, with the BVIV increasing. We saw a nearly identical situation right before the price drop in early February and again after the record highs in October.
Although past performance isn’t a predictor of the future, market volatility tends to move in cycles. Generally, when volatility is low, it’s often followed by increased turbulence, and after periods of high volatility, the market usually calms down.
As I’m looking at the market right now, the index is below both its 30-day and 200-day moving averages. What’s interesting is that volatility is currently low – relatively inexpensive, actually – and it’s landed in an area that’s historically bounced back. This suggests we could see a rise in volatility soon, meaning potentially another period of market turbulence.
Bitcoin is currently trading just above $64,000 and has remained within a limited price range since last Wednesday. Although spot ETFs have seen some money flow in over the past two weeks, this amount is small compared to the large sums that were withdrawn from the market during the previous eight weeks.
Financial markets are showing some uncertainty, but aren’t necessarily signaling a full-blown panic. South Korea’s stock market volatility measure is very high, reaching levels not seen since the 1990s. On Wall Street, volatility also increased on Friday, rising over 12% to around 18%, where it remains. However, these increased levels of volatility have been present for several months, suggesting investors aren’t overly alarmed.
The MOVE Index, which measures volatility in U.S. Treasury notes and impacts global financial markets, has stayed around 70% since April. This stability is generally a positive sign for investments considered risky. However, it’s still important to stay informed and cautious!
Today’s signal
The graphic displays how the price of Bitcoin has fluctuated (shown by the blue line), alongside changes in its expected future volatility over a 30-day period (represented as candlesticks).
Recently, BVIV has consistently found support between 34% and 38%. Historically, whenever it falls to this level, it’s often been followed by increased market instability and a decline in the price of Bitcoin.
At present, BVIV is hovering around 38%, close to the upper edge of that range.
2026-07-20 14:19