Zcash (ZEC) is currently trading around $559. It recently dropped from a resistance level between $650 and $680, and is now finding support near $520. Traders are watching to see if it can reach the $700 level.
Traders are once again watching the price of ZEC, noting that the current increase looks similar to the one seen in November as it approaches a key resistance level.
Recently, the price of ZEC/USD moved close to the $650–$750 range. The price chart suggests a potential double top pattern, followed by a decline towards important support levels.
ZEC Rally Meets the Same Resistance Zone
Zcash (ZEC) rose towards $700 after a significant rebound from its low point in April. The price began to increase between $220 and $260 and continued to climb throughout May.
Price later reached the $650 to $680 zone, where buying momentum started to slow.
Traders are watching the $650 to $750 range because it also capped the November rally.
Both weather systems weakened after moving into the same region. Experts noted that the patterns of both systems resembled a ‘double top,’ a common sign of potential weakening.
$ZEC
It’s notable that Zcash (ZEC) reaching $700 mirrors the pattern we saw in November when it rose to around the same price level.
Each time the price rose, it reached a similar range of $650 to $750, and then the upward movement began to lose steam.
Both structures then topped…
— Ardi (@ArdiNSC) May 28, 2026
The price first went up, then dipped slightly, rose again, and finally attempted to break through a resistance level but failed. This pattern has been noted by those who study price charts.
Recently, prices have been rising and holding those gains, unlike in November when the increase was quick but then fell sharply.
Key Support Levels Come Under Pressure
ZEC/USD was trading around $559 after bouncing back from a recent low of about $520. Currently, buyers seem to be holding the price between $520 and $530.
This zone remains important because it has already attracted demand during the latest pullback.
Traders noted that the price fell below a key support level around $600 and also broke through a resistance level near $570, indicating further potential declines.
Price then moved into the macro support area near $540, which marked the expected downside swing.
One trader described the move as a “10% swing move to the downside” after support failed.
According to the trader, the key support level needs to remain strong for the price to continue rising. Repeated testing of this level, however, could weaken it as more trading activity occurs.
$ZEC
Would you look at that..
The price fell below key support levels at $600 and $570. It’s now heading towards a broader support level around $540.
Result.. we got the expected 10% swing move to the downside.
What an execution of our setup. Can’t say you…
— Ardi (@ArdiNSC) May 27, 2026
If the price of ZEC falls below $520 to $530 at the end of a day, it could drop further. Key support levels to watch would then be around $500 and $480.
A deeper move could bring the $420 to $440 support zone back into view.
Read Also:
Zcash (ZEC) Price Faces Heavy Pressure, Eyes $300 After Core Developer Split
Indicators Show Cooling Momentum
The Relative Strength Index (RSI) remained around 52, indicating a lack of strong upward or downward price movement. While the RSI has decreased from previous highs, it doesn’t currently suggest a downward trend.
This indicates the market is taking a breather after a significant increase, and isn’t necessarily signaling a complete reversal of the upward trend.
The MACD indicator suggested that short-term price momentum was slowing down. This was indicated by the MACD line staying below its signal line, and a negative reading on the MACD histogram.
Even so, the MACD remained above the zero line, so the broader trend has not fully broken.
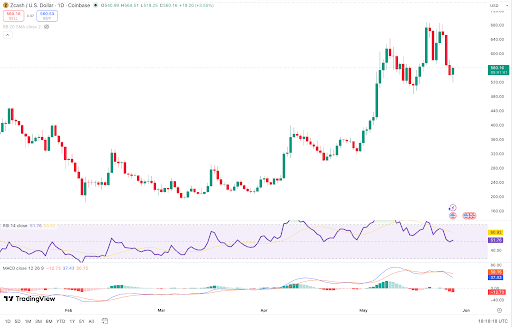
If ZEC can rise above $565 to $580, it could then test the $600 to $620 range.
If buyers regain control above $620, the $650 to $680 resistance zone would return to focus.
Traders are currently focused on whether the price around $520 will continue to act as a floor. If the price falls below $520, it could lead to further declines, potentially towards $500 and then $480.
A move above $580 to $600 would be the first signal that buyers are returning.
2026-05-29 03:02