Ah, Bitcoin, the great digital ditherer, currently loitering at $87,752 with a market cap of $1.75 trillion and a 24-hour trading volume of $15.69 billion. The day’s price action? A thrilling snooze-fest between $87,363 and $87,893. Truly, the stuff of legends-or at least, the stuff of mildly interesting spreadsheets. 📊😴
Bitcoin Chart Outlook: A Tale of Indecision and Tea Breaks ☕
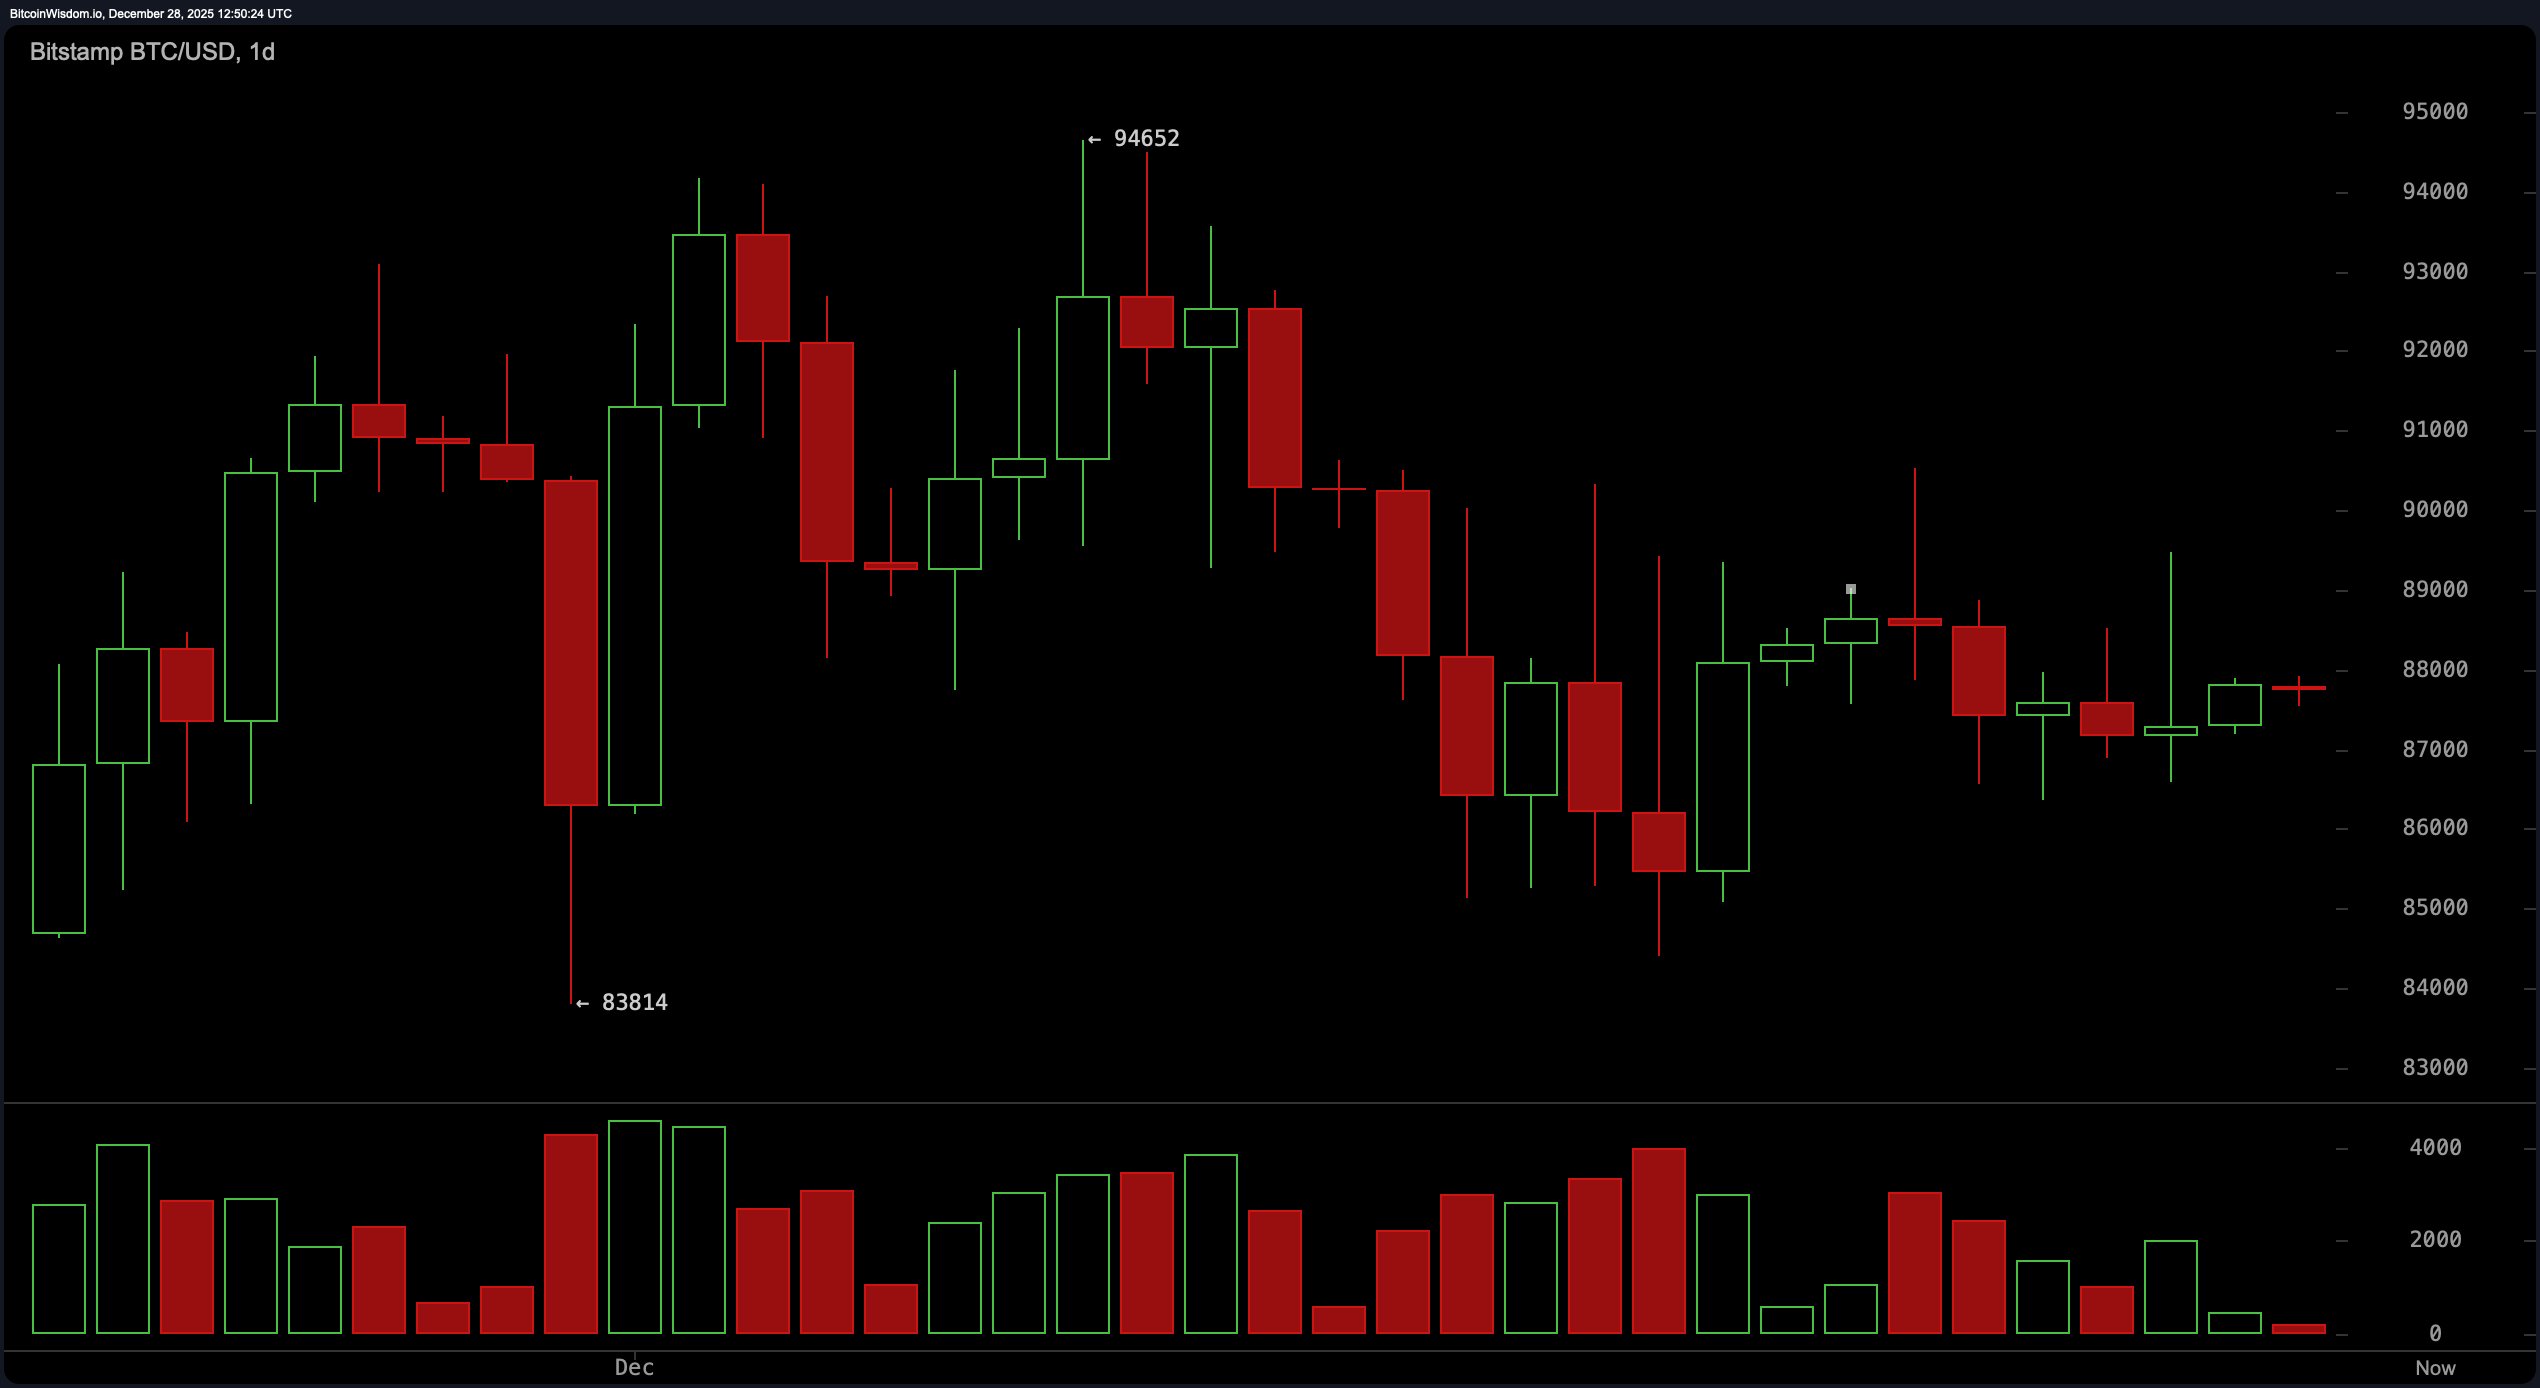
The daily chart? Oh, it’s a masterpiece of consolidation purgatory. Bitcoin’s been dipping and grinding like a bad dance move between support at $83,800 (tested twice, because why not?) and resistance at $94,600. Volume? It’s telling a tale of distribution, with red candles hogging the spotlight. Bears, it seems, are still nibbling at the buffet. 🐻🍴
The momentum indicator? A modest 2,295. MACD? A sulky -1,148. Both are giving a bullish nod, but with the enthusiasm of a Monday morning. If Bitcoin retests $83,800 and does a little bullish jig, the market might finally wake up. Or not. Who knows? 🤷♂️
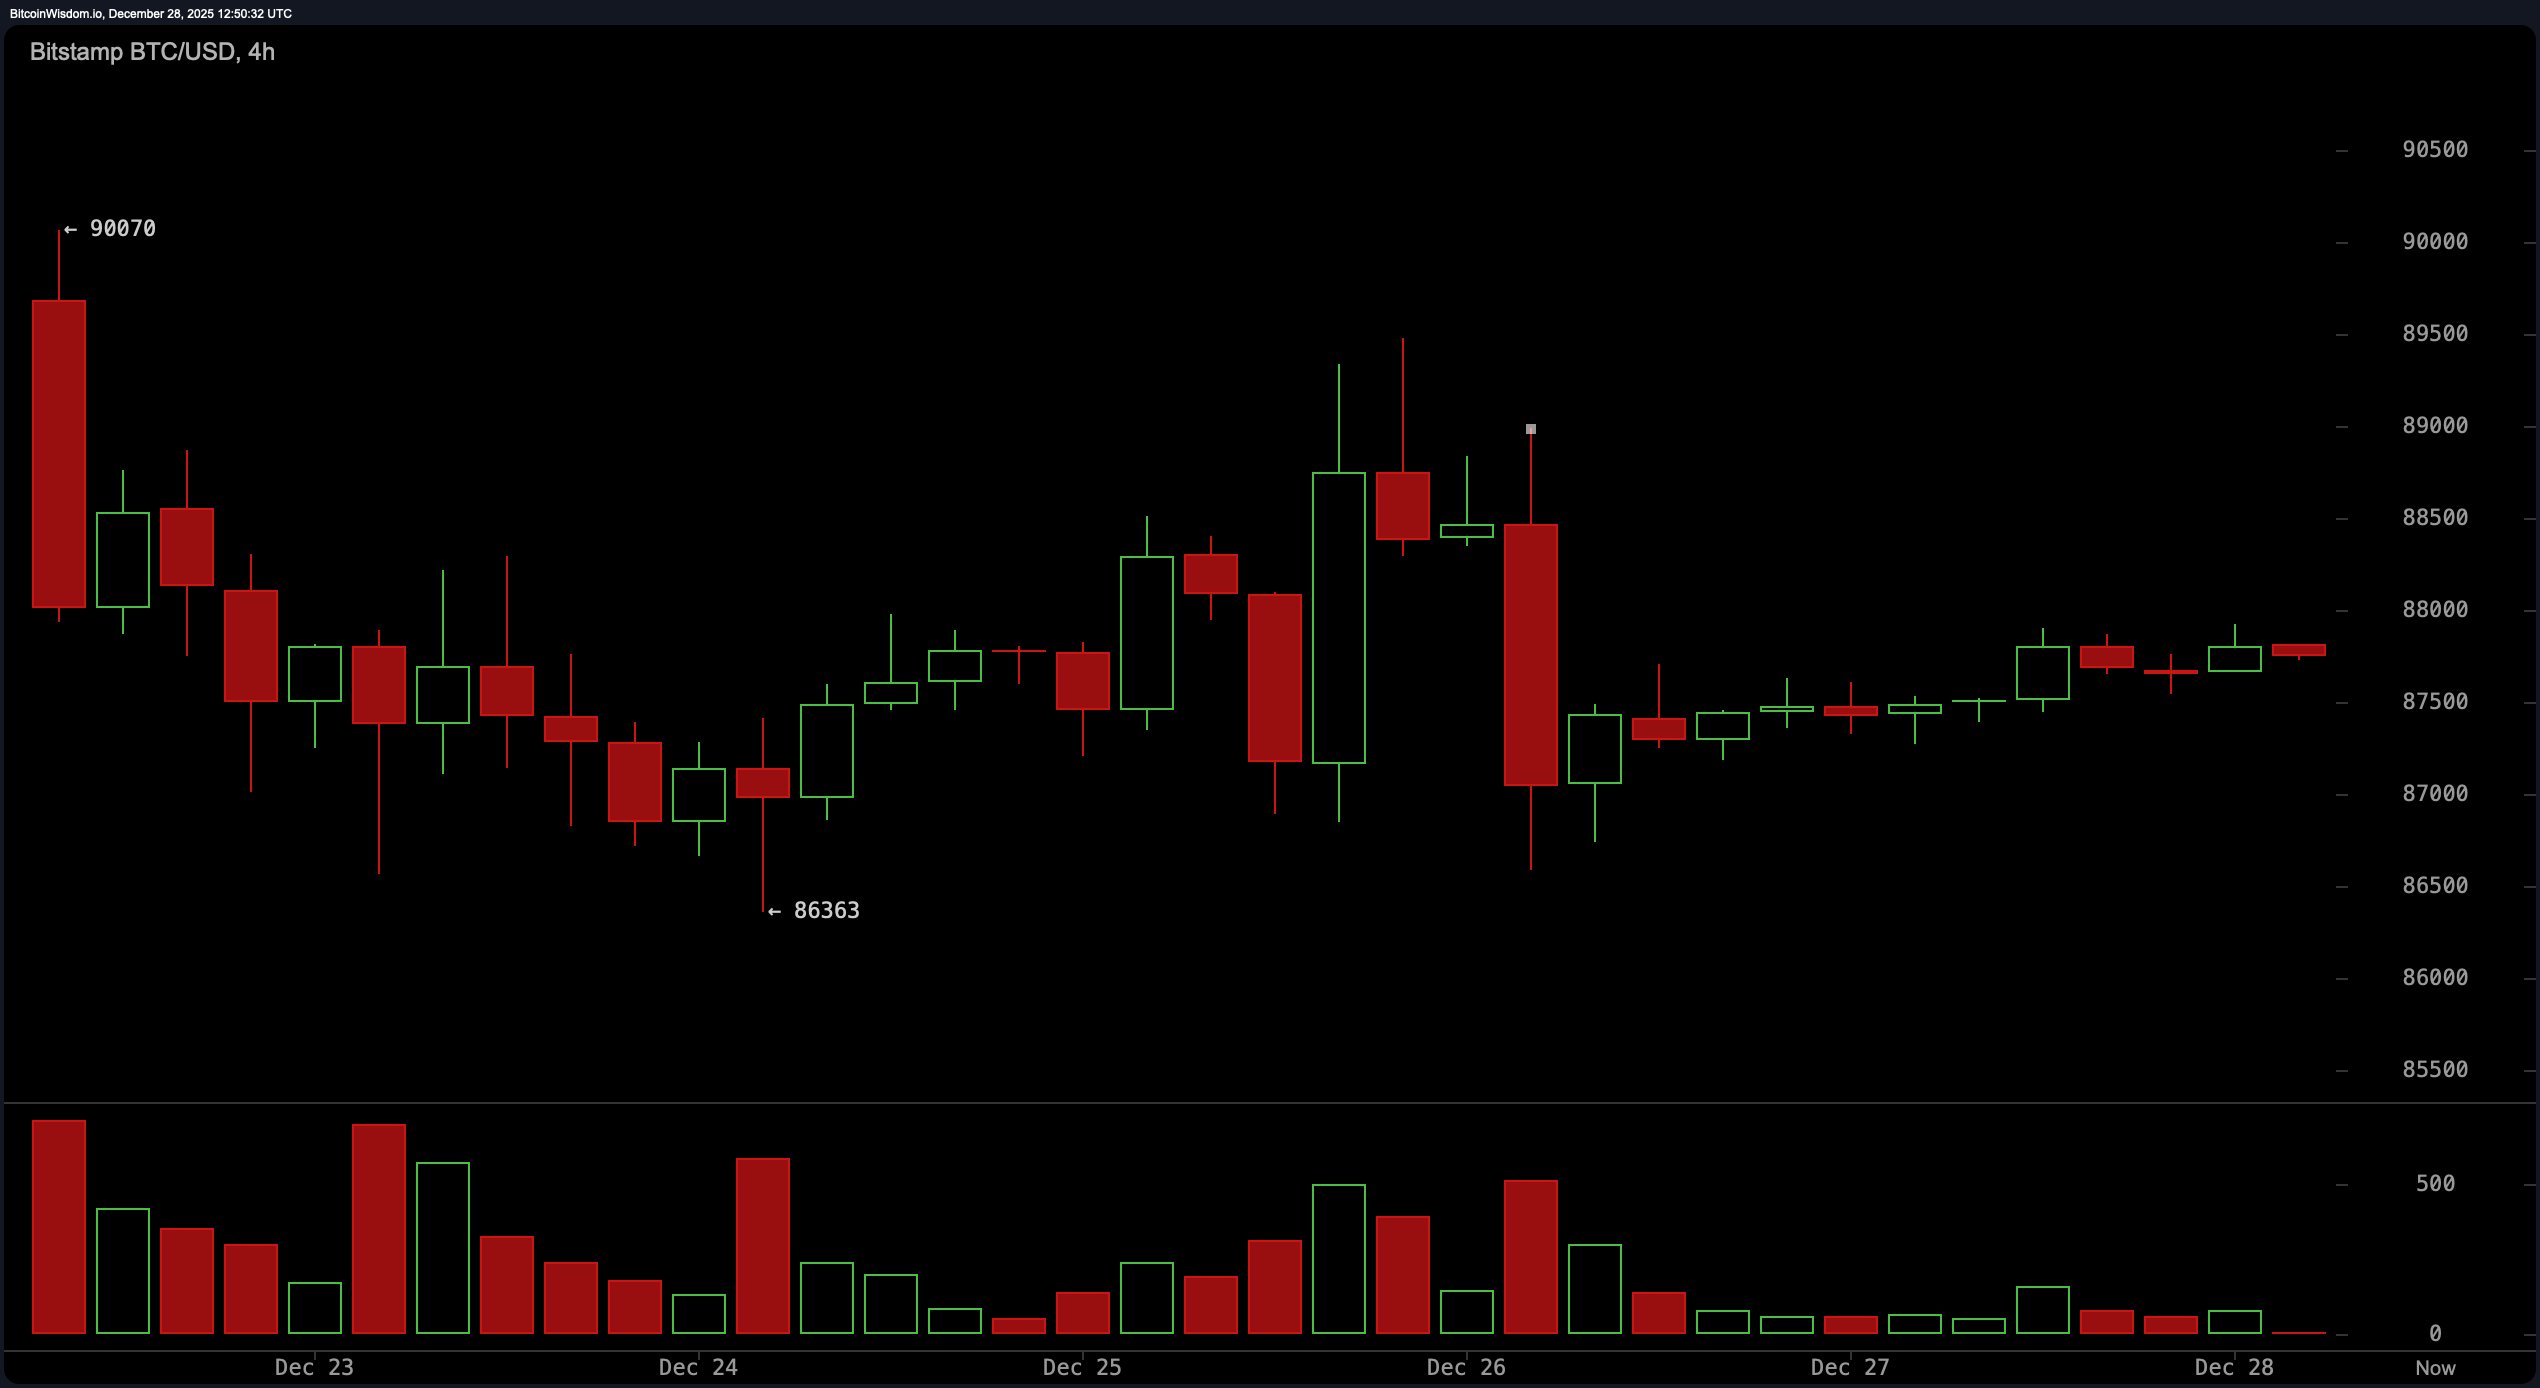
On the 4-hour chart, Bitcoin’s been bouncing like a bored ping-pong ball between $86,300 and $88,000. Volume? Dwindling faster than a New Year’s resolution. Traders eyeing $88,000 should probably grab a strong candle and a magnifying glass before diving in. The exit zone? $88,500 to $90,000, if Bitcoin can summon the energy. 🏃♂️💨
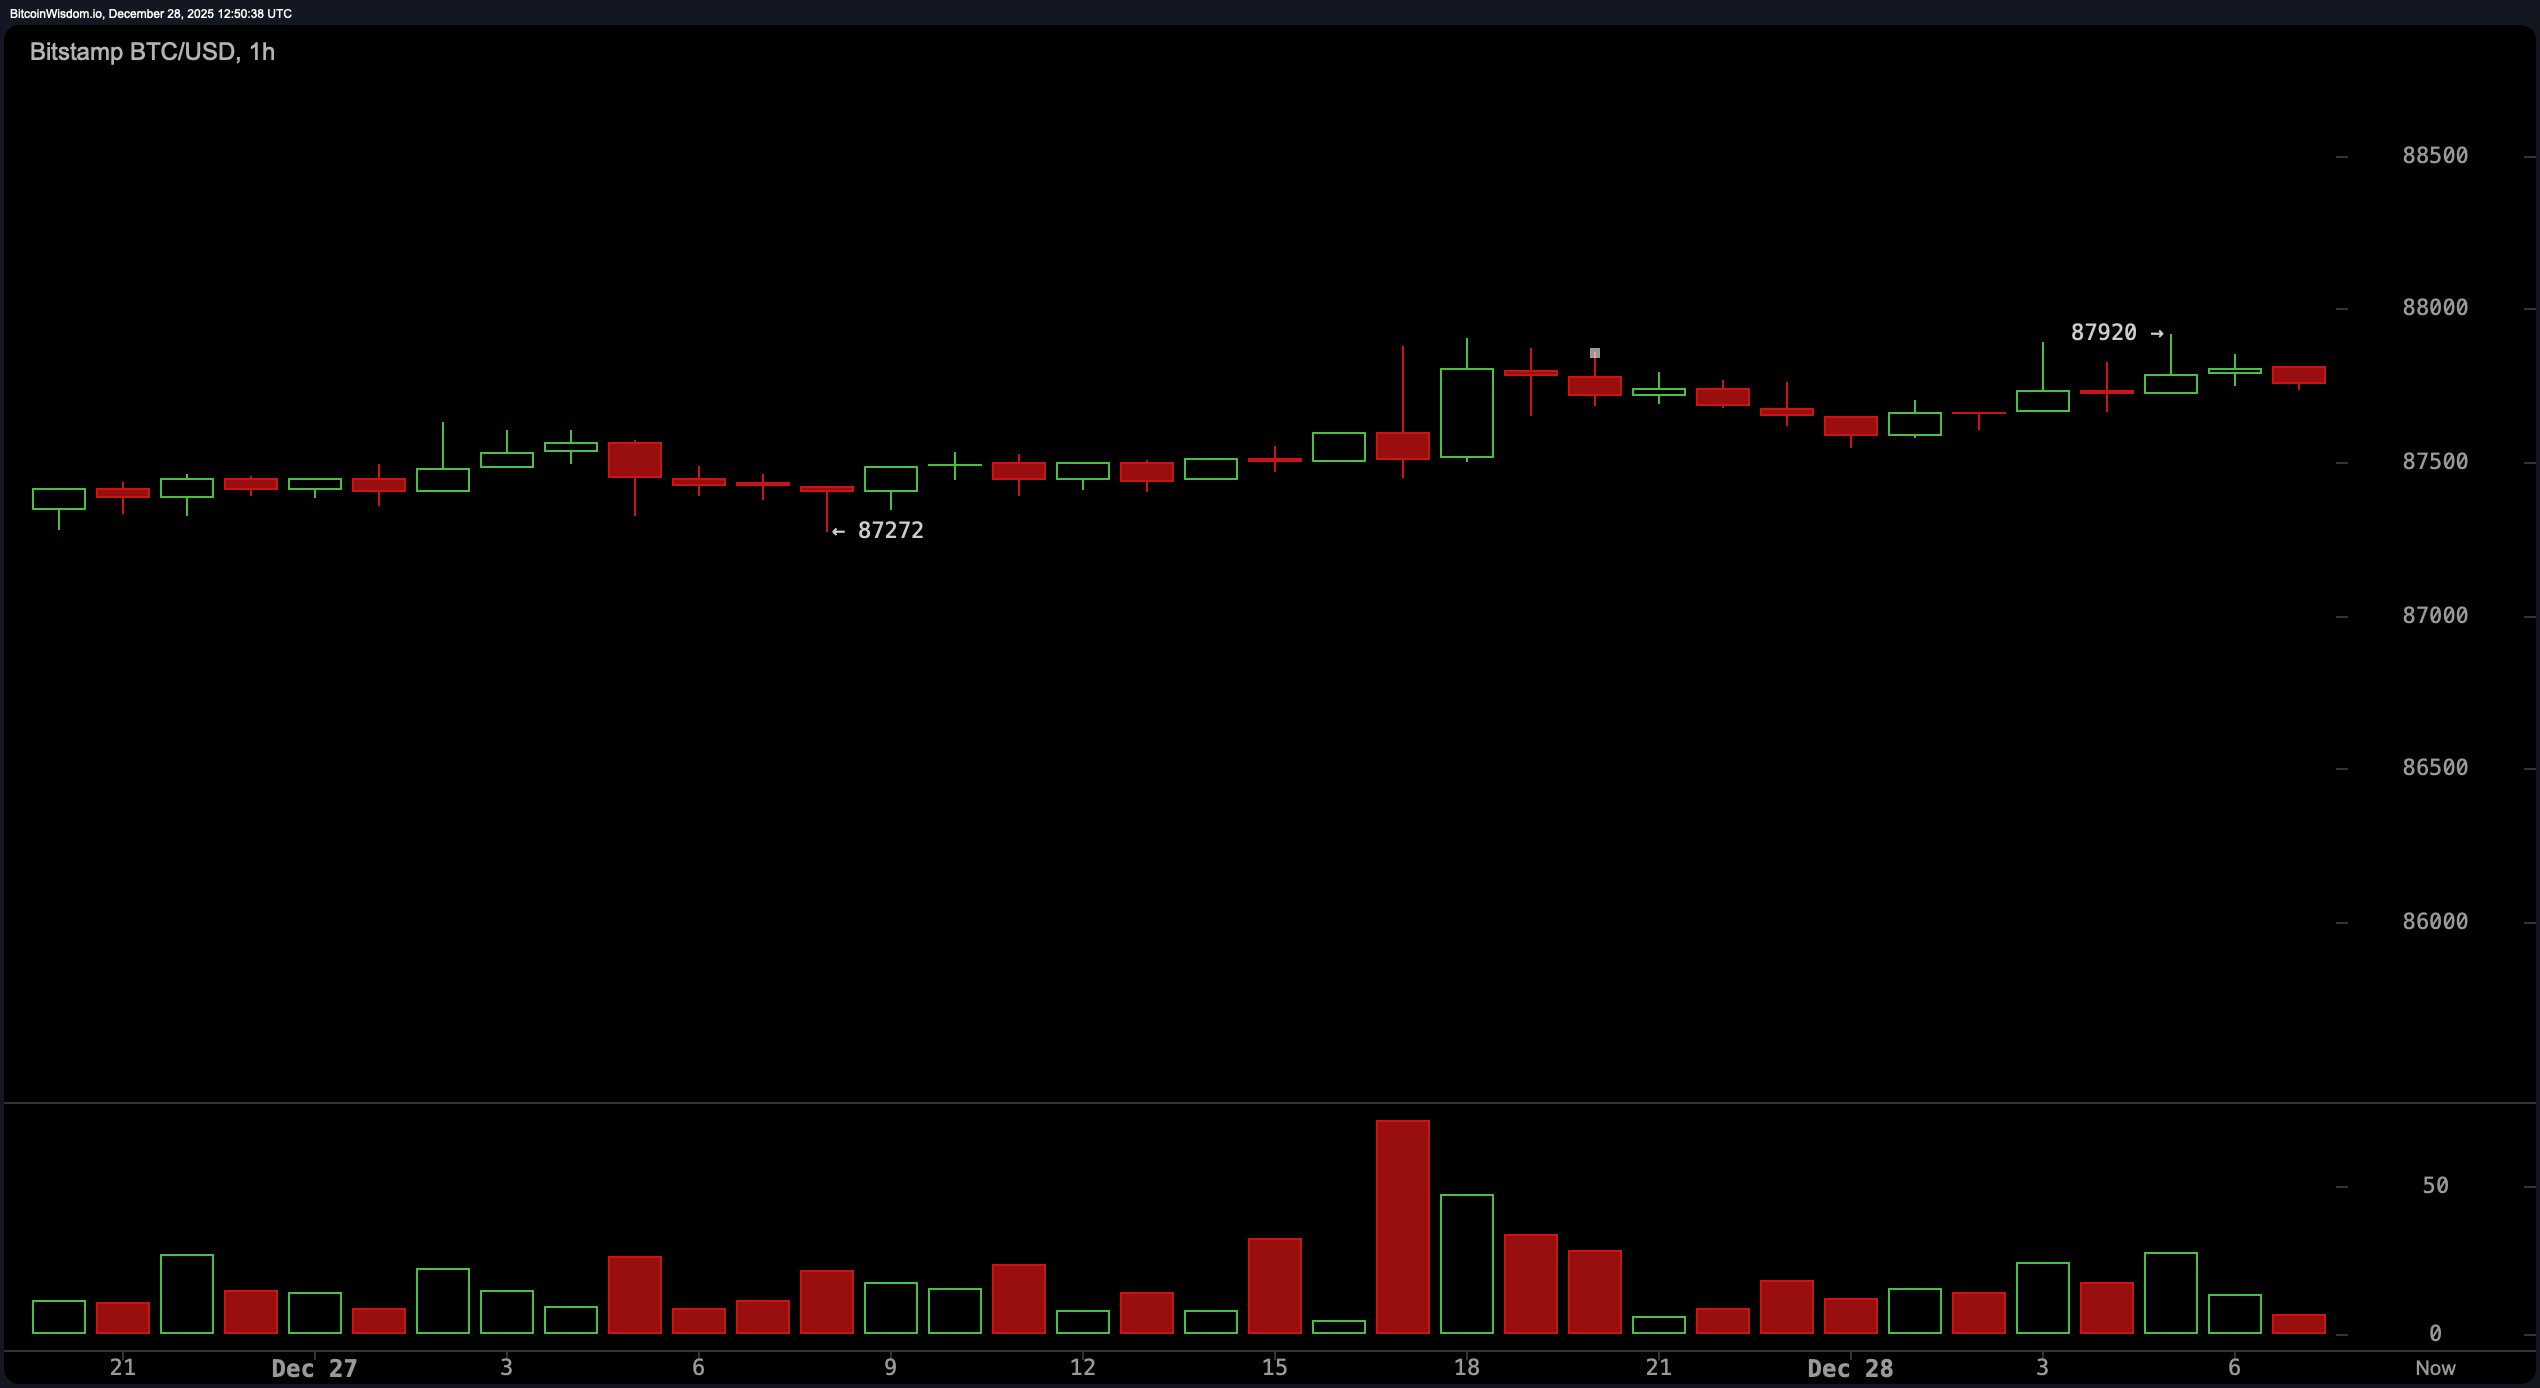
The 1-hour chart? A tight squeeze between $87,272 and $87,920. Volume? Tapering off like a forgotten New Year’s party. A breakout above $87,920 with solid volume could spark a run to $88,500, but slip below $87,200, and it’s a slide to $86,500. Dip buyers and scalpers, proceed with the precision of a cat burglar. 🐱🕶️
Oscillators? RSI at 45, Stochastic at 52, CCI at -41. It’s like the market’s having a nap. ADX at 19 confirms the trend’s as strong as a wet paper bag. Awesome Oscillator? A mild -1,693. MACD and momentum are waving tiny bullish flags, but let’s not hold our breath. 🌬️😪
Moving averages? Oh, they’re a symphony of bearishness. From the 10-period EMA at $87,784 to the 200-period SMA at $107,278, they’re all singing the same tune: “Downward, ho!” It’s like a choir of trend-followers in a minor key. Until Bitcoin proves otherwise, the trend’s as downward as a rainy Tuesday. ☔
Bull Verdict: 🐂🚀
If Bitcoin can hold above $86,500-$87,000 and reclaim $88,000 with volume, the setup favors an upside jaunt to $89,000, maybe even $94,000. Momentum’s stirring, and a breakout from this consolidation could be the next leg up in this slow-burning recovery. Or it could just be another false alarm. Who knows? 🤷♀️
Bear Verdict: 🐻⚰️
With price stuck below every major moving average and volume leaking like a sieve, the downside’s still a lurking threat. A breakdown below $87,200, followed by a dip under $86,500, could send Bitcoin tumbling toward $83,800-or worse, into the abyss. Brace yourselves. 🌋
FAQ ❓
- What’s Bitcoin’s price right now?
Bitcoin’s trading at $87,752 as of December 28, 2025. Yawn. 😴 - Is Bitcoin trending up or down today?
It’s consolidating with the enthusiasm of a sloth. No clear direction. 🦥 - What are the key support and resistance levels?
Support’s near $83,800, resistance from $88,000 to $94,600. Thrilling, I know. 🥱 - What’s the short-term outlook?
A breakout above $88,000 or a drop below $87,200 could signal the next move. Or not. 🤷
Read More
- Clash Royale Best Boss Bandit Champion decks
- Mobile Legends: Bang Bang (MLBB) Sora Guide: Best Build, Emblem and Gameplay Tips
- Vampire’s Fall 2 redeem codes and how to use them (June 2025)
- Best Hero Card Decks in Clash Royale
- Best Arena 9 Decks in Clast Royale
- Dawn Watch: Survival gift codes and how to use them (October 2025)
- Clash Royale Furnace Evolution best decks guide
- Clash Royale Witch Evolution best decks guide
- ATHENA: Blood Twins Hero Tier List
- Wuthering Waves Mornye Build Guide
2025-12-28 16:59