Bitcoin, that digital firecracker we can’t quite quit, is strutting around at $87,647 with a market cap of $1.74 trillion and a 24-hour trading volume that would make a small country blush-$19.95 billion. It danced between $85,545 and $89,111 today, leaving traders scratching their heads and caffeine levels dangerously low. Beneath the glitzy numbers, though, the story is more nuanced: resistance battles, momentum mysteries, and mixed signals aplenty. 😅
Bitcoin Chart Outlook
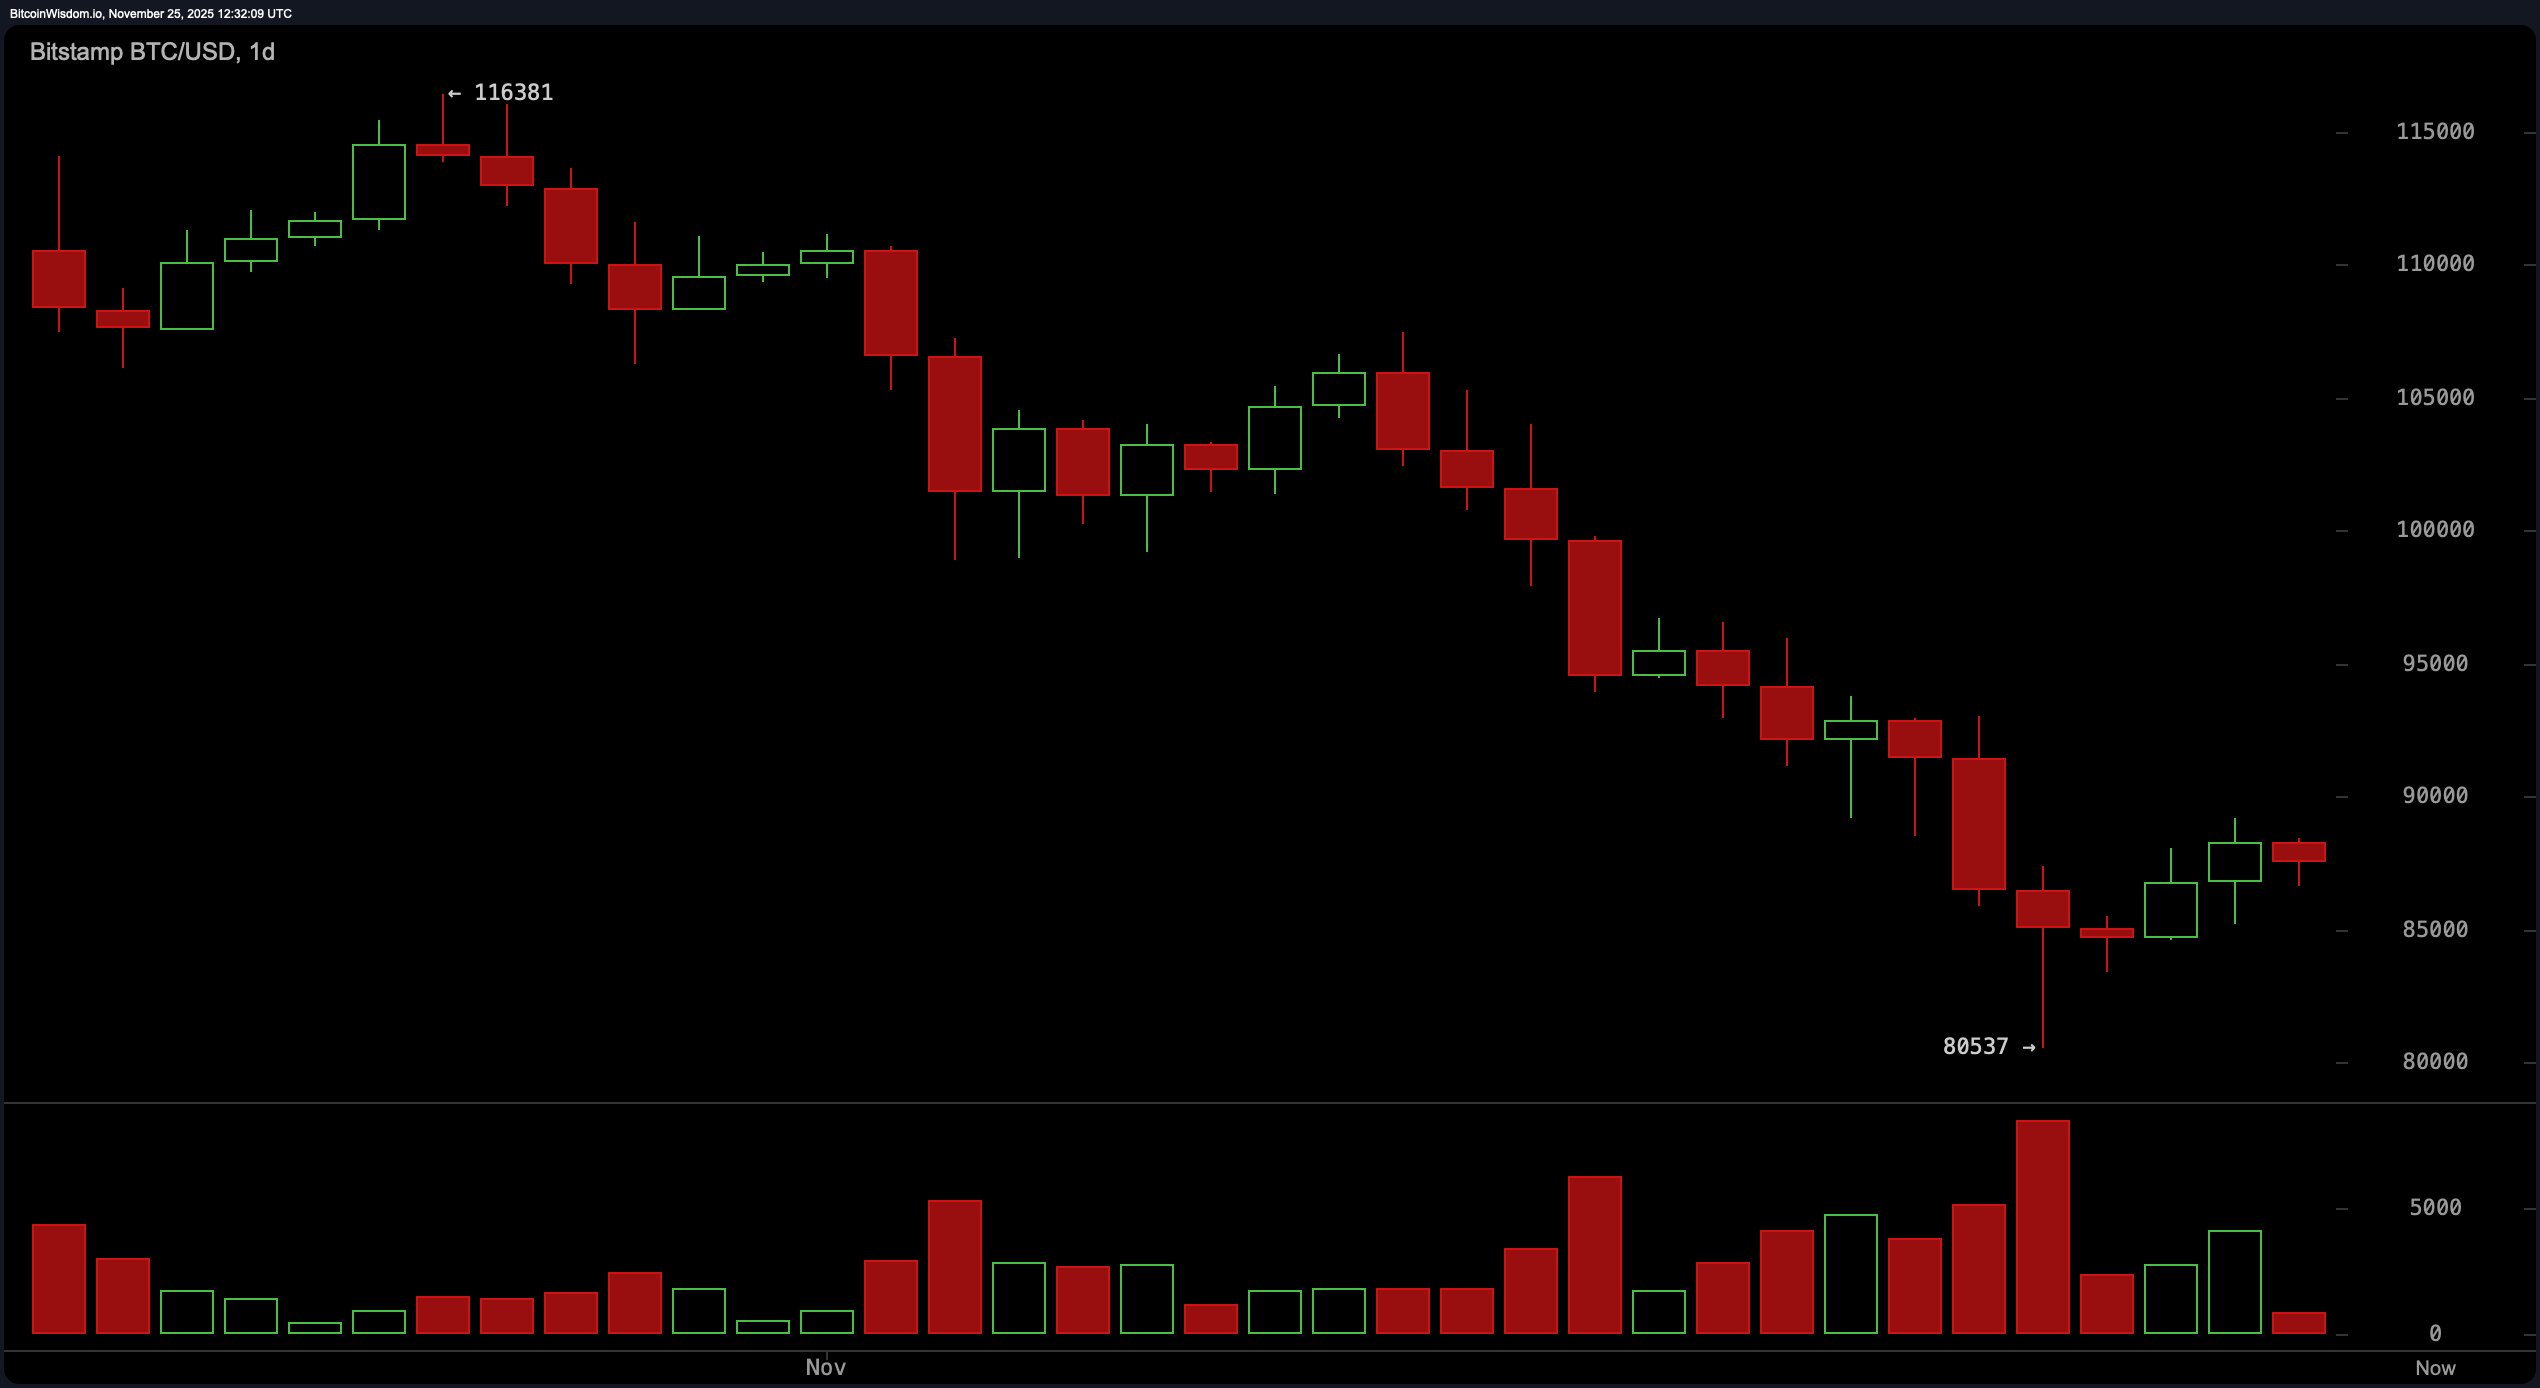
On the daily chart, bitcoin is trying to climb out of the hole it dug on its dramatic plunge from around $116,000 to just above $80,500. There’s a whiff of a relief bounce, with support hanging tight at $80,537 and resistance looming like an overbearing neighbor at $90,000. Volume perked up a tad, though let’s not start planning any parades just yet. 🎈
A mild bullish divergence-where price fell but selling volume didn’t bother to keep up-hints the bears might be running out of steam. But until $90,000 gets blown past with some real oomph, this could just be a textbook dead cat bounce trying to look fancy. 🐱
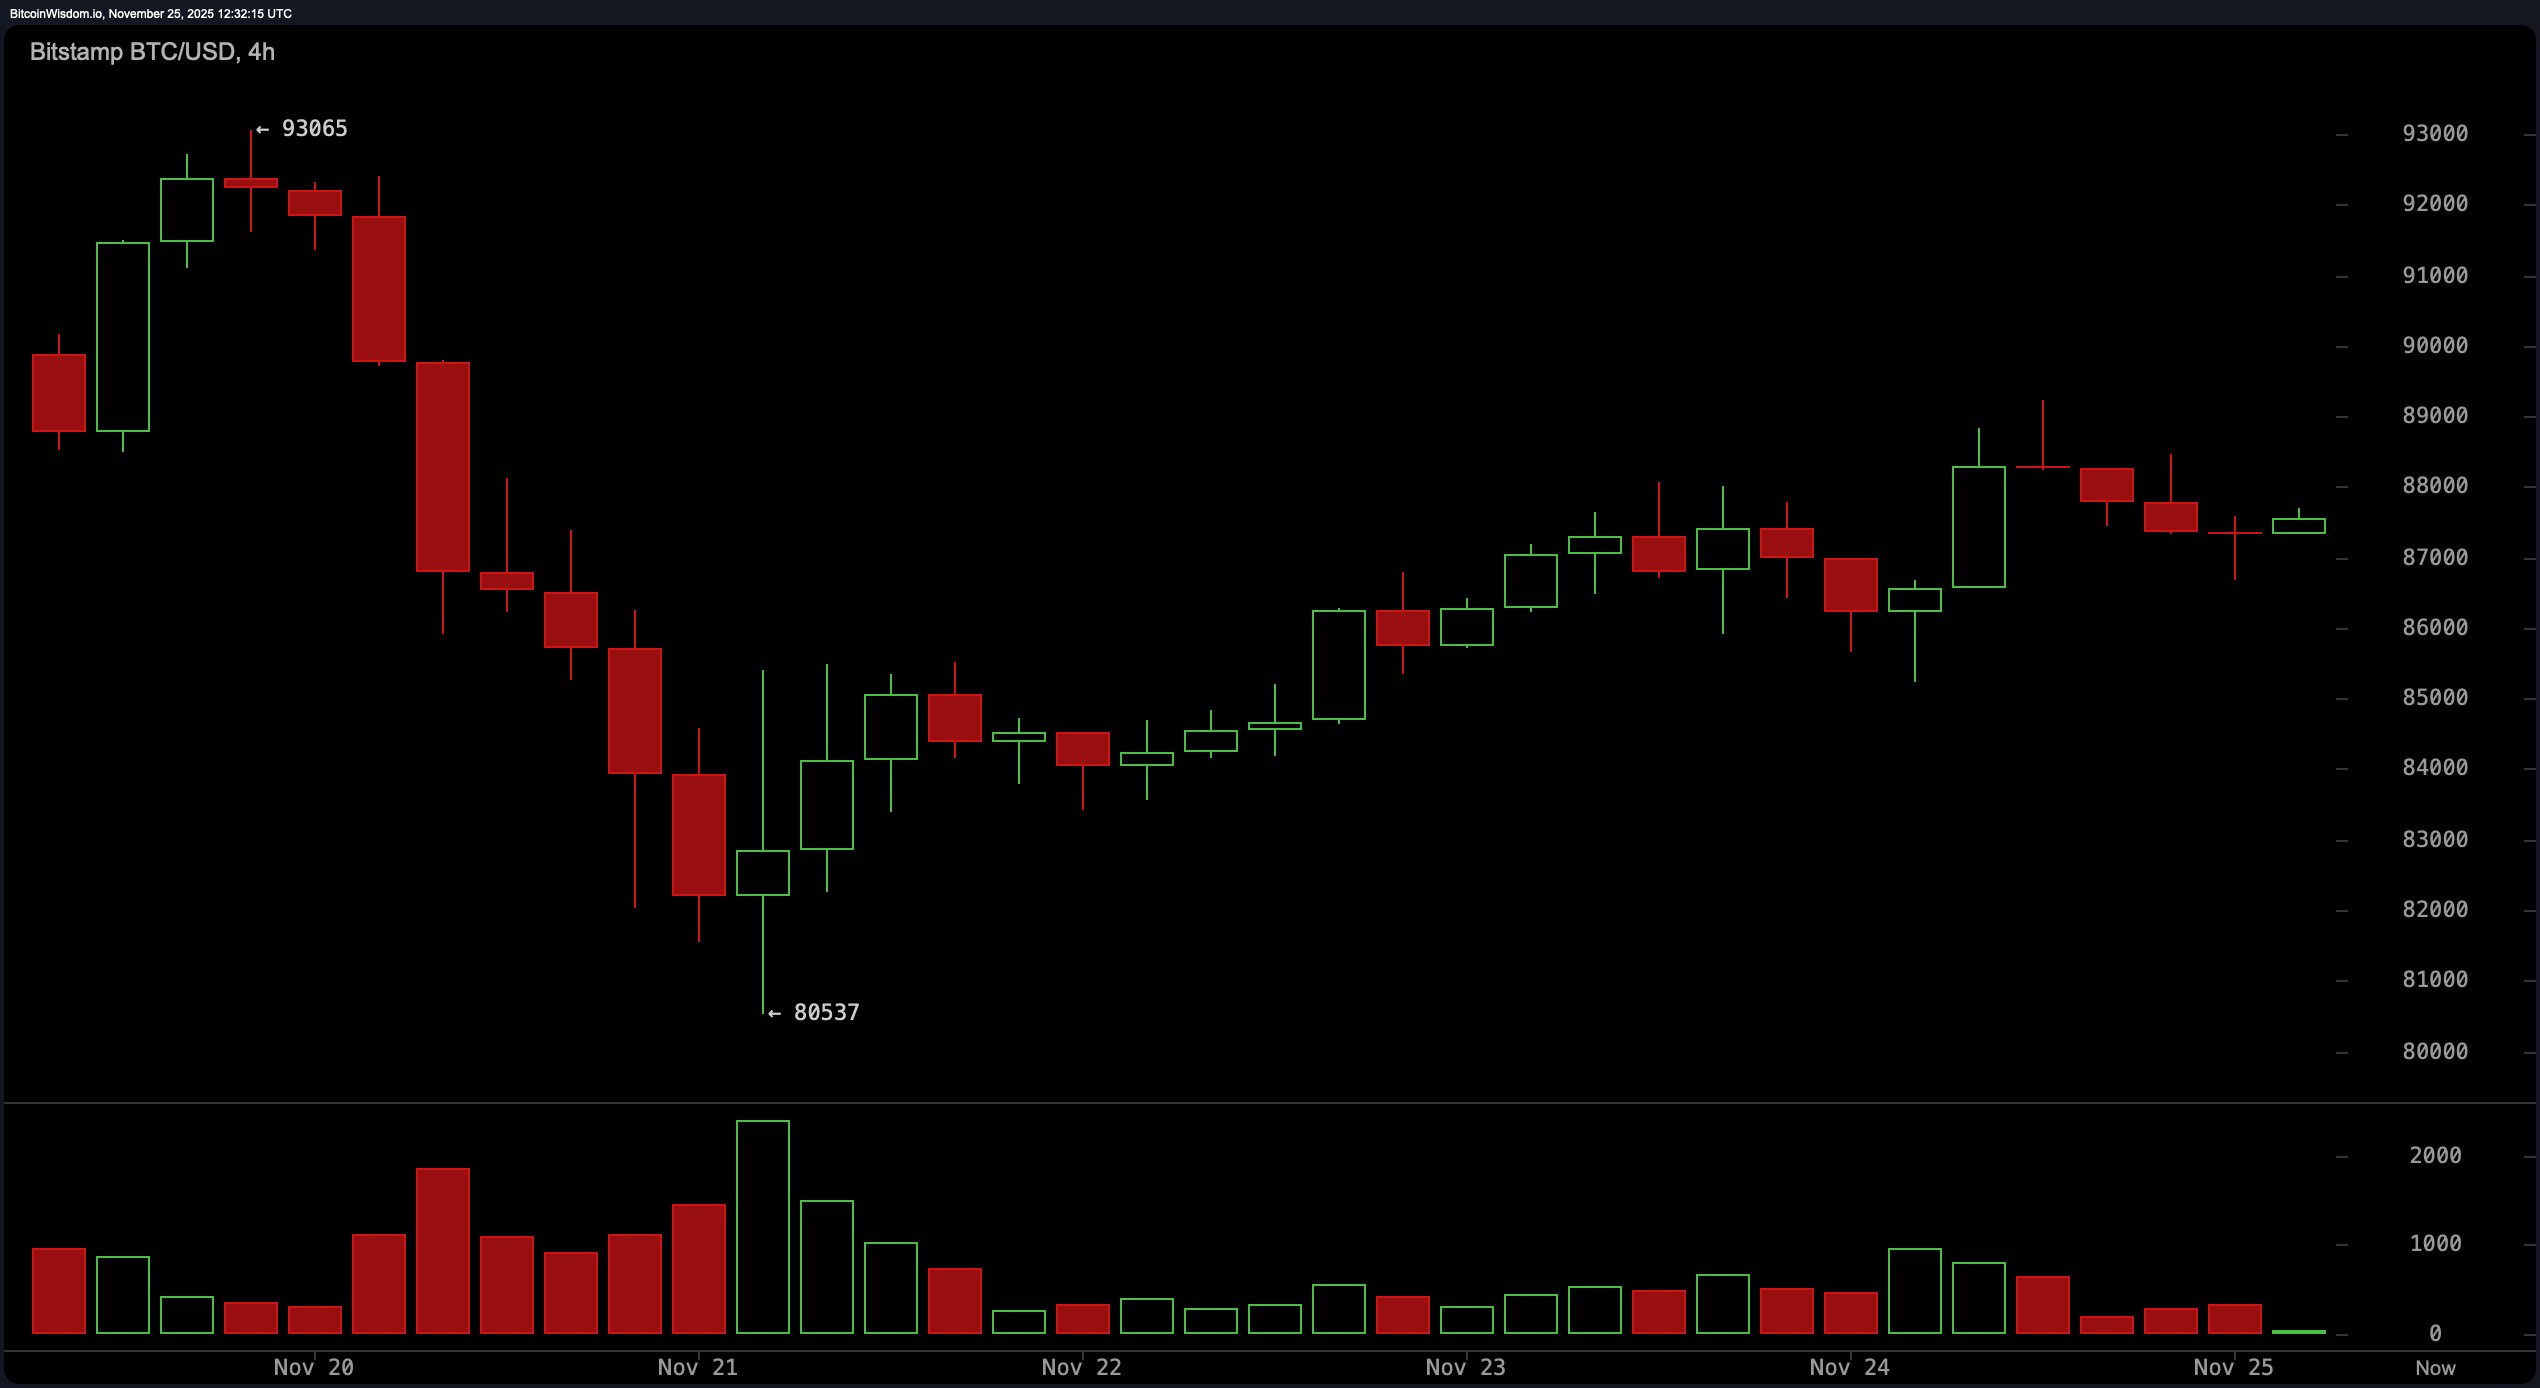
The 4-hour chart is a touch more cheerful. Since bouncing from its local low near $80,500, bitcoin carved a modest uptrend, now tiptoeing between $85,500 and the stubborn $88,500-$89,000 zone. A brief flirtation with higher volume hinted at buyer curiosity, but that excitement is fizzling like a flat soda. If this is a bull flag, it might be spicy 🌶️; if not, expect a whimper back below $85,000.
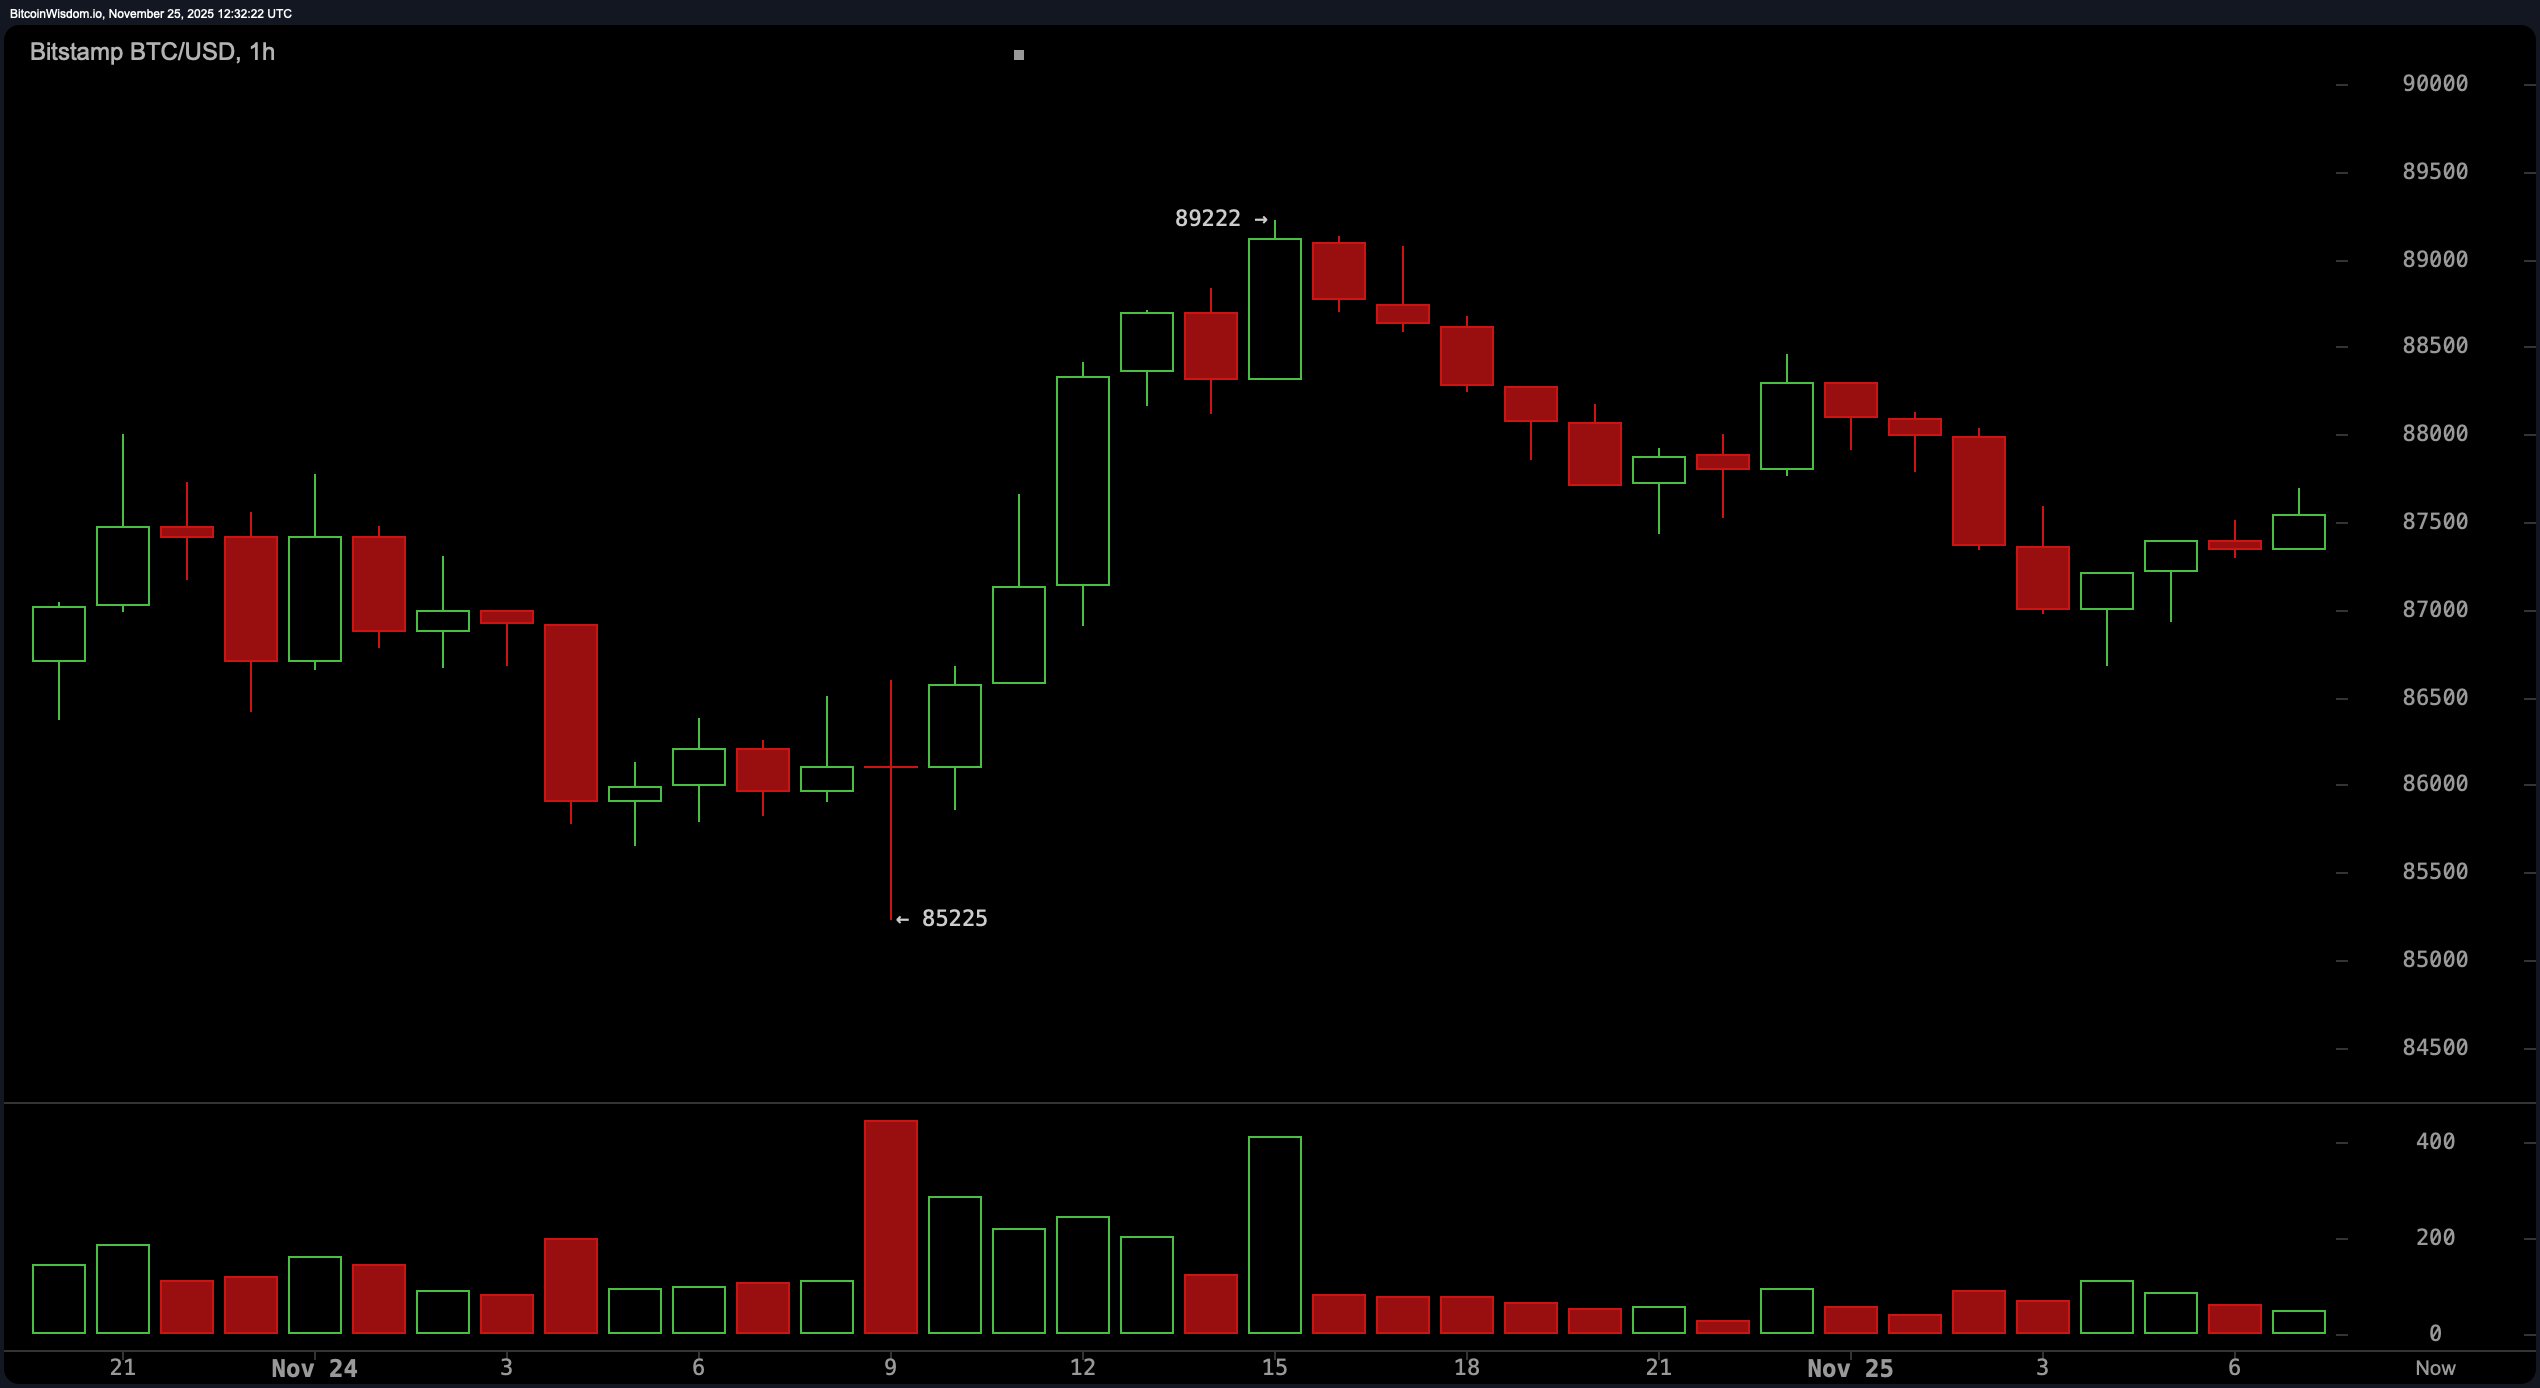
On the 1-hour stage, bitcoin is showing off higher highs and higher lows, rebounding from $85,200 like a caffeinated squirrel. Short-term support is $87,000, resistance lurks at $89,200, and volume is performing a vanishing act worthy of a magician. 🎩✨ Hold $87,000 or risk the party ending before anyone arrives.
Oscillators are about as decisive as a caffeine-deprived day trader. RSI at 32, Stochastic at 27, CCI at -81-all neutral. ADX at 46 implies a strong trend, but direction? Who knows! Momentum (-7,944) and MACD (-5,599) are still leaning negative, proving the downward force hasn’t moved out yet. 📉
Moving averages are like a red carpet for bears, stretching from the 10-period EMA at 89,603 to the 200-period SMA at 110,060. Unless bitcoin sprints past these layers, upward efforts may end in a dramatic sigh. 😬
Bull Verdict:
If bitcoin rockets past $89,000-$90,000 with volume to match, there could be a short-term trend reversal. The caveat? It must hold $87,000 and flex a little muscle above it. 💪
Bear Verdict:
With moving averages stacked ominously above and momentum still pointing south, the broader trend is bearish. Failing to conquer $90,000 convincingly risks this bounce becoming just another tease. 🐻
FAQ ❓
- What is bitcoin’s price today?
Bitcoin trades at $87,647 as of November 13, 2025. - Market cap and volume?
$1.74 trillion market cap, $19.95 billion in 24-hour volume. - Uptrend or downtrend?
Short-term consolidation, broader bearish vibes. 😬 - Key levels to watch?
$90,000 resistance, $85,000 support.
Read More
- Clash Royale Best Boss Bandit Champion decks
- Vampire’s Fall 2 redeem codes and how to use them (June 2025)
- Mobile Legends January 2026 Leaks: Upcoming new skins, heroes, events and more
- World Eternal Online promo codes and how to use them (September 2025)
- Clash Royale Season 79 “Fire and Ice” January 2026 Update and Balance Changes
- Best Arena 9 Decks in Clast Royale
- Best Hero Card Decks in Clash Royale
- Clash Royale Furnace Evolution best decks guide
- FC Mobile 26: EA opens voting for its official Team of the Year (TOTY)
- Clash Royale Witch Evolution best decks guide
2025-11-25 16:58