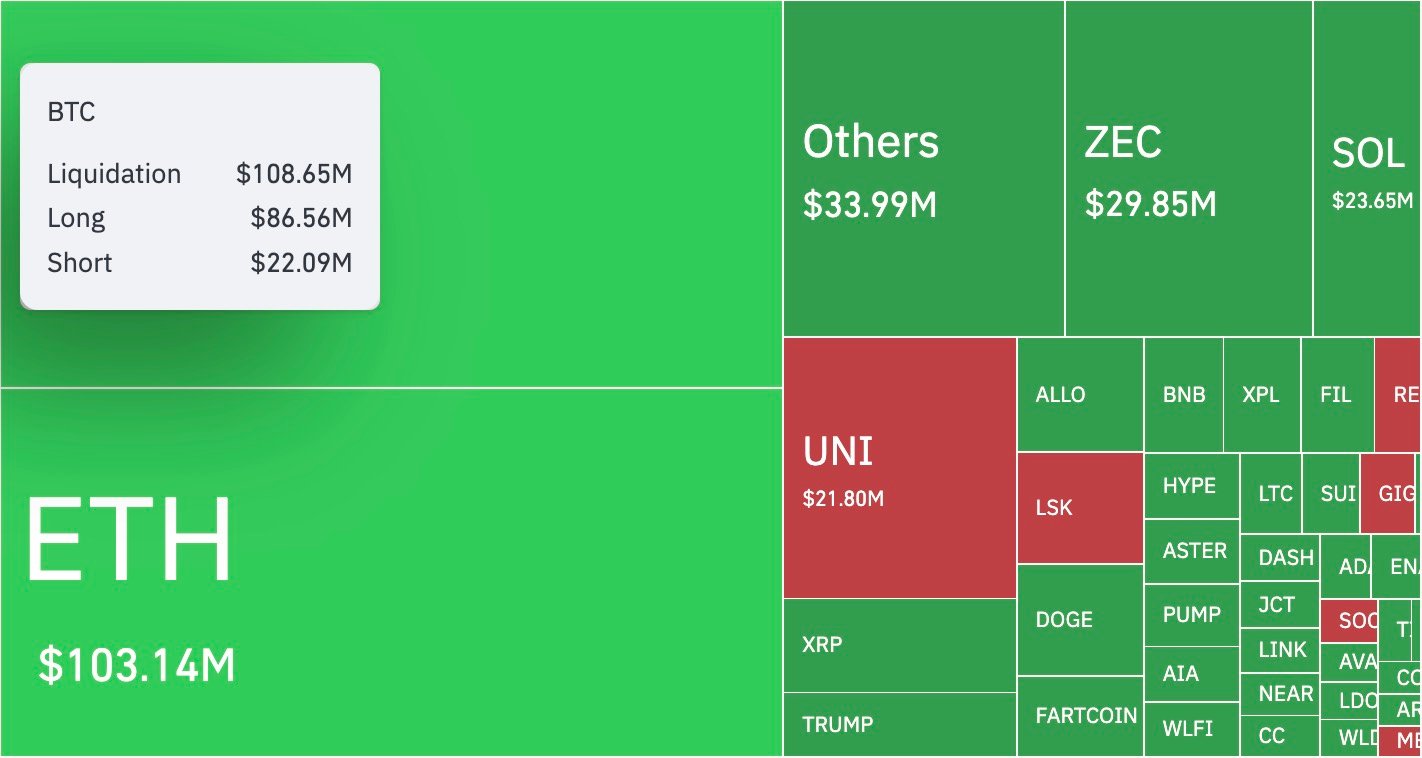
Good heavens, what a tumultuous morning it is for the dear souls entangled in the web of cryptocurrency! As the sun rises on this fine Wednesday, Bitcoin, that most fickle of suitors, finds itself at a modest $104,100, having endured a most unseemly 24 hours of forced selling. A staggering $408 million in positions has been erased, and the total open interest has been trimmed by nearly $1 billion. Ethereum, too, has not escaped unscathed, with liquidations amounting to $103 million, a clear indication of broader distress in the altcoin realm. 🌪️
And what of XRP, that once-promising darling of the crypto ball? It lingers flatly around $2.40, though several ETFs are expected to begin trading this week. Yet, the poor dear faces technical pressure from the Bollinger Bands, which, as we all know, are prone to breaking violently. The indicators on the daily and weekly frames suggest that buyers are losing their grip near the $2.40-$2.50 ceiling. One can almost hear the whispers of doom: “Prepare for a drop under $2 before the month’s end!” 😱
TL;DR
- XRP’s setup hints at a drop below $2 if the midband fails again. 🙈
- Bitcoin exhibits a 400% long-to-short liquidation imbalance, totaling $408 million. 💥
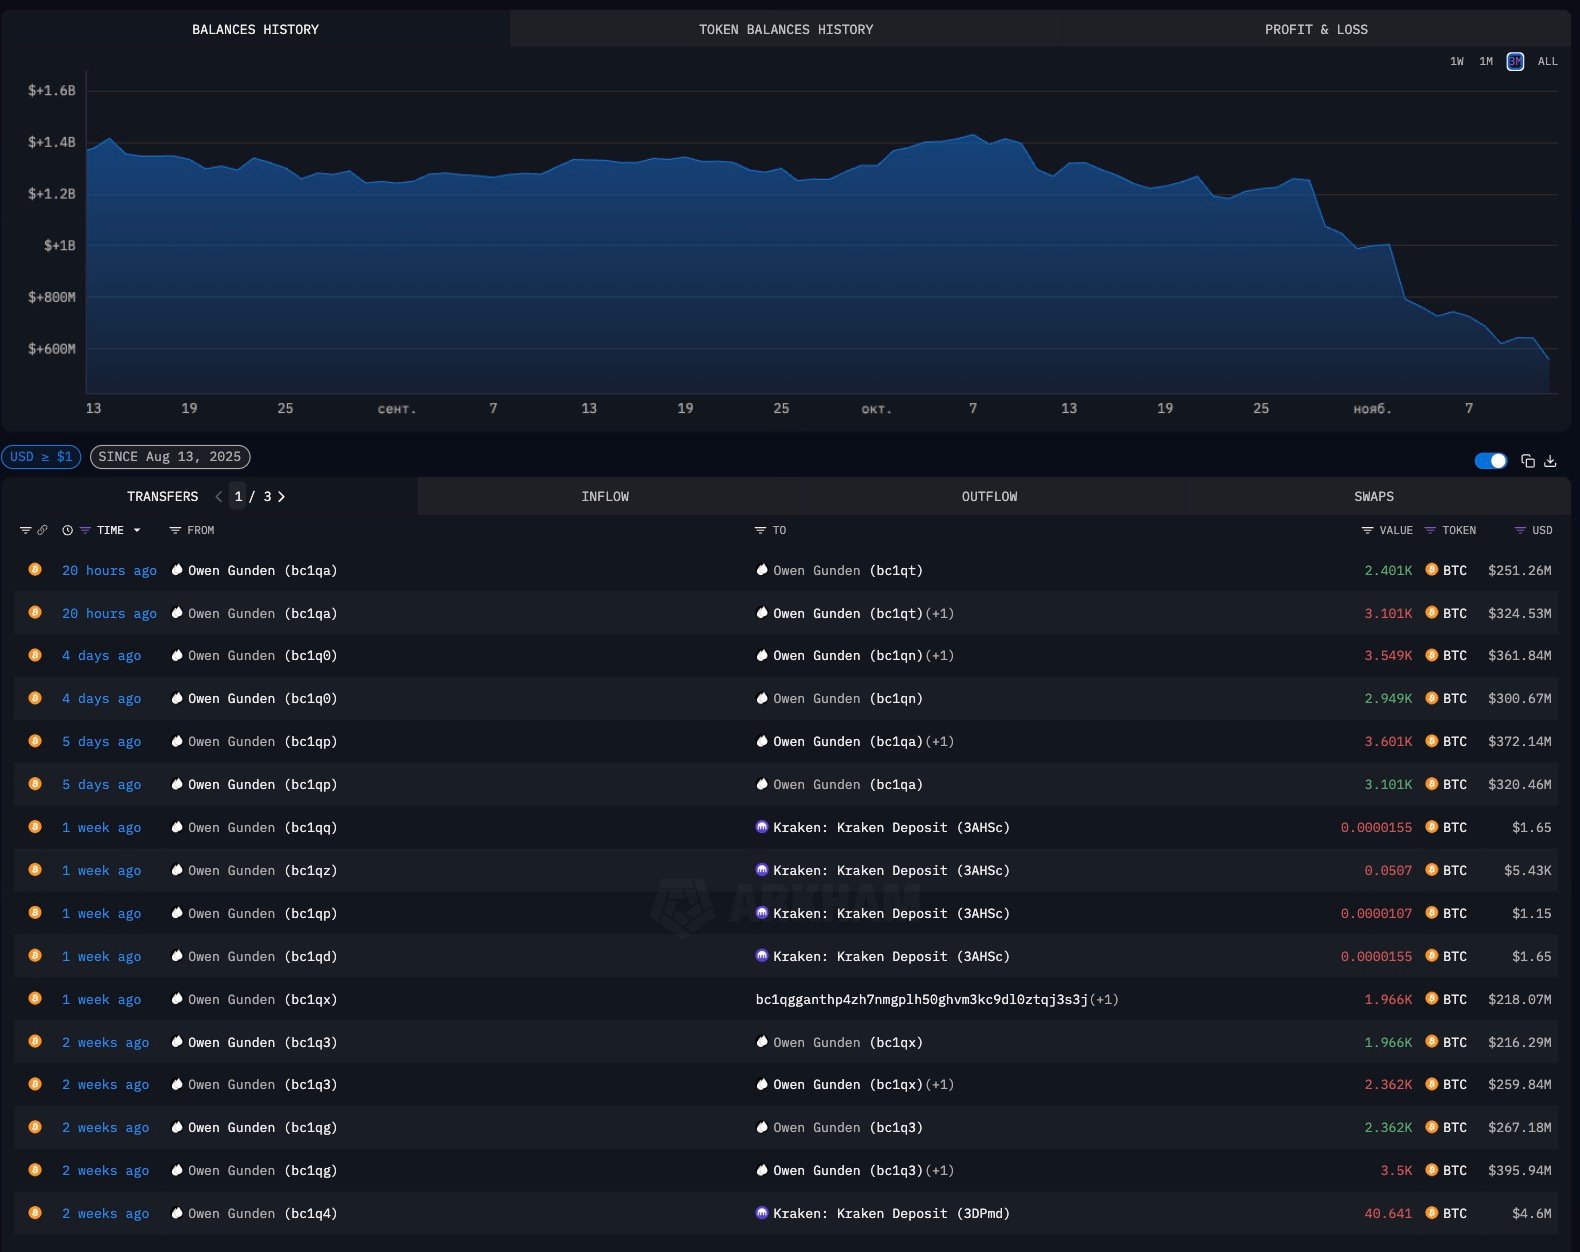
- Satoshi-era whale Owen Gunden has cashed out approximately $1.5 billion in BTC after 15 years of silence. 🐳
XRP’s Perilous Dance with the Bollinger Bands
Upon examining the daily chart, one observes XRP trading within a range of $2.17 to $2.70, with the price steadfastly holding at the midpoint of $2.44. Each retest of this line has been rejected for three weeks straight-a most unwelcome pattern. The lower band rests at $2.17; should it break, there is ample room for a descent to $1.94 or even $1.80. The weekly structure remains bearish, with the price languishing below its 20-week moving average at $2.82. Until a strong close above $2.55 appears, the short-term bias remains decidedly negative. ☠️
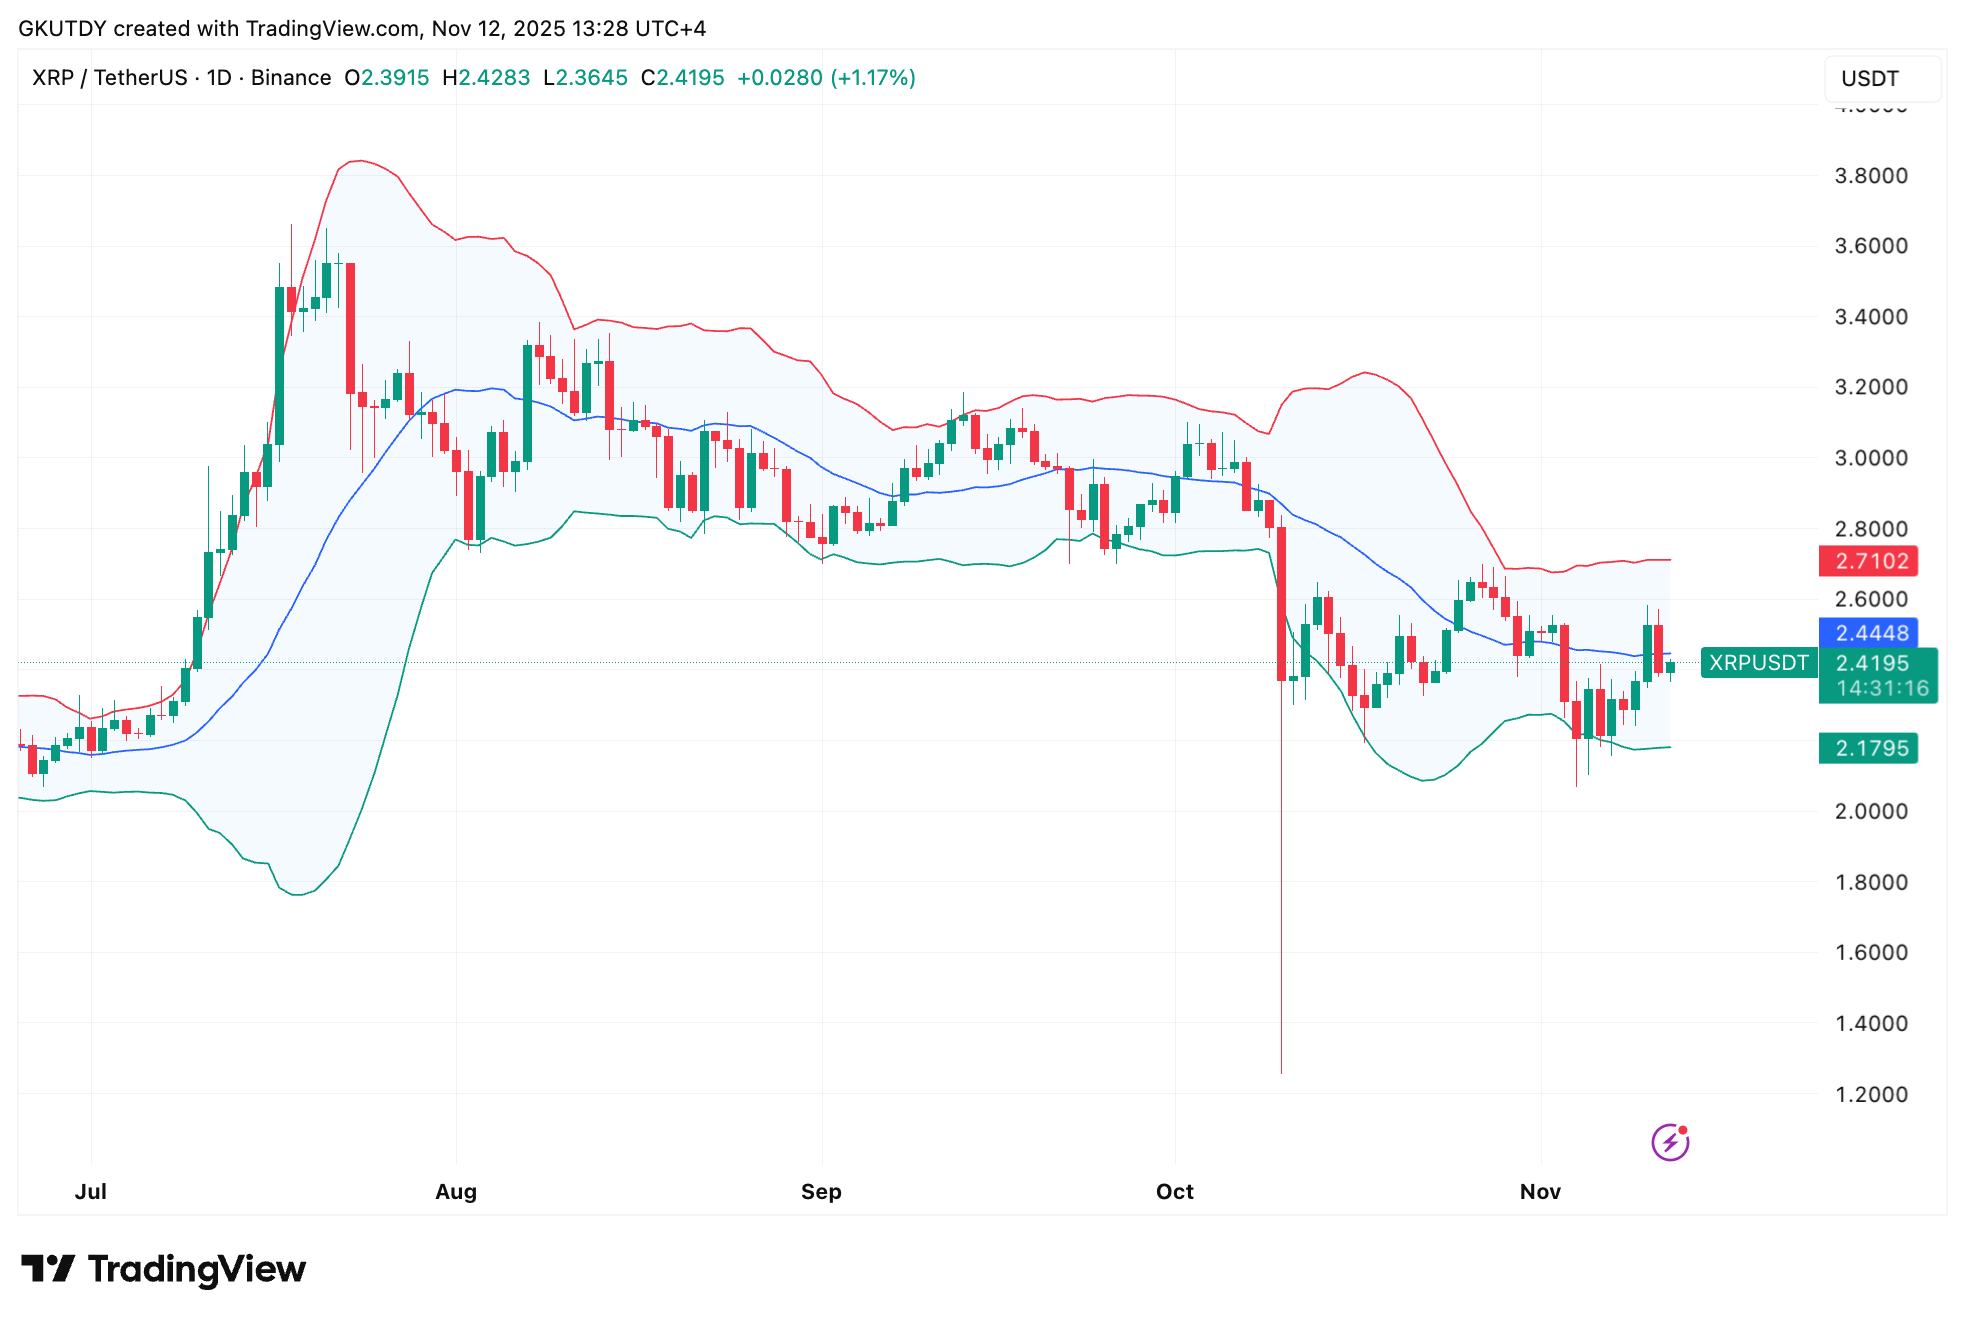
In the monthly view, XRP has printed two lower highs since its July peak at $3.40. The current candle is down 4% and sits precariously on the 20-month average near $2.40. Should this month close below that line, it is likely the market will continue its downward spiral toward the $1.70-$1.80 zone. The range of prices has reached its lowest point since the first quarter of 2024, a compression that historically precedes moves of 25-40% in mere weeks. Thus, if the next leg breaks south, the chart points to targets of $1.92 in the short term and $1.65 in the medium term. 🌀
Bitcoin’s Liquidation Imbalance: A Tale of Woe
CoinGlass’s data reveals that $408.13 million was liquidated in 24 hours-$321.26 million from longs versus $86.87 million from shorts, a ratio of approximately 4 to 1. BTC alone accounted for $108.65 million of these losses, with $86.56 million from longs and $22.09 million from shorts. Ethereum added another $103 million, while ZEC and SOL saw $29.8 million and $23.6 million, respectively. The sell-off commenced late Tuesday when BTC fell through $105,000, triggering stop-losses around $104,500. Prices plummeted to $103,000 before recovering to $104,100. Funding rates have since dropped by half, a sign that excessive leverage has finally been cleared. 📉
Should Bitcoin fail to maintain its position above $103,000, another wave of liquidations could strike the $101,500 and $99,000 zones-the next major liquidity pools. However, a close above $105,500 could lead to short covering toward $108,000. The market’s pain has been reset, and a bounce back over the weekend is possible, provided macro data does not deliver any shocks to risk assets. 🌟
A Whale’s Exit: Owen Gunden’s $1.5 Billion Farewell
Arkham data discloses that early miner Owen Gunden has sold most of his long-dormant holdings-approximately 5,350 BTC, valued at about $1.5 billion at current prices. Transfers to Kraken and several OTC desks have occurred over the past two weeks. His wallet balance has plummeted from $1.4 billion to $556 million, with the remaining coins priced at $104,924 each. This marks one of the largest movements of pre-2011 BTC ever recorded. Speculation abounds regarding the reasons for the sale, from quantum security concerns to tax-year rebalancing. Whatever the cause, a 15-year holder cashing out at the cycle peak adds psychological pressure and may signal an intermediate top forming around $107,000-$110,000. Should follow-through selling from similar vintage wallets emerge, Bitcoin could revisit its September base around $95,000 before new institutional demand absorbs the supply. 🐋
Crypto Market Outlook: Volatility Ahead
The mid-November setup suggests more volatility before matters settle, particularly with this Friday’s U.S. PPI print potentially altering market sentiment. Here are the key levels to watch:
XRP: Key trigger at $2.18; losing it unlocks the $1.80-$1.92 zone. 🚨
BTC: Defend $103,000 or risk another $99,000 sweep; upside capped at $108,000. ⚔️
ETH: Stable above $3,000, but a break below $2,940 opens a short window. 🛡️
At present, derivatives leverage is being burned off, whale wallets are in motion, and the market appears poised for one more flush before any December rally attempt. Fasten your bonnets, dear readers, for the crypto seas remain most turbulent! 🌊
Read More
- Clash Royale Best Boss Bandit Champion decks
- Vampire’s Fall 2 redeem codes and how to use them (June 2025)
- World Eternal Online promo codes and how to use them (September 2025)
- Best Arena 9 Decks in Clast Royale
- How to find the Roaming Oak Tree in Heartopia
- Country star who vanished from the spotlight 25 years ago resurfaces with viral Jessie James Decker duet
- Mobile Legends January 2026 Leaks: Upcoming new skins, heroes, events and more
- Solo Leveling Season 3 release date and details: “It may continue or it may not. Personally, I really hope that it does.”
- ATHENA: Blood Twins Hero Tier List
- Kingdoms of Desire turns the Three Kingdoms era into an idle RPG power fantasy, now globally available
2025-11-12 13:33