Imagine waking up to a number that sounds like a fancy steak dinner—$109,748 to $109,818—and thinking, “Well, at least it’s not less than yesterday.” As of 9:15 a.m. ET on Tuesday, June 10, 2025—yes, we are living in a future where Bitcoin is just casually hanging out around a hundred and nine thousand—its market cap hit a shiny $2.18 trillion, which is a lot of zeros to keep track of. The 24-hour trading volume? A breezy $38.10 billion. The price lately has been doing the rollercoaster jig between $107,115 and $110,282, so basically, it’s as calm as a cat in a room full of rocking chairs—volatile with a side of resistance.
Bitcoin
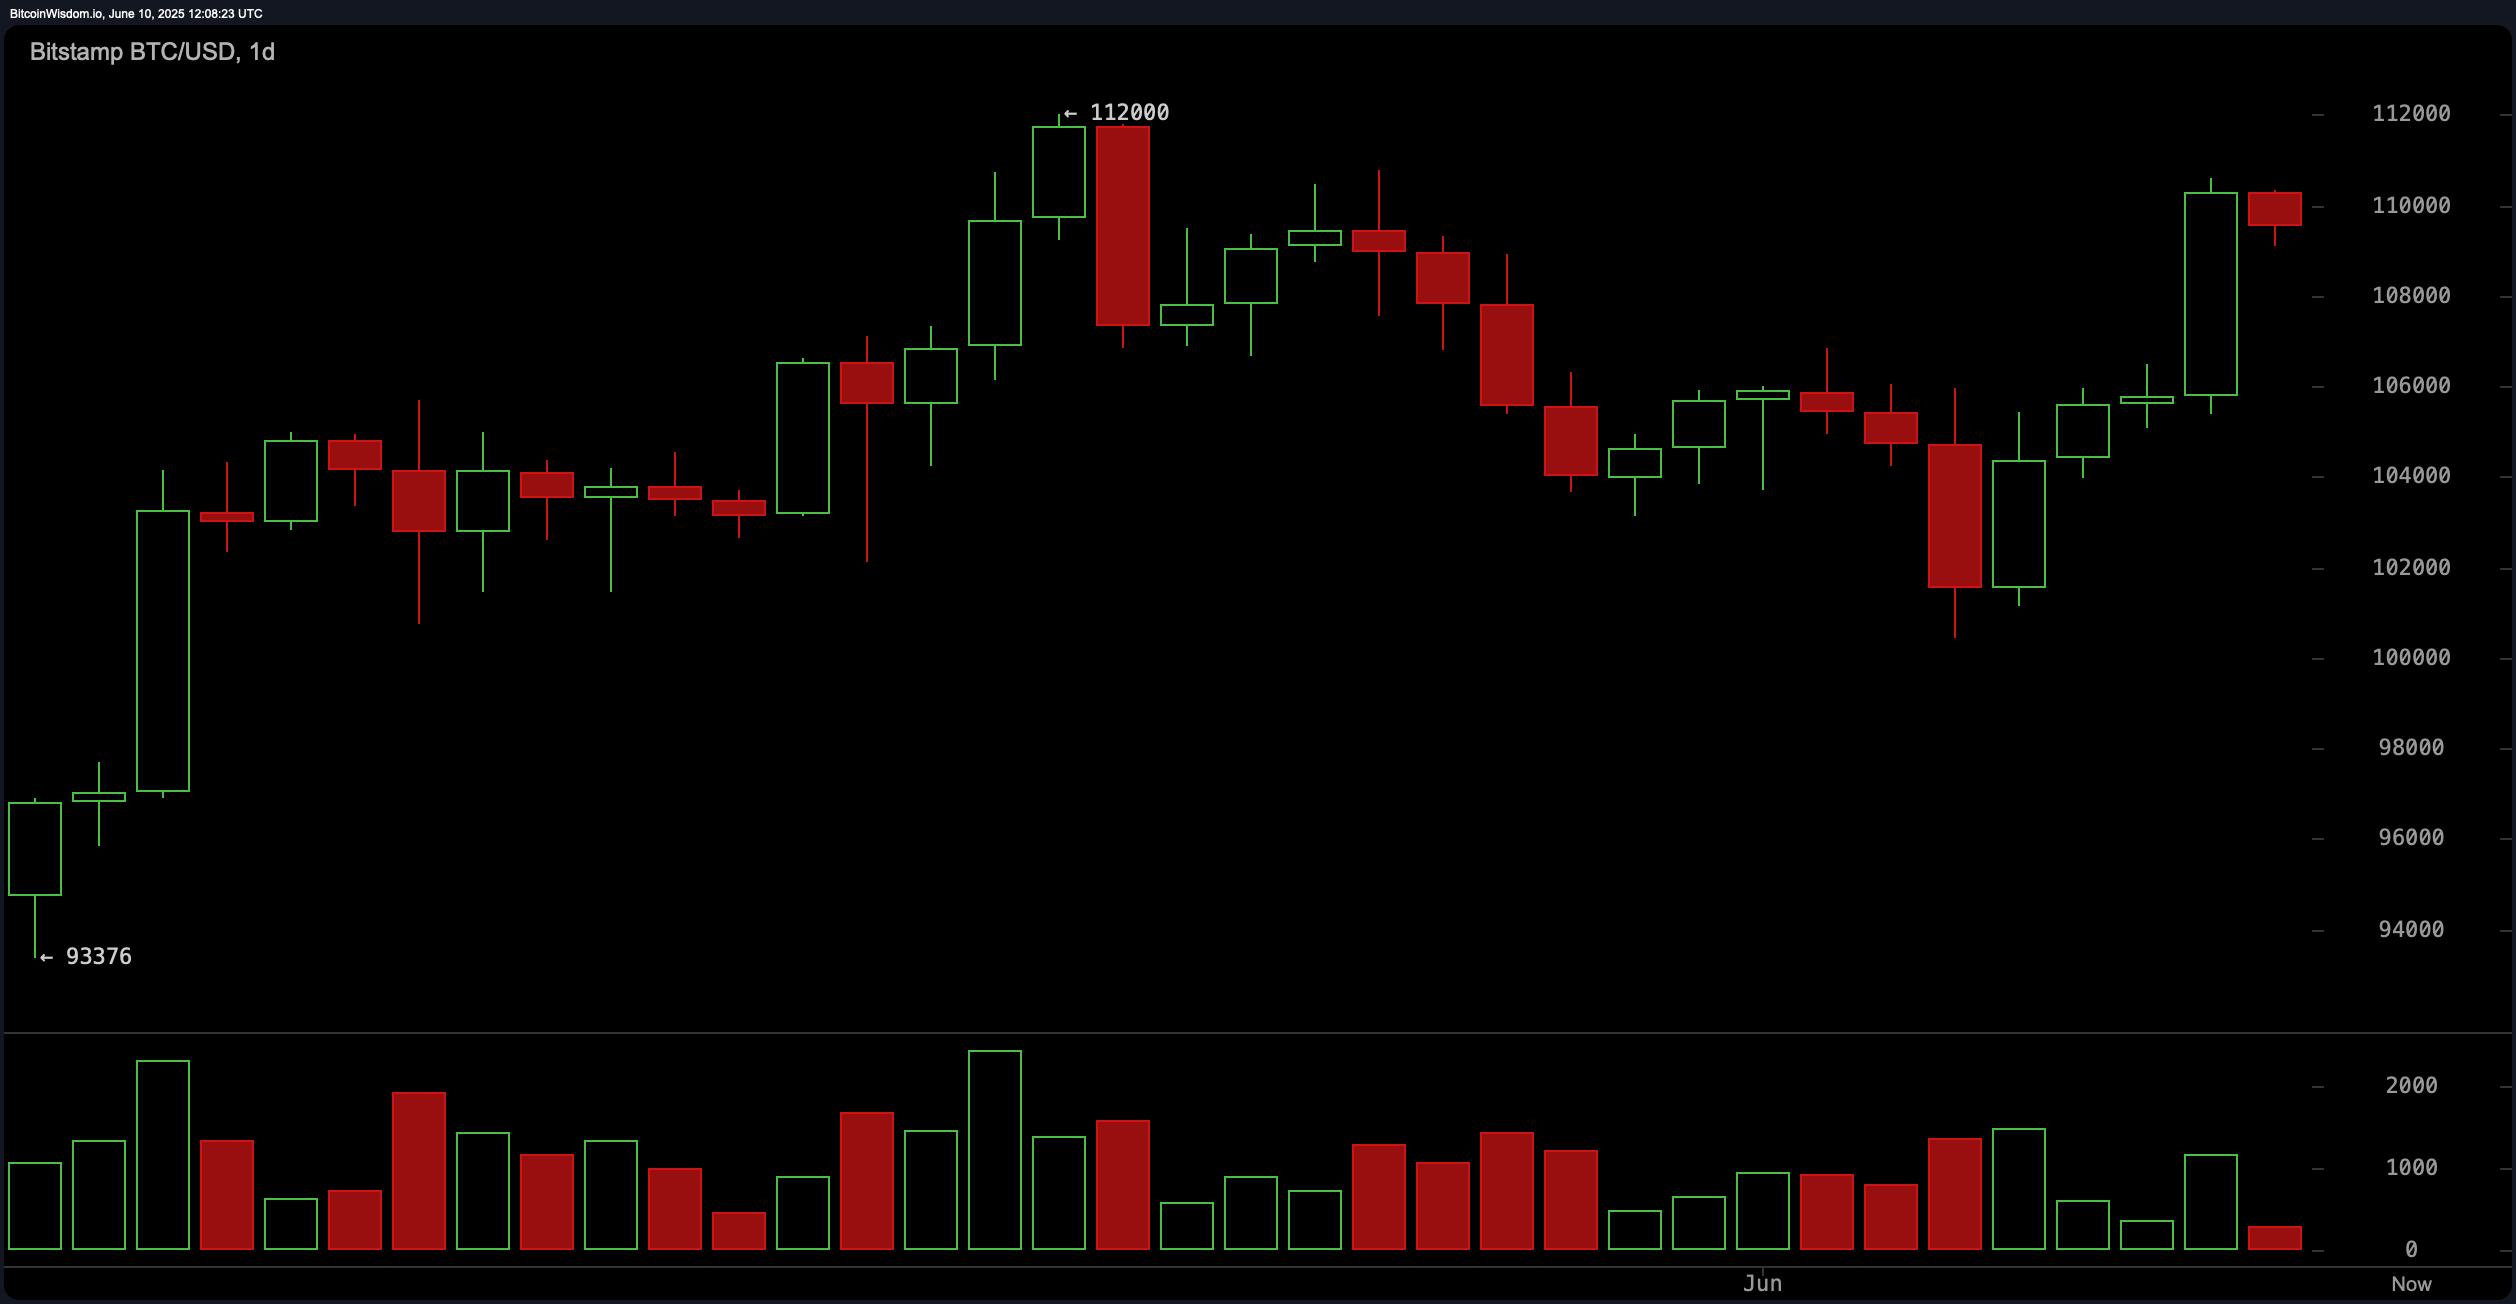
On the daily chart, if you squint hard enough, Bitcoin looks like it’s playing a game of Marco Polo, bouncing within a range of about $93,000 to $112,000. There was this dramatic surge on June 7 that pushed it up to $112,000 faster than you can say “FOMO,” only to be greeted with a sharp, bearish engulfing pattern that says, “Not so fast, my friend.” Basically, traders are indecisive—some just want to take profits, others are pretending not to watch the rollercoaster. The current settling between $105,000 and $110,000 suggests they’re all just waiting for their coffee to brew. The RSI (relative strength index) is at 61, which, in trader talk, is like a lukewarm bath—neither hot nor cold. The Stochastic oscillator is at 79, climbing the ladder of stilting indecision. Meanwhile, the Awesome oscillator, like a tiny cheerleader with pompoms, is at 752, hinting that bullish momentum might still be lurking behind the curtains.
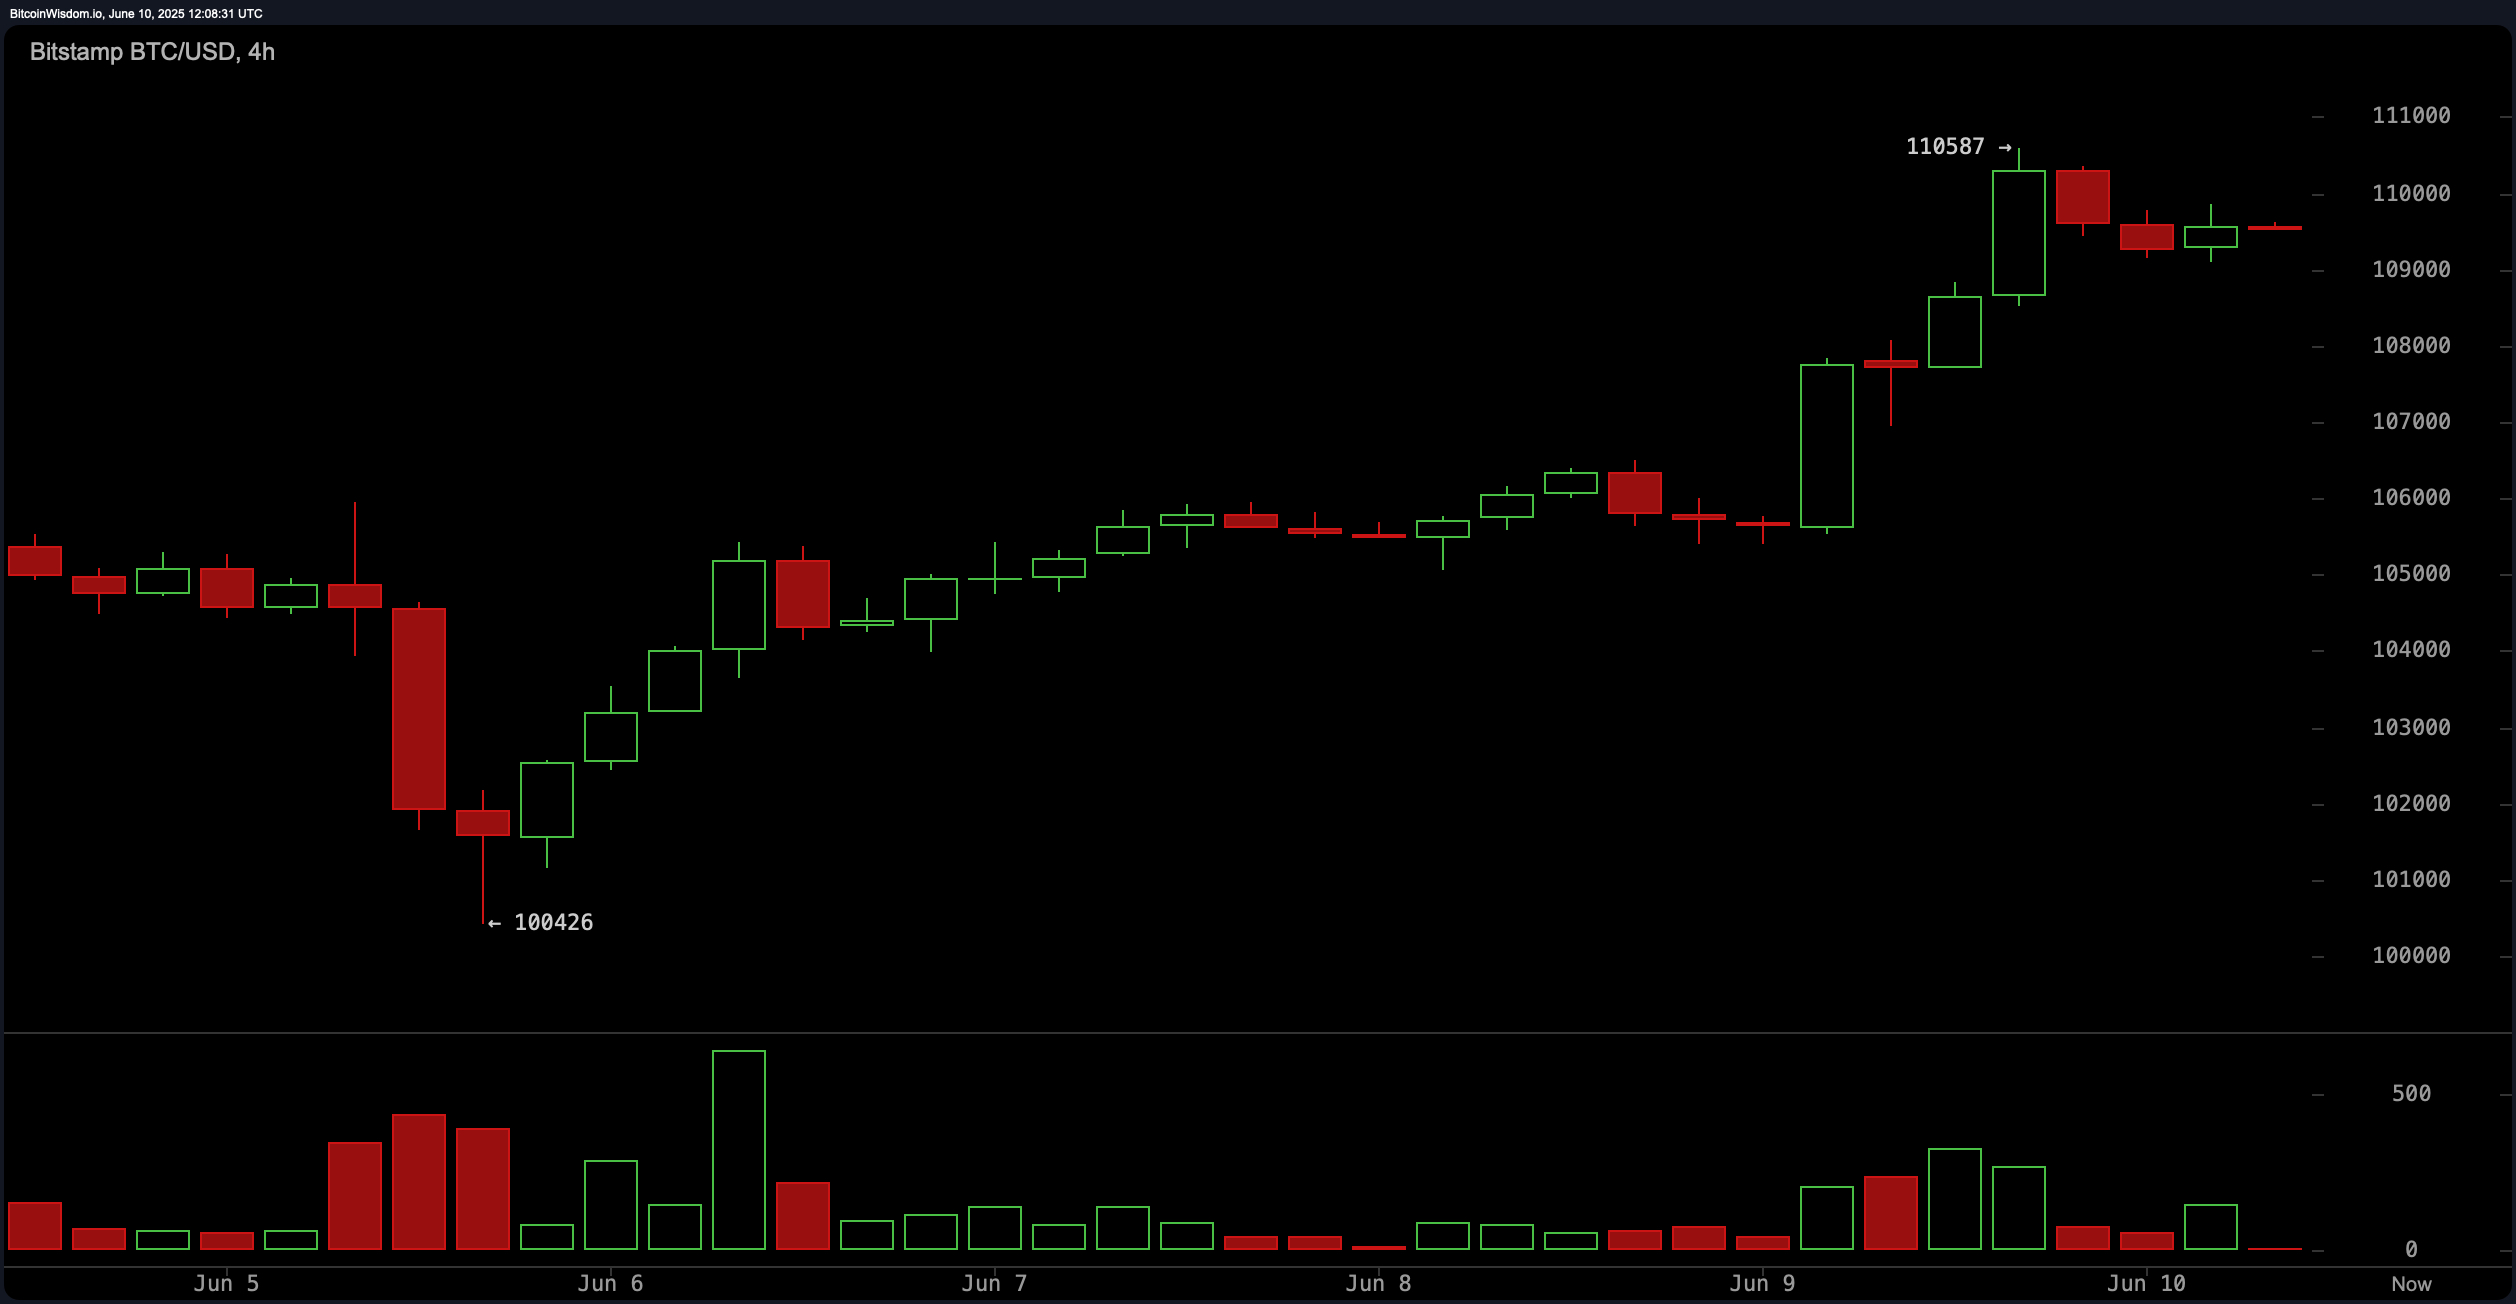
The 4-hour chart looks like a teenager’s mood swing, showing a quick rally from $100,000 to $110,000, then halting like a car running out of gas. Volume—Bitcoin’s equivalent of caffeine—has cooled since reaching the peak of $110,587, whispering softly, “Maybe I’m tired.” Indicators are on the fence: CCI at 96 and ADX at 19 are basically shrugging, “Meh.” All the moving averages, including the fancy exponential and simple ones, are leaning bullish, so if volume wakes up, maybe—just maybe—we’re in for a good punch of green.
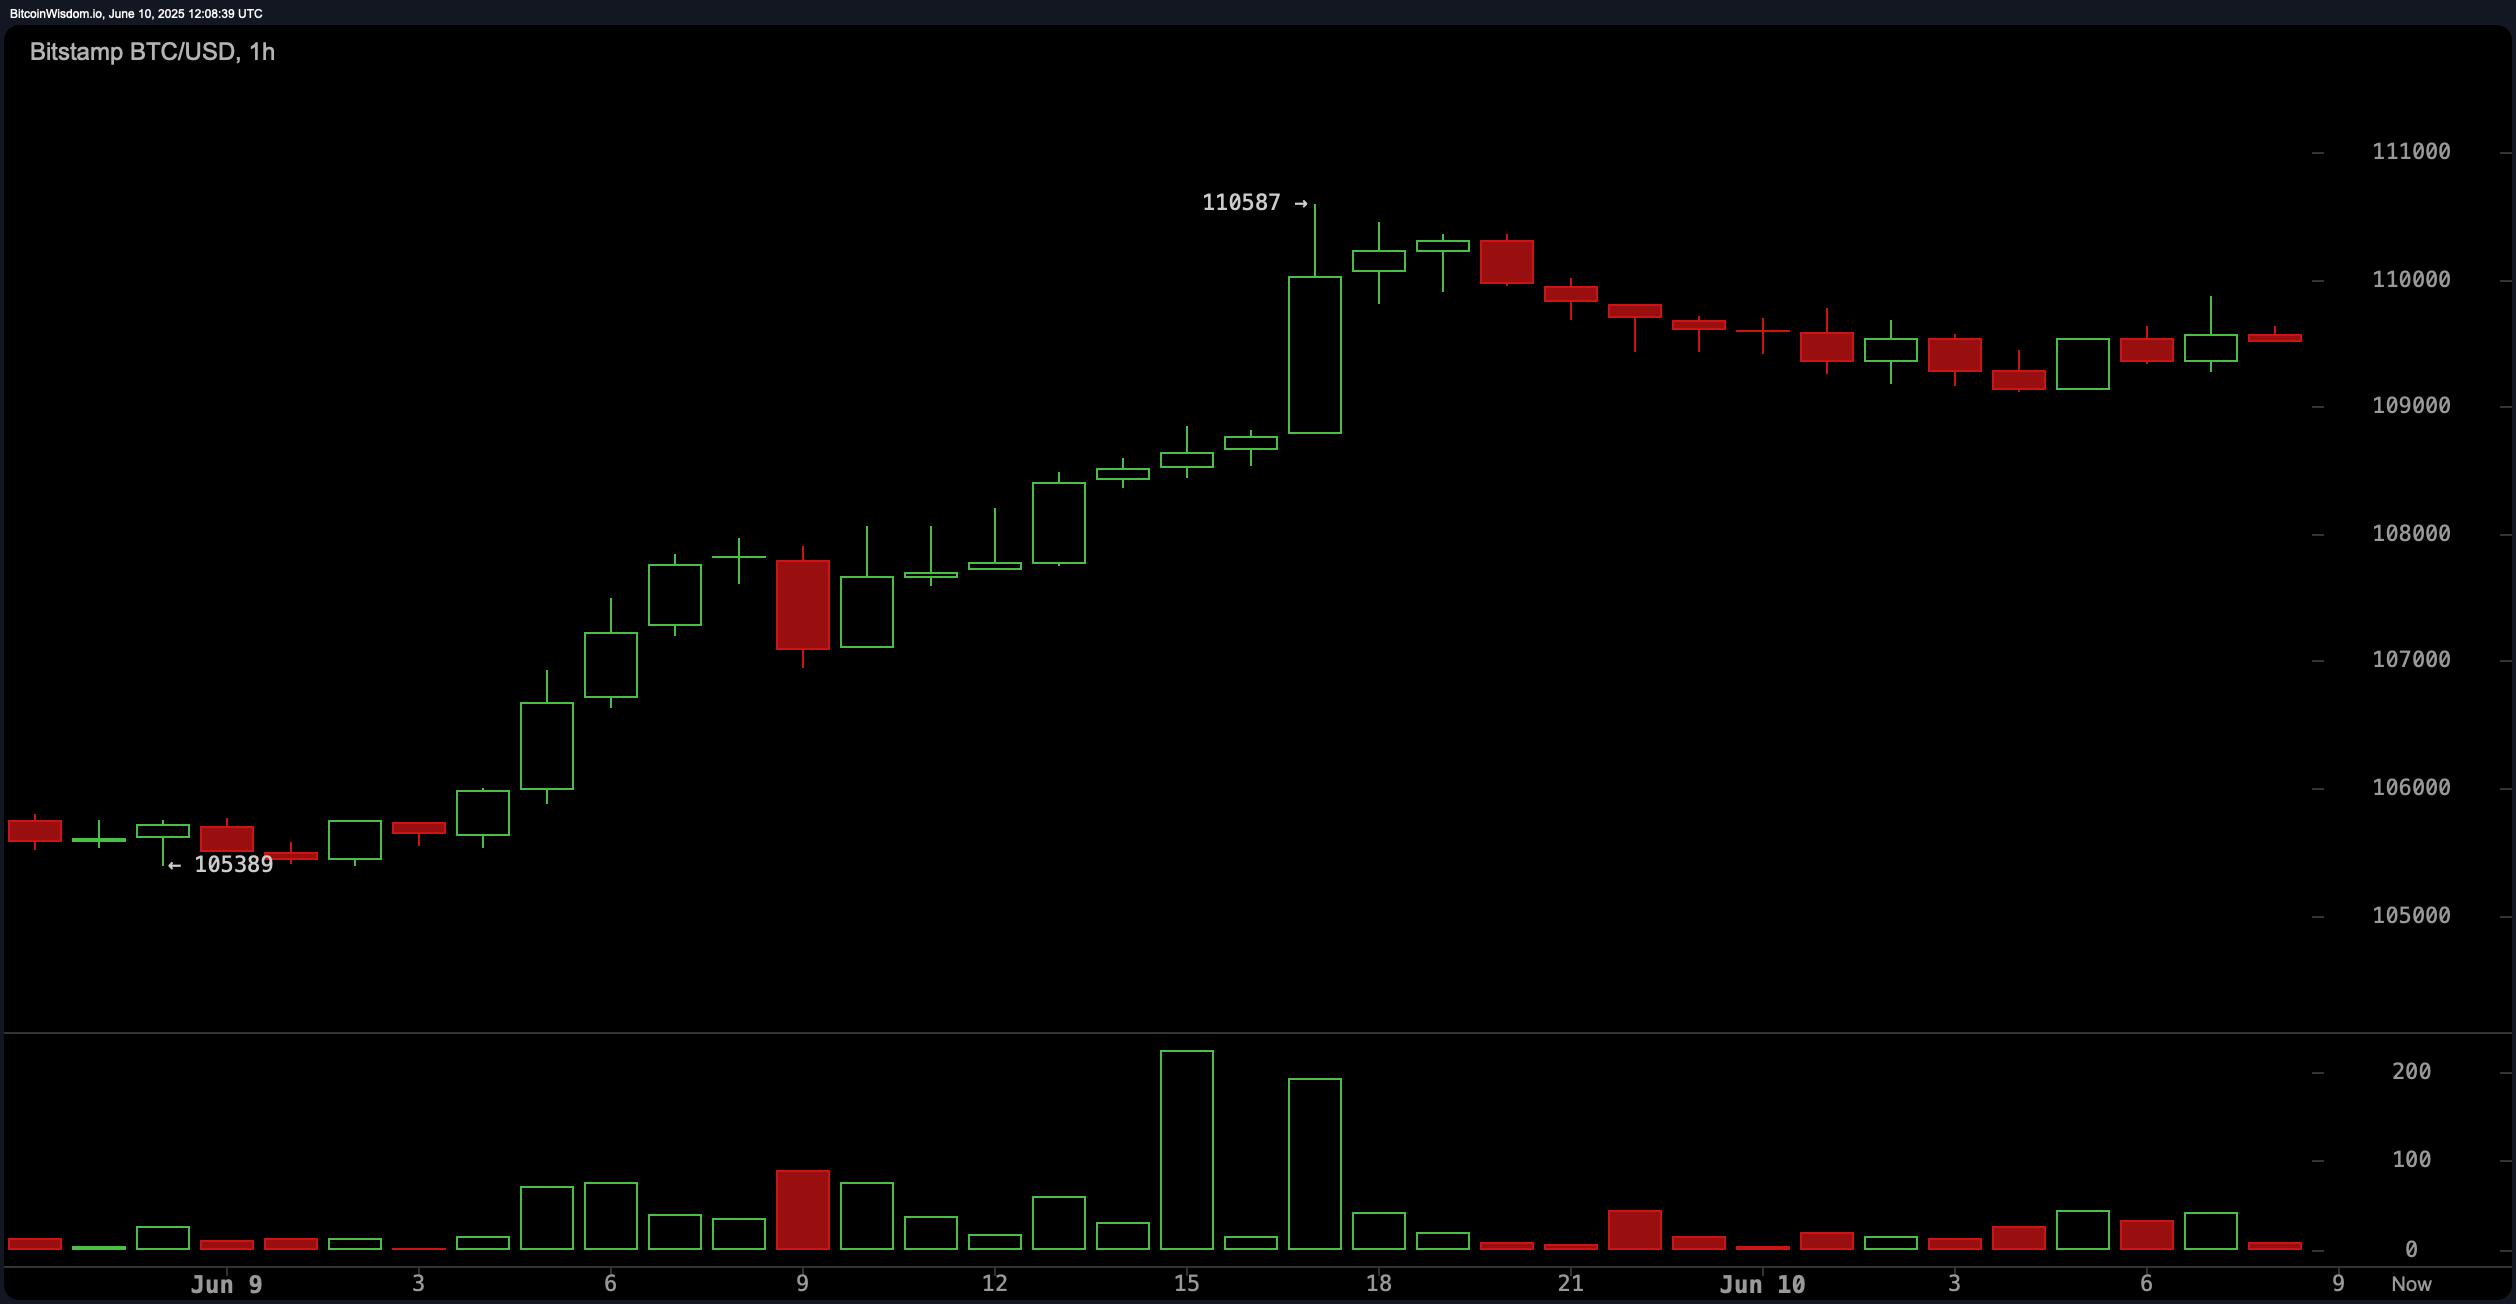
The 1-hour snapshot shows Bitcoin doing the slow dance around $110,587, with tiny candles that look like short stabs of hesitation. When traders aren’t sure whether to buy or sell, volume shrinks, like a party running out of punch. The MACD, which often acts like the caffeine jolt of the market, is at 1,315—overbought—and the awesome oscillator is still positive, so it’s as if everyone’s holding their breath, waiting for the next big move. Or maybe just waiting for lunch.
Zooming out, all those moving averages you hear about—EMA, SMA, the whole alphabet—are sitting below current prices like loyal dogs, hinting that longer-term, the trend favors the bulls. But beware: the shorter-term traders are pacing nervously, testing resistance like a kid poking at a hornet’s nest. Break above $110,587 should give a boost toward $112,000 (fingers crossed), but fall below $108,000? Expect a downward tumble toward $104,000 or even further. Keep your eyes on volume and key resistance levels because, as anyone who’s ever traded knows, it’s all about patience and the next market cat meme.
Bullish or Bust? The Verdict:
The technical indicators tip the scales toward bulls, with all major averages supporting a rally and the awesome oscillator giving a thumbs up. The price is snug inside a tight consolidation, like a squirrel in a nut shelf, waiting for a breakout. If it clears $110,587, the next stop might be $112,000 or higher—dream big, crypto fans! But don’t get too comfy—overbought signals like MACD suggest exhaustion may be lurking behind the curtains, ready to pounce if traders get too eager.
Bearish or Brave:
Despite the bullish vibe, some signs whisper warnings: oscillators hit overbought, volume dwindles, and the daily “bear trap” pattern suggests a potential tumble. If the price drops below $108,000, buckle up because a swift retreat to $104,000 could be around the corner. So, whether you’re a diamond-handed hodler or just here for the popcorn, keep your eyes peeled and your finger on the sell button—just in case this up-and-down saga continues! 🚧💸
Read More
- Clash Royale Best Boss Bandit Champion decks
- Vampire’s Fall 2 redeem codes and how to use them (June 2025)
- Best Hero Card Decks in Clash Royale
- Mobile Legends: Bang Bang (MLBB) Sora Guide: Best Build, Emblem and Gameplay Tips
- Clash Royale Furnace Evolution best decks guide
- Best Arena 9 Decks in Clast Royale
- Clash Royale Witch Evolution best decks guide
- Dawn Watch: Survival gift codes and how to use them (October 2025)
- Wuthering Waves Mornye Build Guide
- All Brawl Stars Brawliday Rewards For 2025
2025-06-10 16:34