7:50 a.m. on a Friday and Bitcoin is, frankly, feeling itself: still strutting at $103,191 per coin (insert hair flip), market cap now a wallet-busting $2.04 trillion, and a 24-hour trading volume that even my rent couldn’t put a dent in—$55.17 billion. Intraday price? Somewhere between $99,239 and a local nose-bleed-high of $104,332. Bulls are hyped, obviously, but did someone just sense a whiff of consolidation? Smells suspiciously like caution and day-old pizza.
Bitcoin
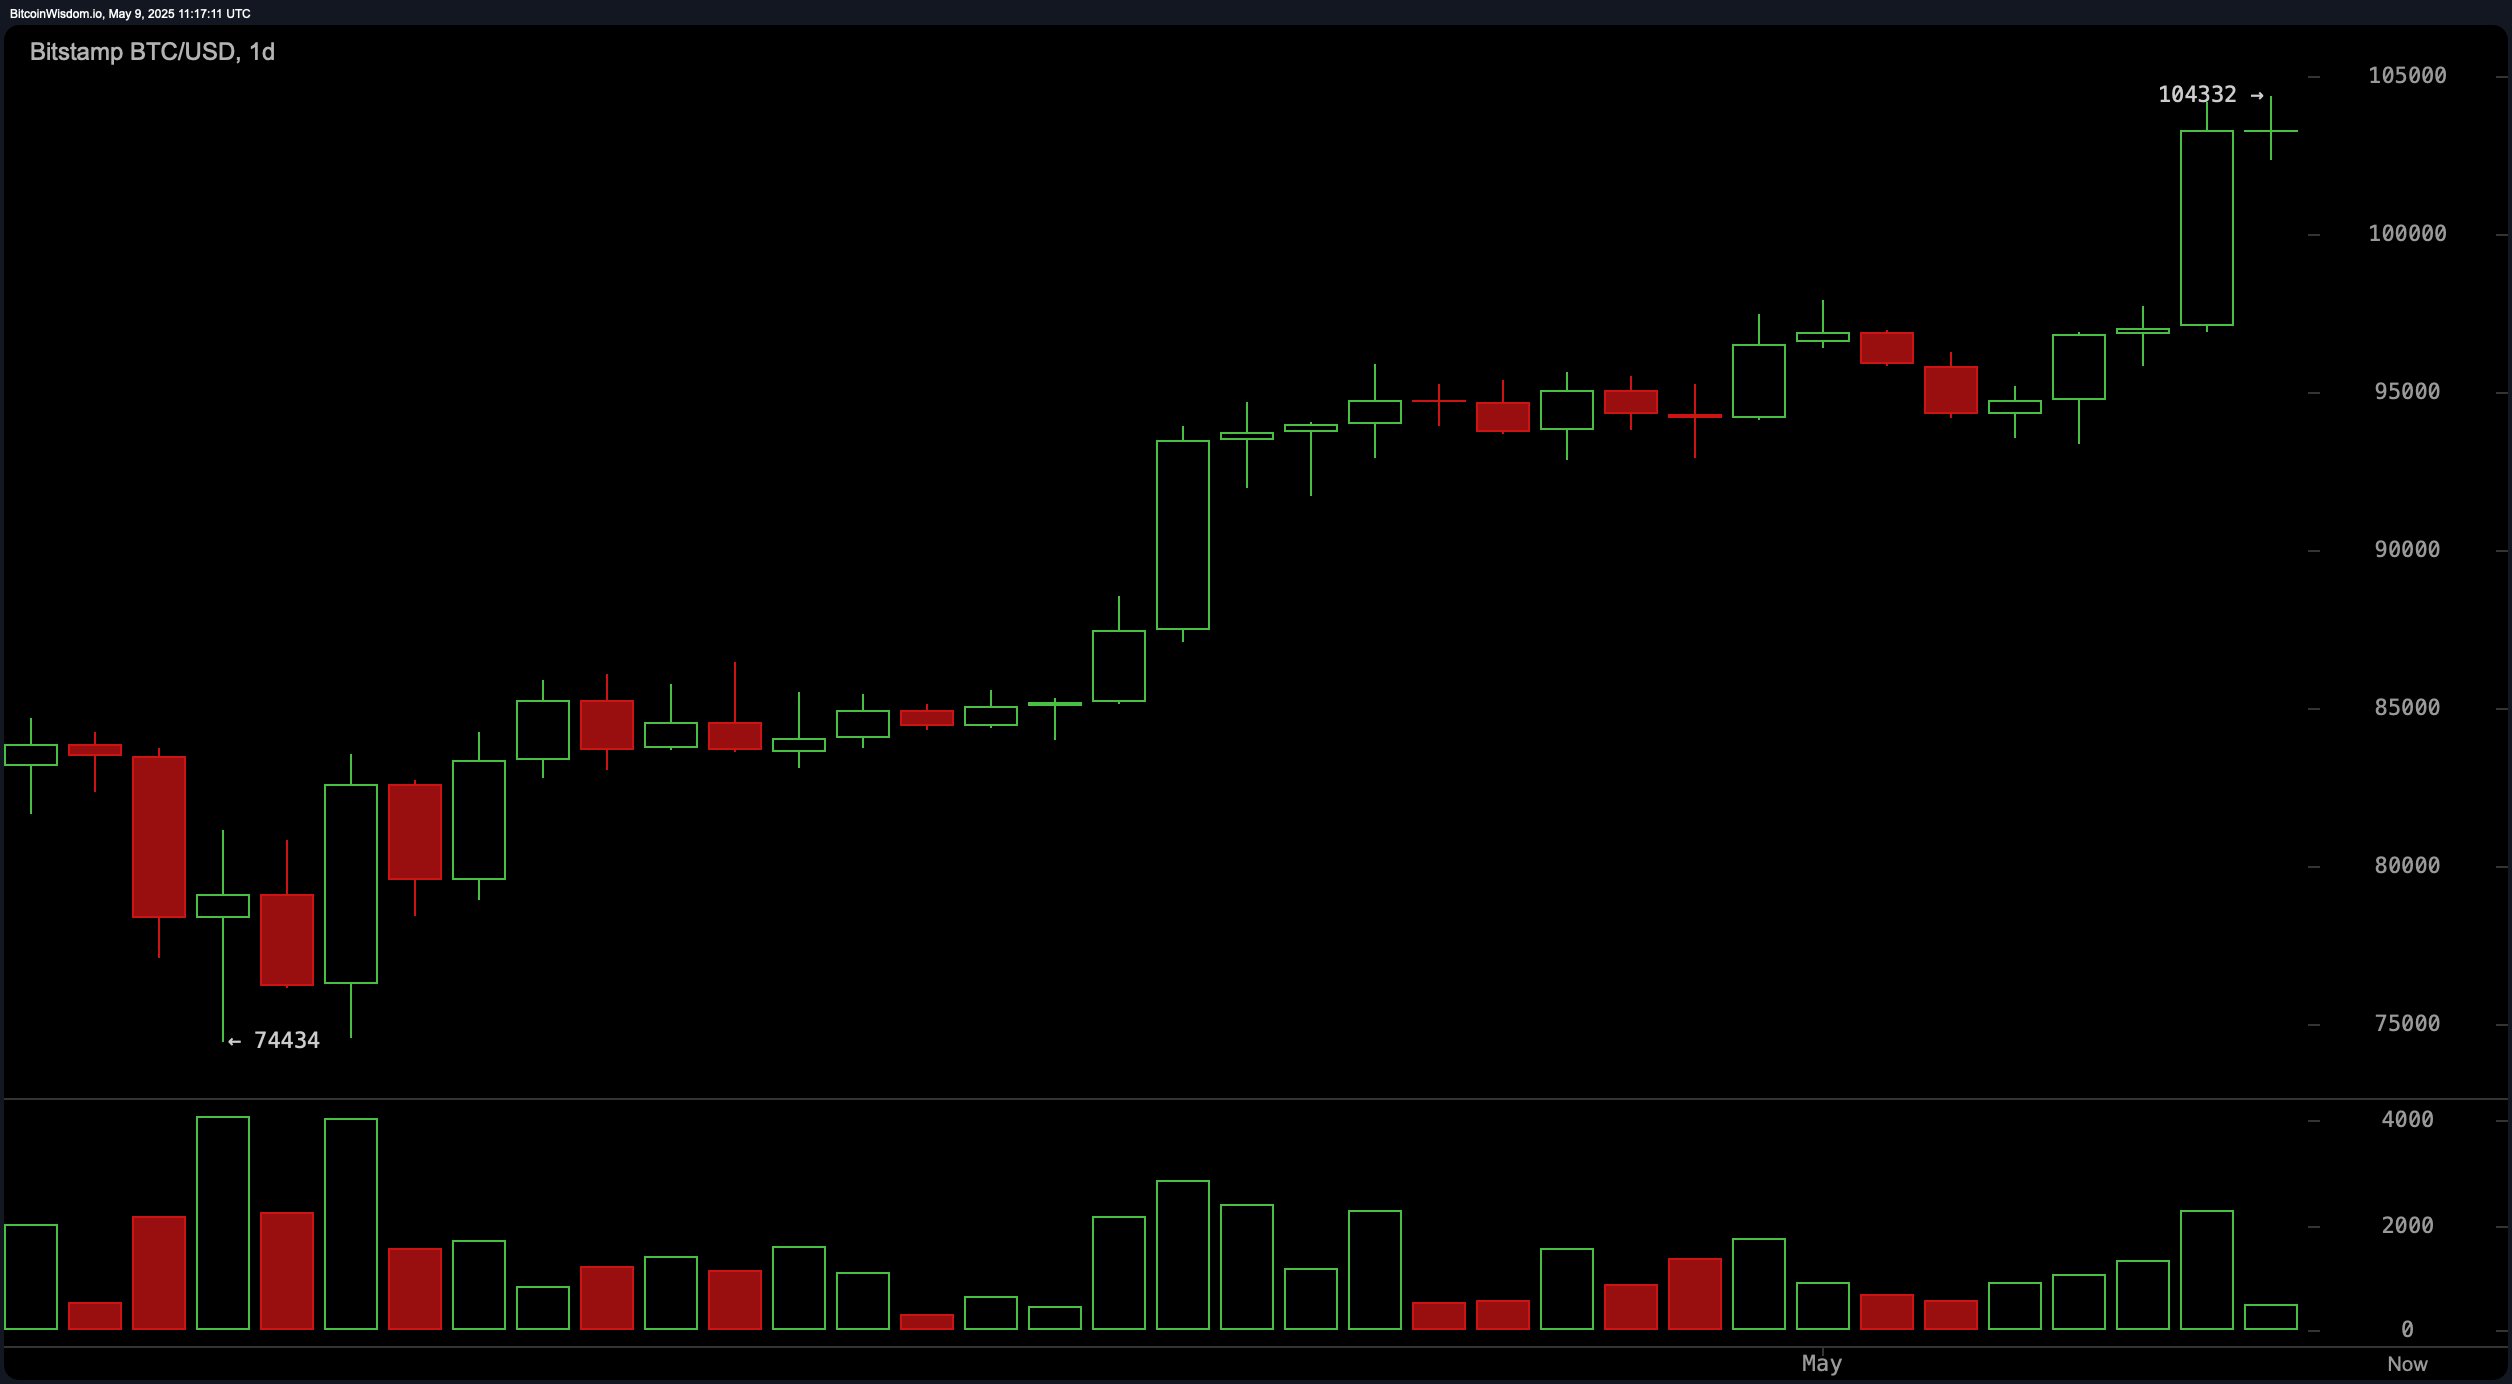
Daily chart, a.k.a. the drama queen of technical analysis, is waving giant green flags. Bitcoin (BTC) has swept off from $95,000 to a stunning new high. Volume? Spiked so noticeably you’d think it saw its ex at the gym. Official resistance says “no entry” at $104,332, while support is lounging comfortably at $95,000, waiting for the plot twist. Analysts whisper that you might want to consider crashing the party if BTC dips to $97,000–$98,500 and throws out one of those bullish candlestick moves (technical speak for “I’m still hot, actually”).
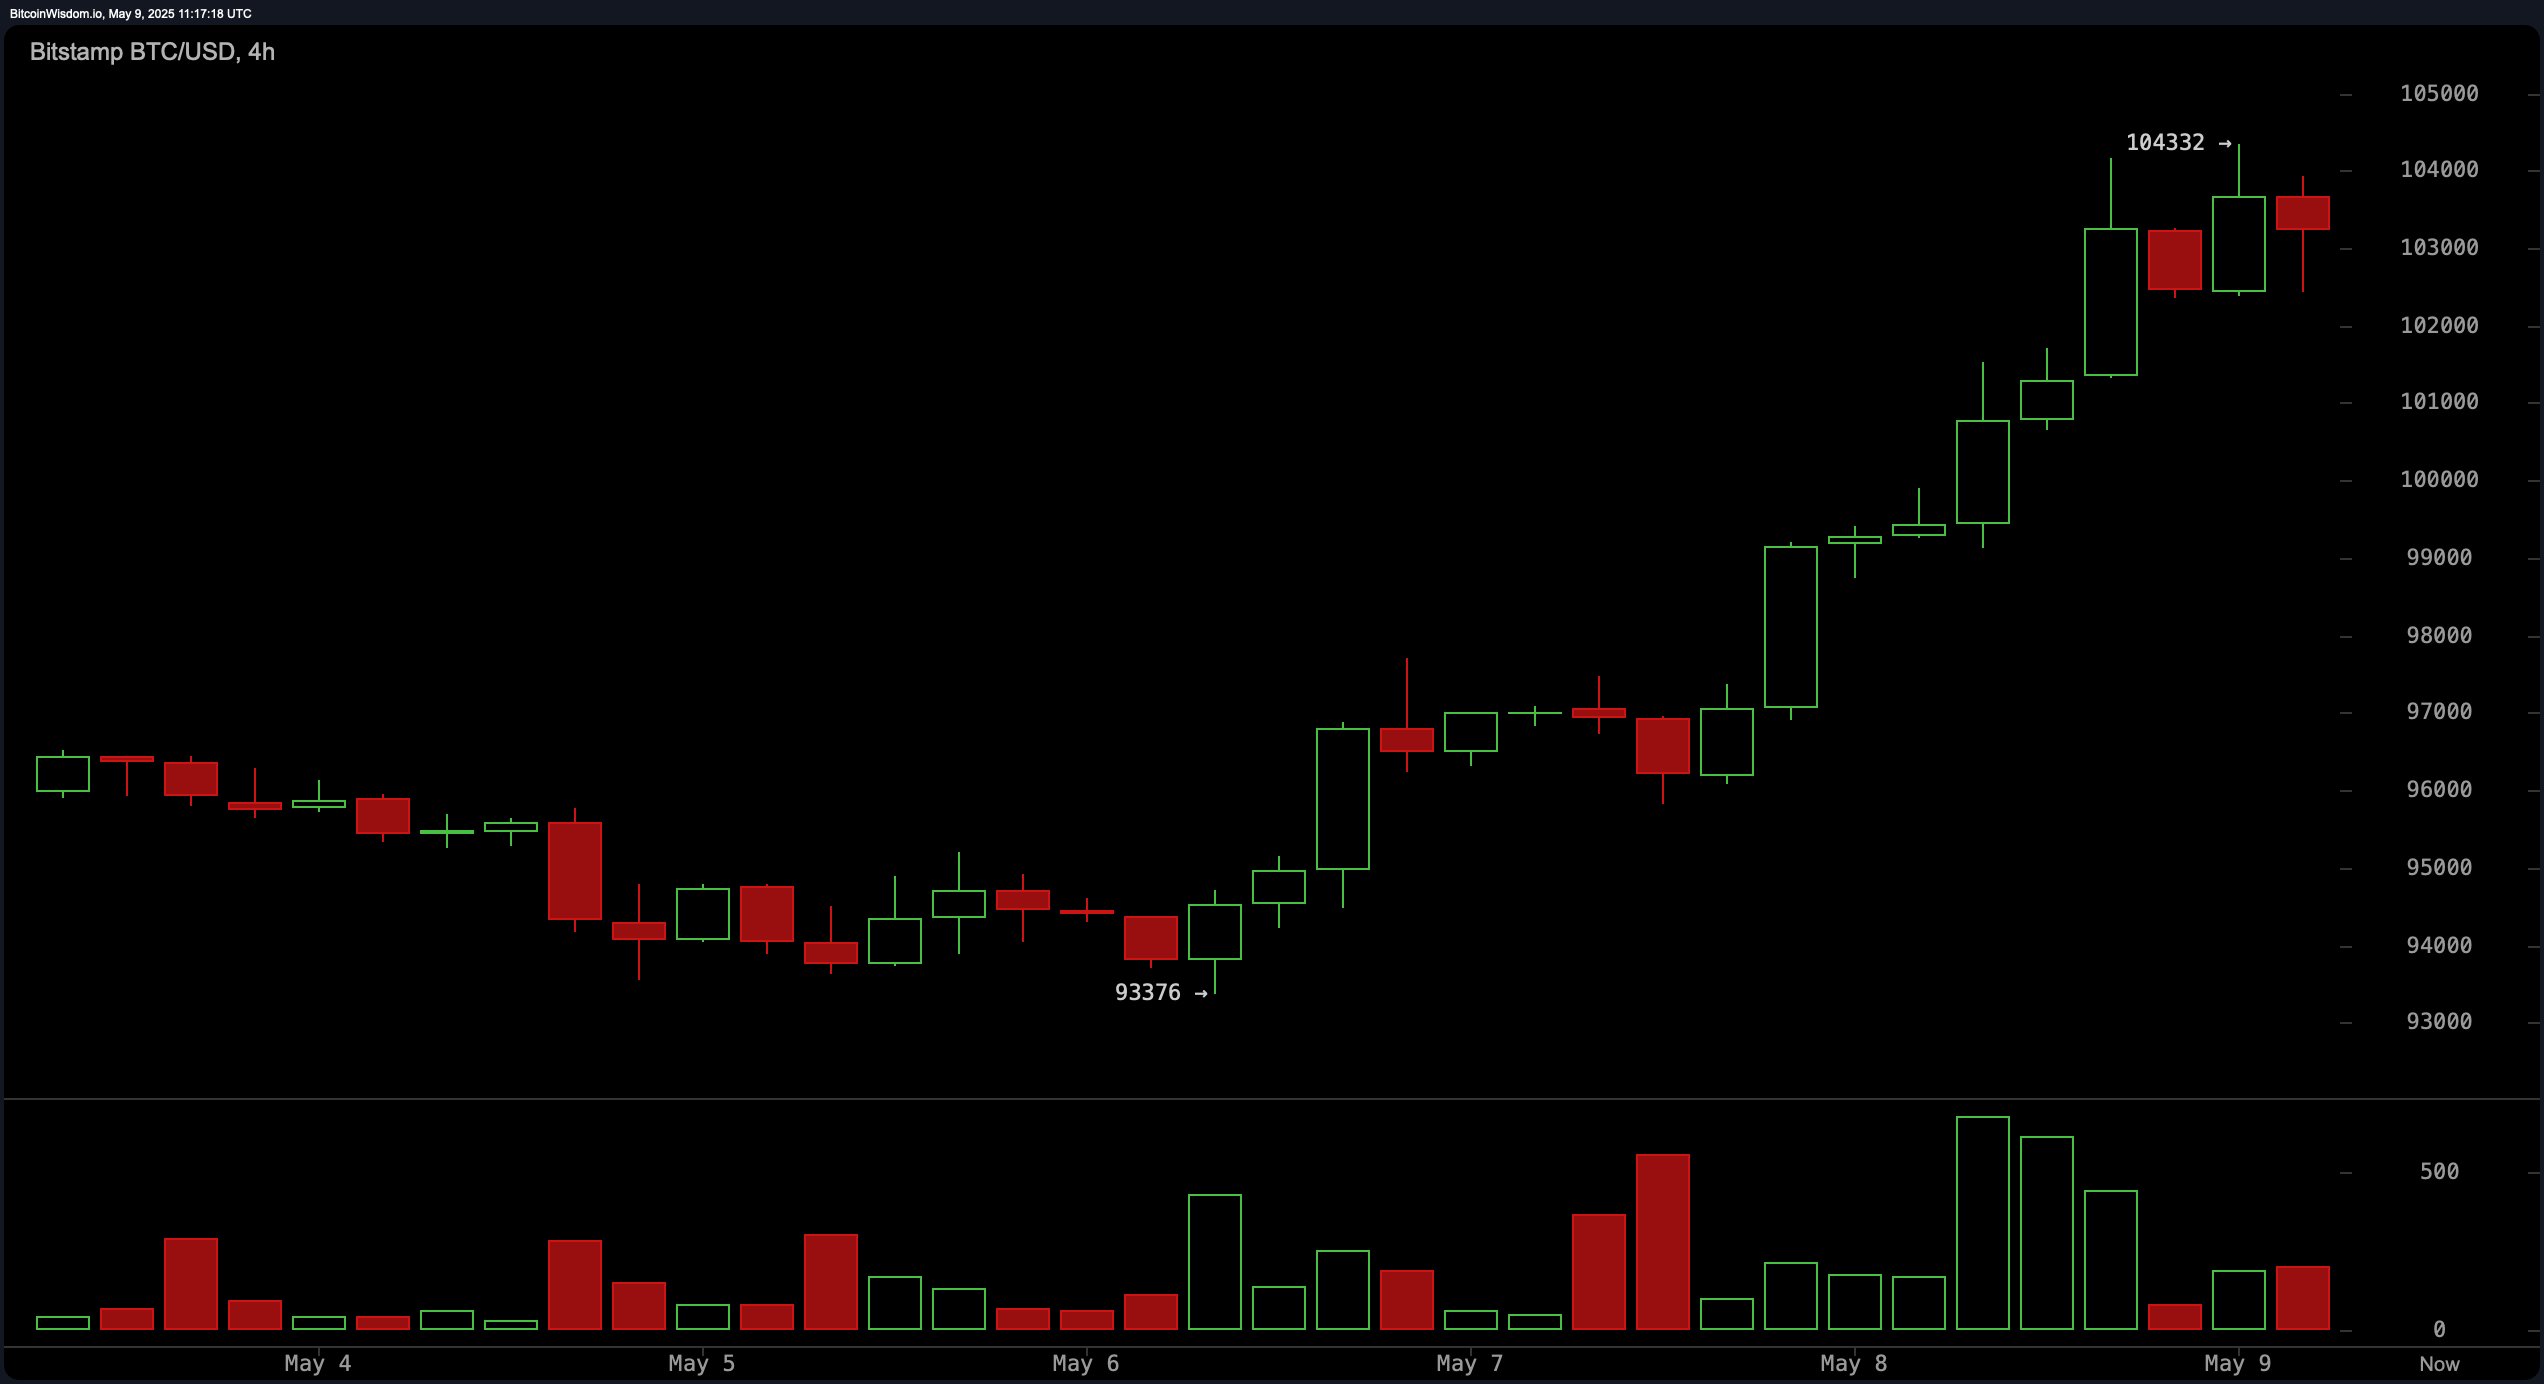
On the four-hour chart, BTC is clearly doing that thing where it climbs a flight of stairs, pauses dramatically, pretends to check its phone, then dashes up a few more steps. Peaked at $104,332, had a polite dip (“just stretching”), but now resistance is playing hard to get. Volume explosion? Absolutely. But the crowd’s enthusiasm is—how do I put this?—slightly fading. For those short on patience, a cheeky entry around $101,000–$102,000, but only if Bitcoin flashes a seriously bullish sign (the pin bar or engulfing candle equivalent of winking at you from across the bar).
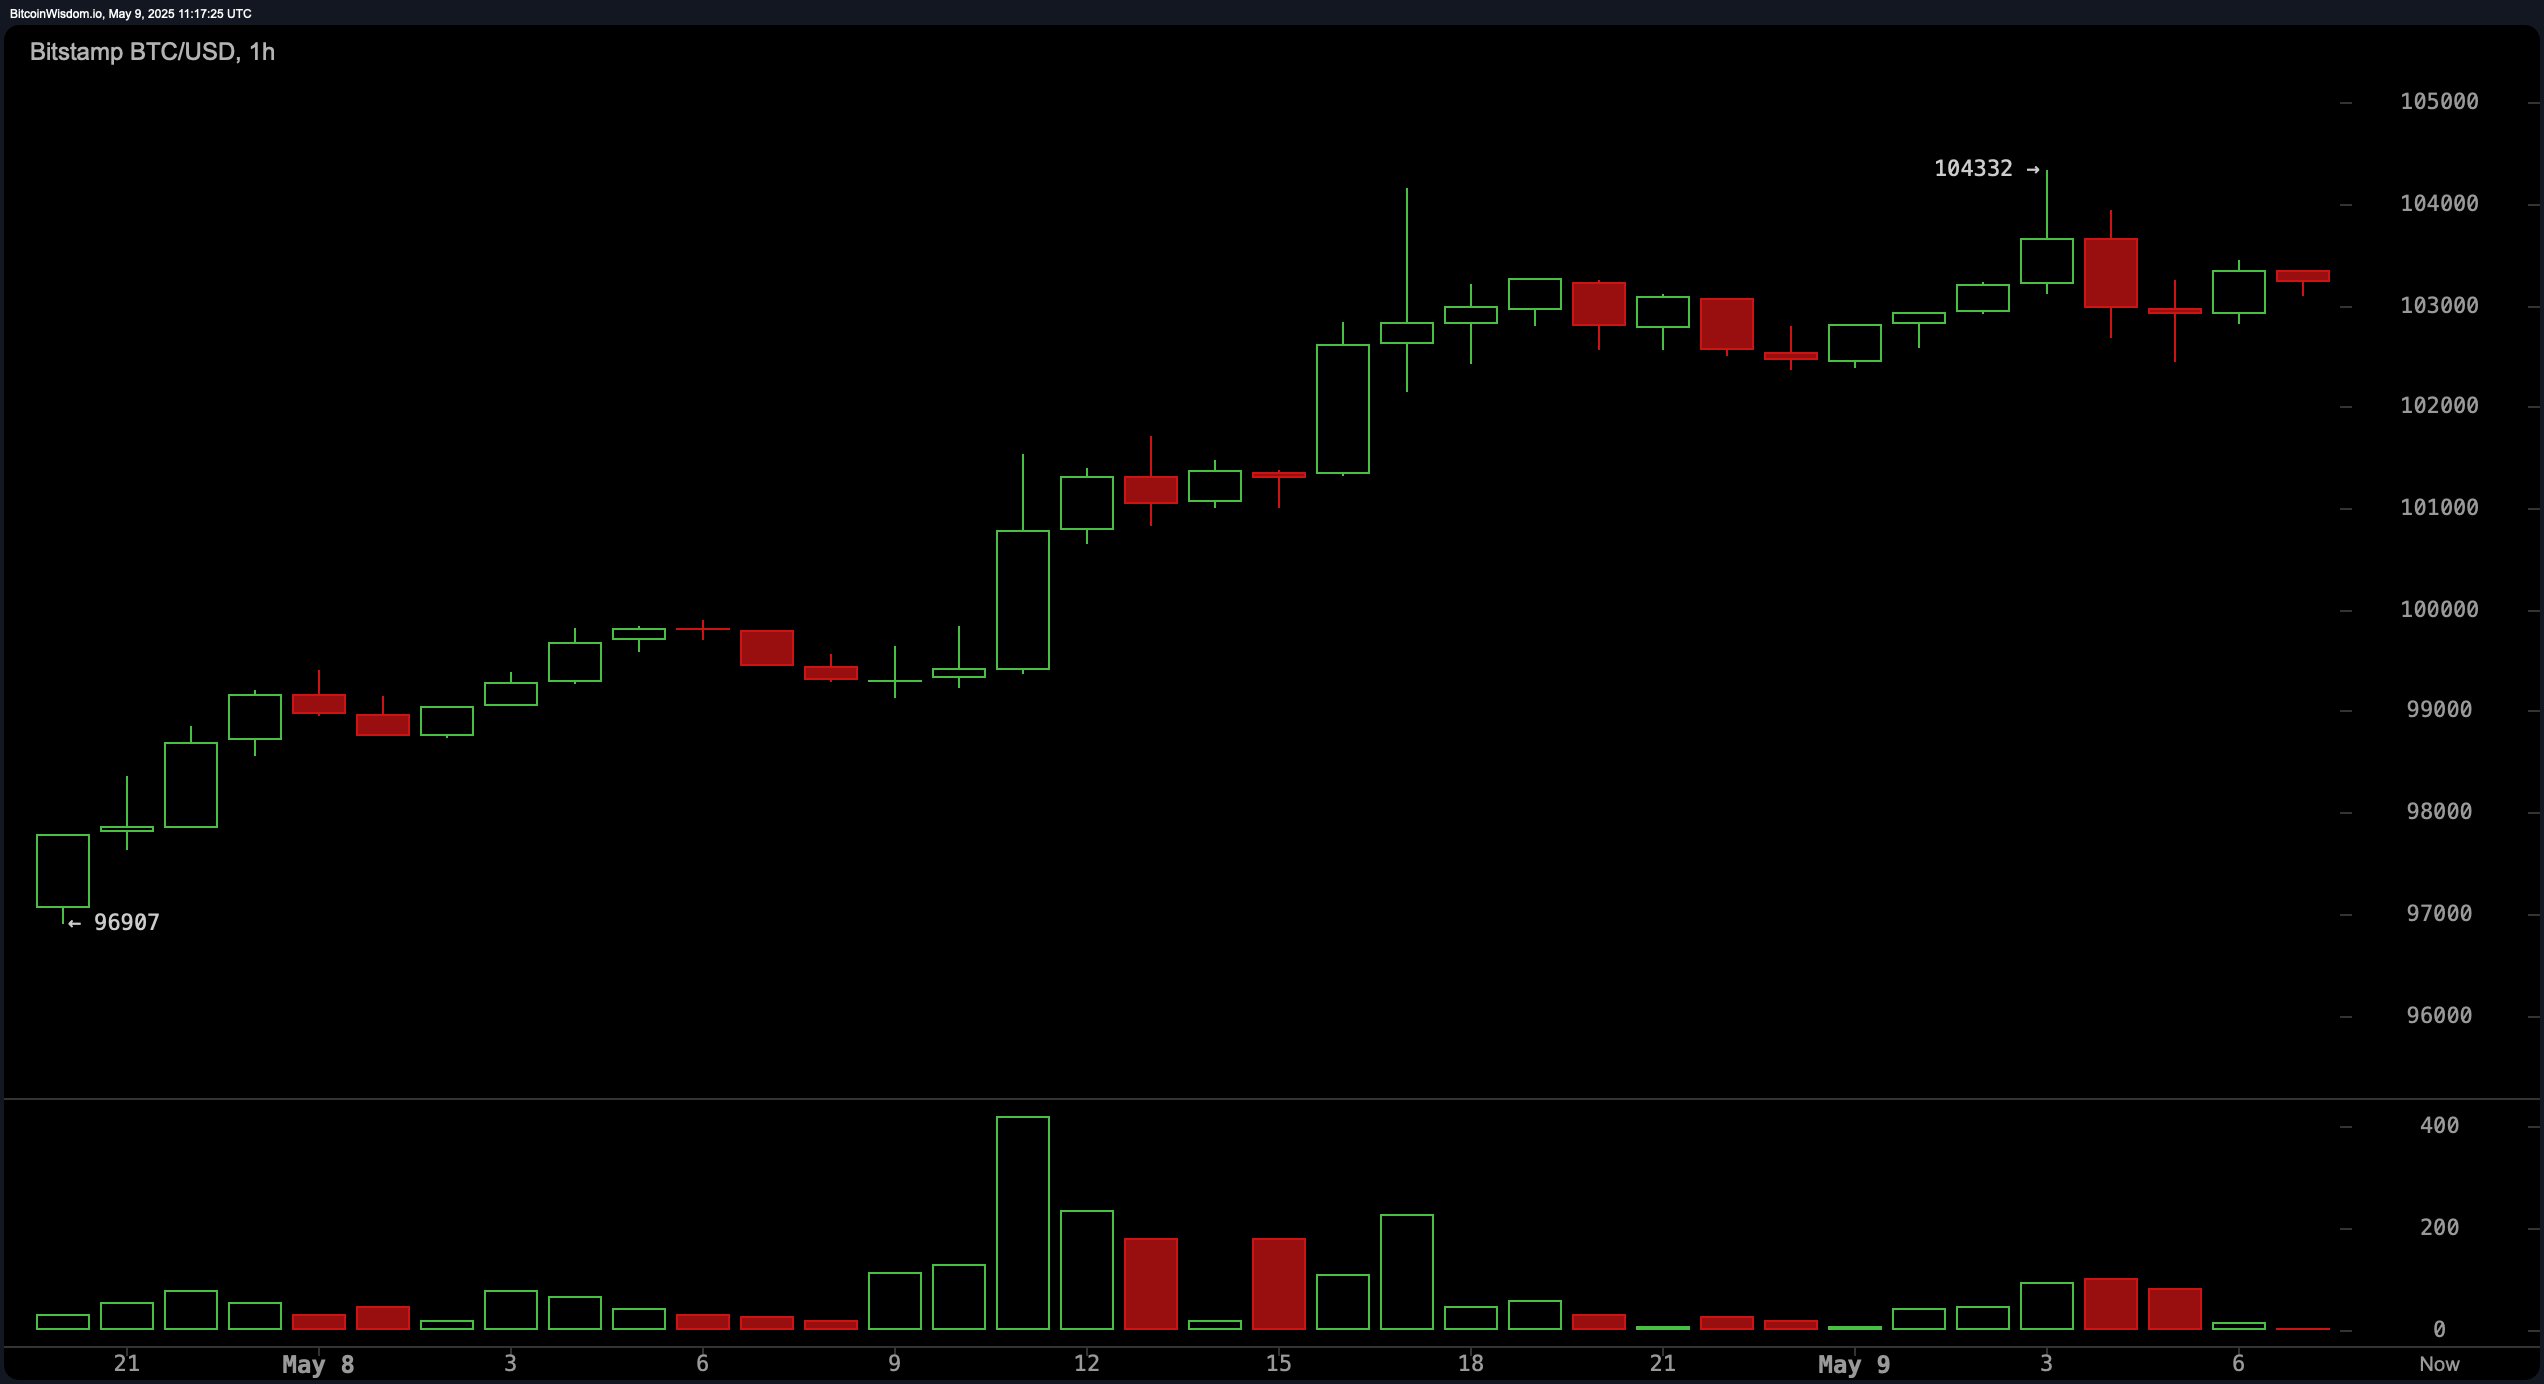
One-hour chart: Bitcoin nervously paces just beneath its recent highs. Volume and price are at a bit of a lover’s quarrel (bearish divergence alert!), and it’s forming lower highs, bless its heart. The pattern? Either a flag or a wedge—either way, could break out and do something dramatic, which, let’s face it, is kind of its thing. If it pole-vaults above $104,500, you may cheer all the way to a quick $500–$1,000 gain. If it flops below $102,800, pack tissues: short-term correction incoming.
Oscillators? Picture a group chat where no one agrees. RSI (76!) is that friend who overdoes the fake tan (overbought alert). Stochastic (89) and commodity channel index (236)? Neutral, twiddling their thumbs. ADX (33) and “Awesome oscillator” (yes, really, 8,483) giving you cautious thumbs-up. Momentum (8,946) and MACD (3,591) are the enablers, encouraging more bullish shenanigans all night long.
Every moving average you can think of—EMA, SMA, the whole alphabet soup in periods of 10, 20, 30, 50, 100, 200—are basically screaming “buy!” at your face. EMA (10) at $97,908 practically leaps to catch you, SMA (10) at $97,296 says, “I got your back.” Long-term ones (EMA 200 at $86,845 and SMA 200 at $91,050) just hum along approvingly in the background. Basically, unless you think the entire cast of indicators is pranking you, it’s bullish city—but watch those overbought levels and resistance zones before you mortgage the cat.
Bull Verdict:
Bulls have hijacked this show and there’s no interval in sight. Momentum: extra. Indicators: all lined up like it’s Fashion Week. If Bitcoin can stay upright above key supports and doesn’t run out of actual fans (volume), prepare yourself for a $105,000 sequel. Or a dance-off. Maybe both.
Bear Verdict:
But wait, plot twist: the music’s blaring, but someone’s noticed the snacks are running low (read: overbought levels and declining volume post-breakout). If BTC can’t charm its way through $104,500 and instead tumbles below $102,800, that’s your cue to start doomsaying about a corrective swoon—possibly down to $97,000, where it may dramatically faint on the fainting couch of support. 🎭
Read More
- Clash Royale Best Boss Bandit Champion decks
- Vampire’s Fall 2 redeem codes and how to use them (June 2025)
- Mobile Legends January 2026 Leaks: Upcoming new skins, heroes, events and more
- World Eternal Online promo codes and how to use them (September 2025)
- How to find the Roaming Oak Tree in Heartopia
- Best Arena 9 Decks in Clast Royale
- Clash Royale Season 79 “Fire and Ice” January 2026 Update and Balance Changes
- Clash Royale Furnace Evolution best decks guide
- Clash Royale Witch Evolution best decks guide
- Best Hero Card Decks in Clash Royale
2025-05-09 16:03