Bitcoin struts around $95,000, the same way I hover over an ex’s Instagram—just enough hope, and absurd levels of anticipation. We’ve just survived the emotional rollercoaster from $100,000 straight down to $74,434, and now we’re consolidating—like my dignity after one too many tequilas. Volume picked up during the rally (unlike my phone), so everyone’s feeling bullish. Support? $85,000 and $74,400—the emotional support dogs of bitcoin right now. But that wall between $95,000 and $100,000 might as well be Buckingham Palace. Break through it, and suddenly everyone’s lining up for a royal wedding. Or, you know, a new all-time high. Just, you know, beware of plot twists near resistance. This isn’t your average rom-com.
Bitcoin
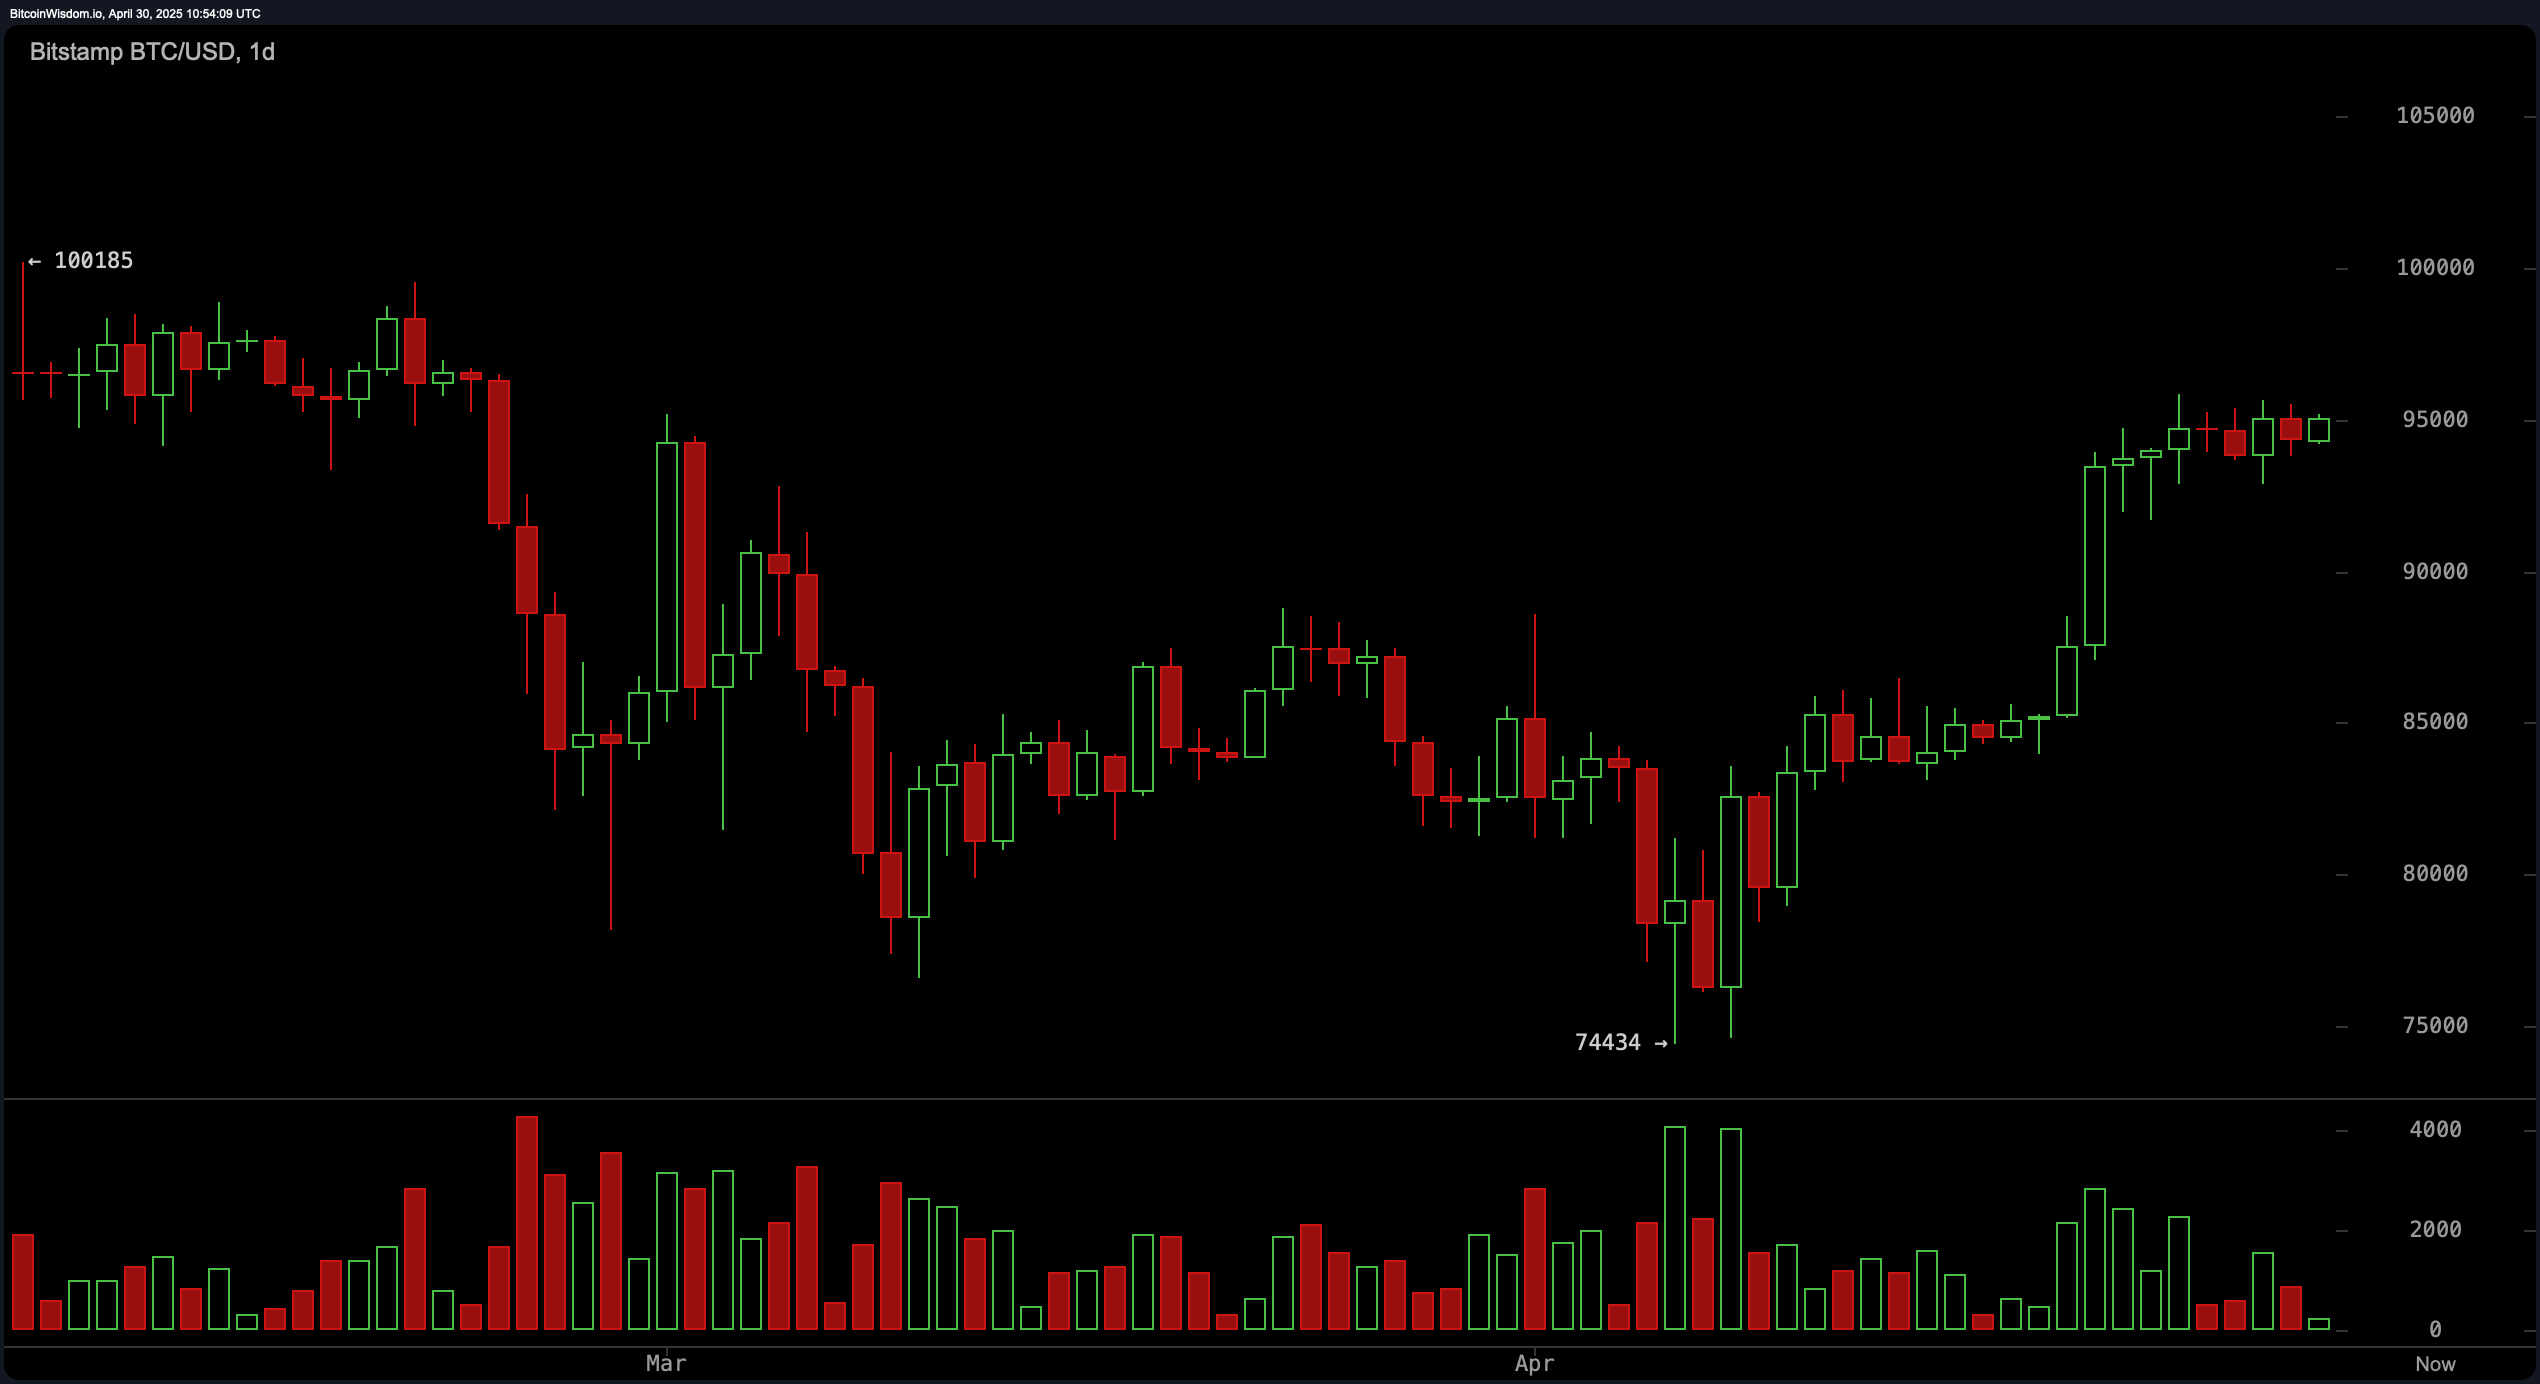
Look at the daily chart—see that gorgeous V-shaped recovery? It’s the glow-up after being ghosted at $100,185. Dramatically rebounding from $74K, bitcoin’s now surfing just under $95,000, like a cat circling a closed door. Volume popped during the run—bulls are interested and apparently have nothing better to do. Support lounges at $85,000 and $74,400, while resistance sits snootily between $95,000 and $100,000, sipping a negroni and pretending not to notice you. A glamorous break above $95K could basically blow the roof off, but if you don’t bring enough volume, don’t expect an invitation to the afterparty.
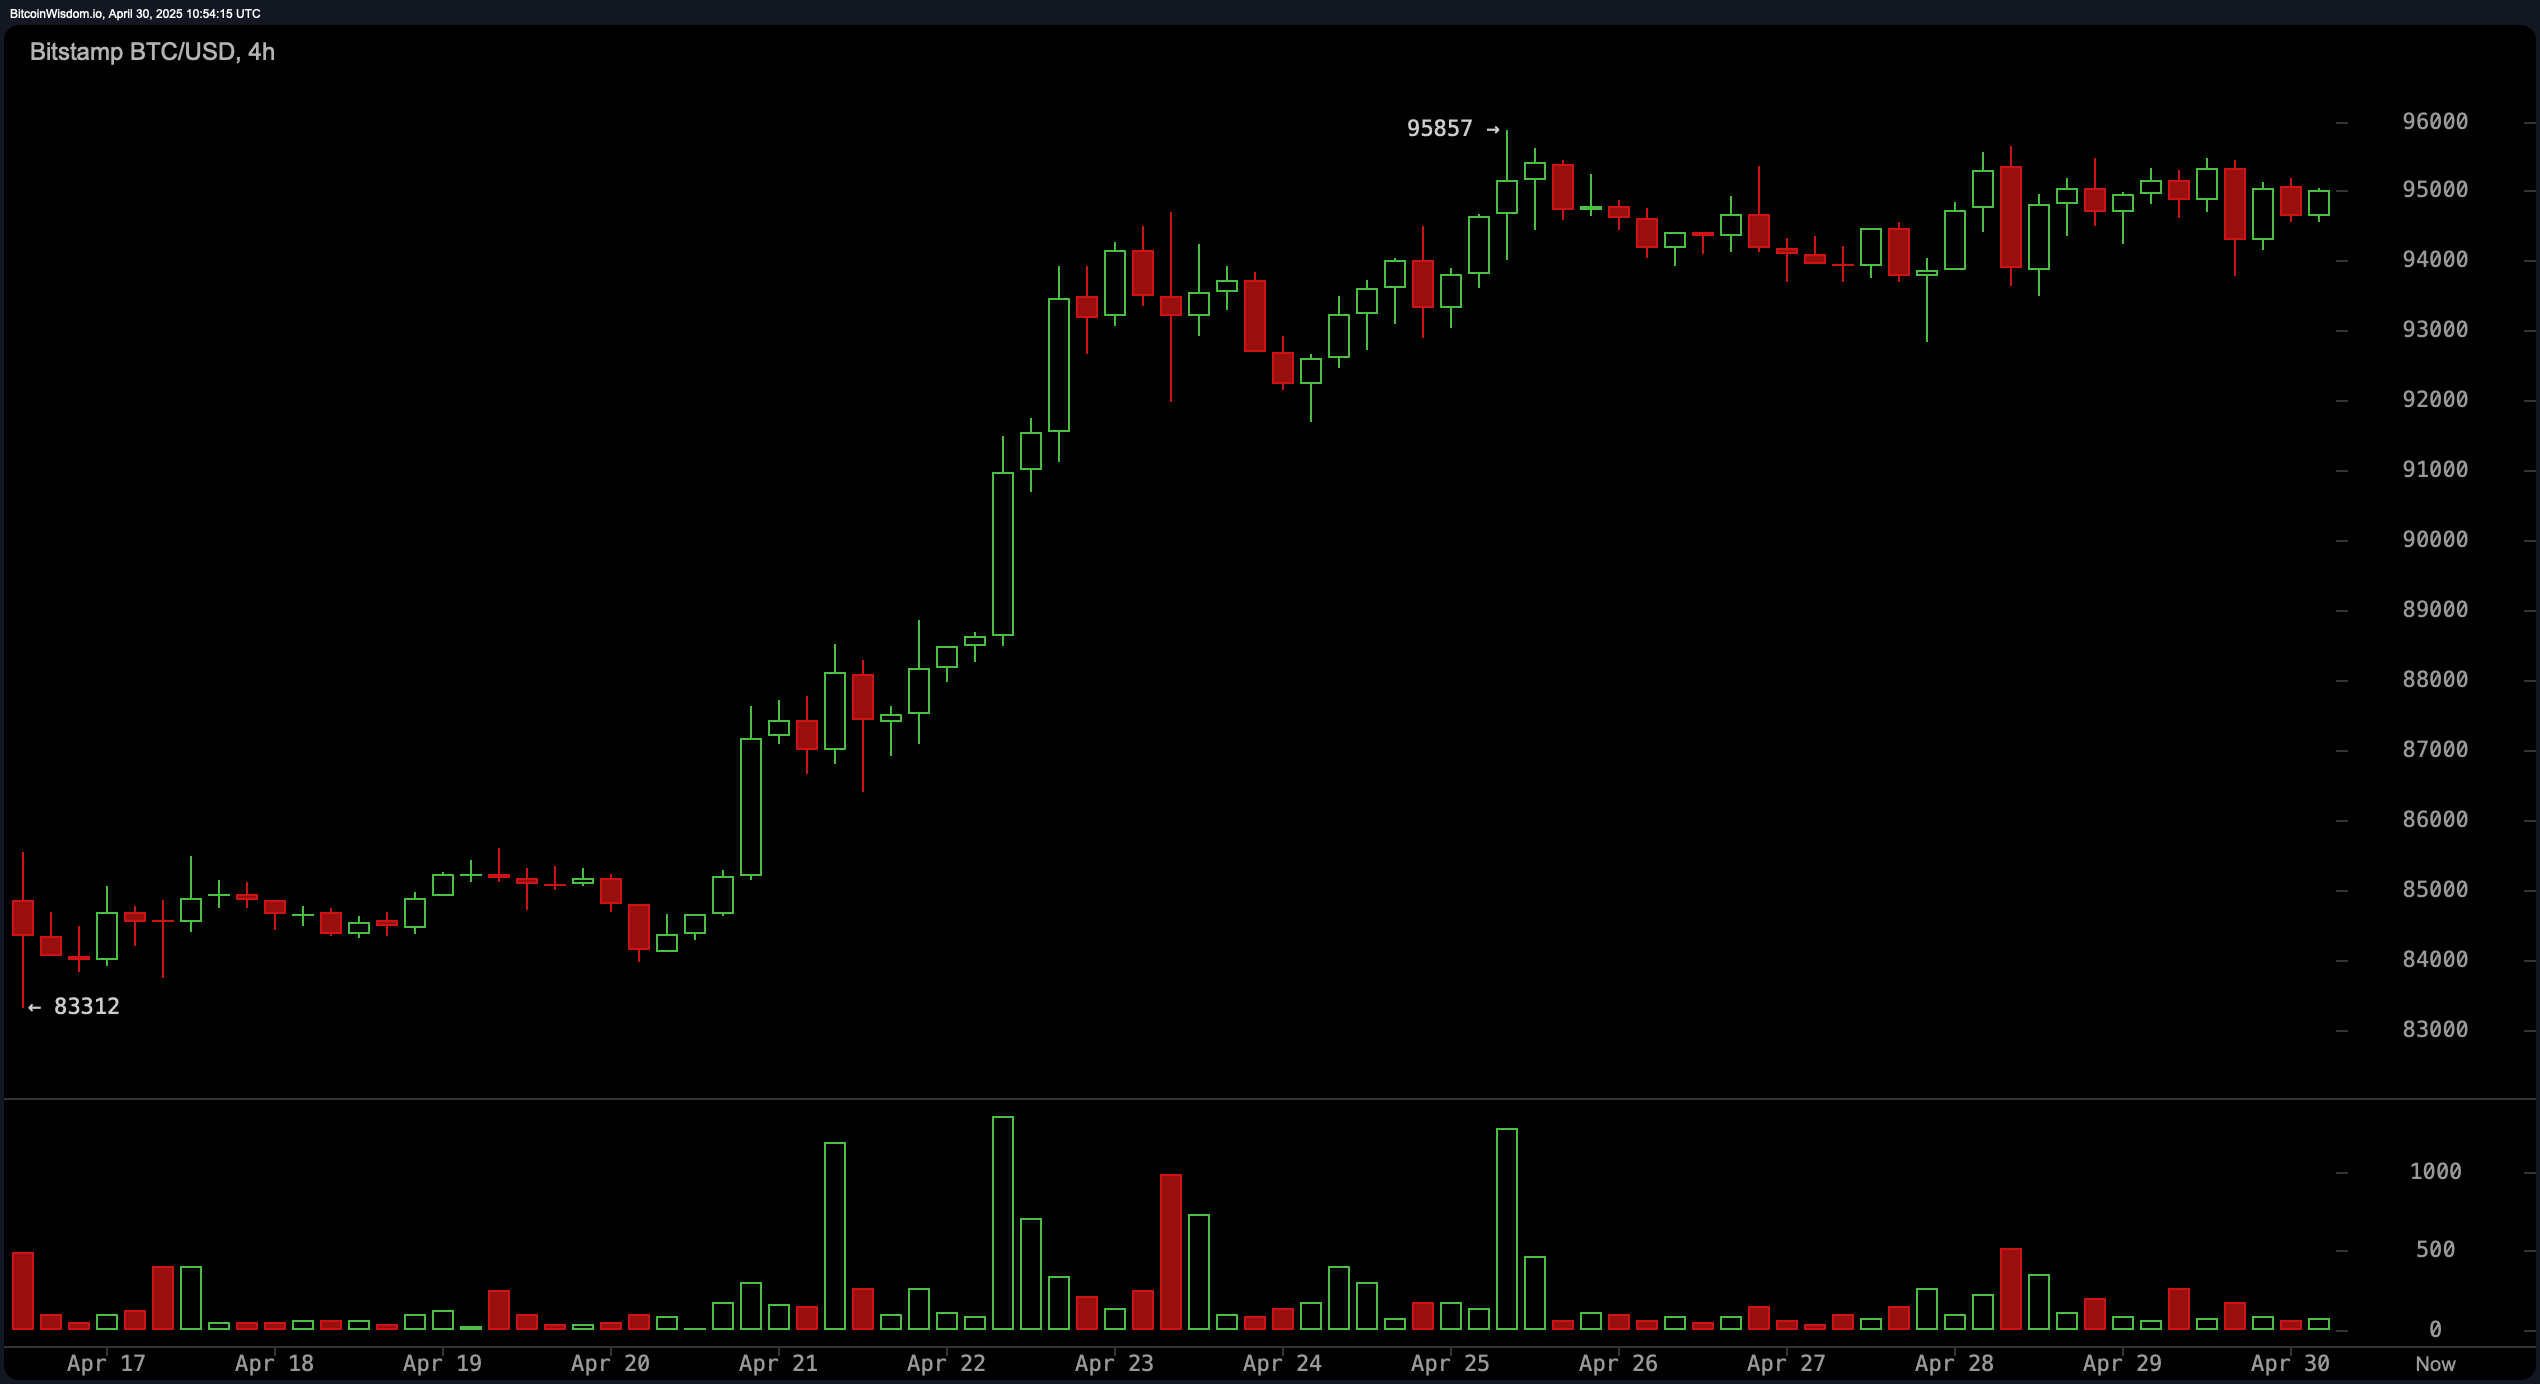
Meanwhile, the four-hour chart—a gritty reboot, basically—shows bitcoin marching from $83,300 to $95,800, with the price range squeezing tighter than my jeans after lockdown. This is a setup for a “big move”—the financial equivalent of dramatic music and a slow pan of my concerned face. Bulls are still in control (for now), but that breakout above $95,800? It needs volume. No volume, no party. Just sad snacks. A slip below the $93,000 higher low, and it’s time to check if those bearish pajamas still fit.
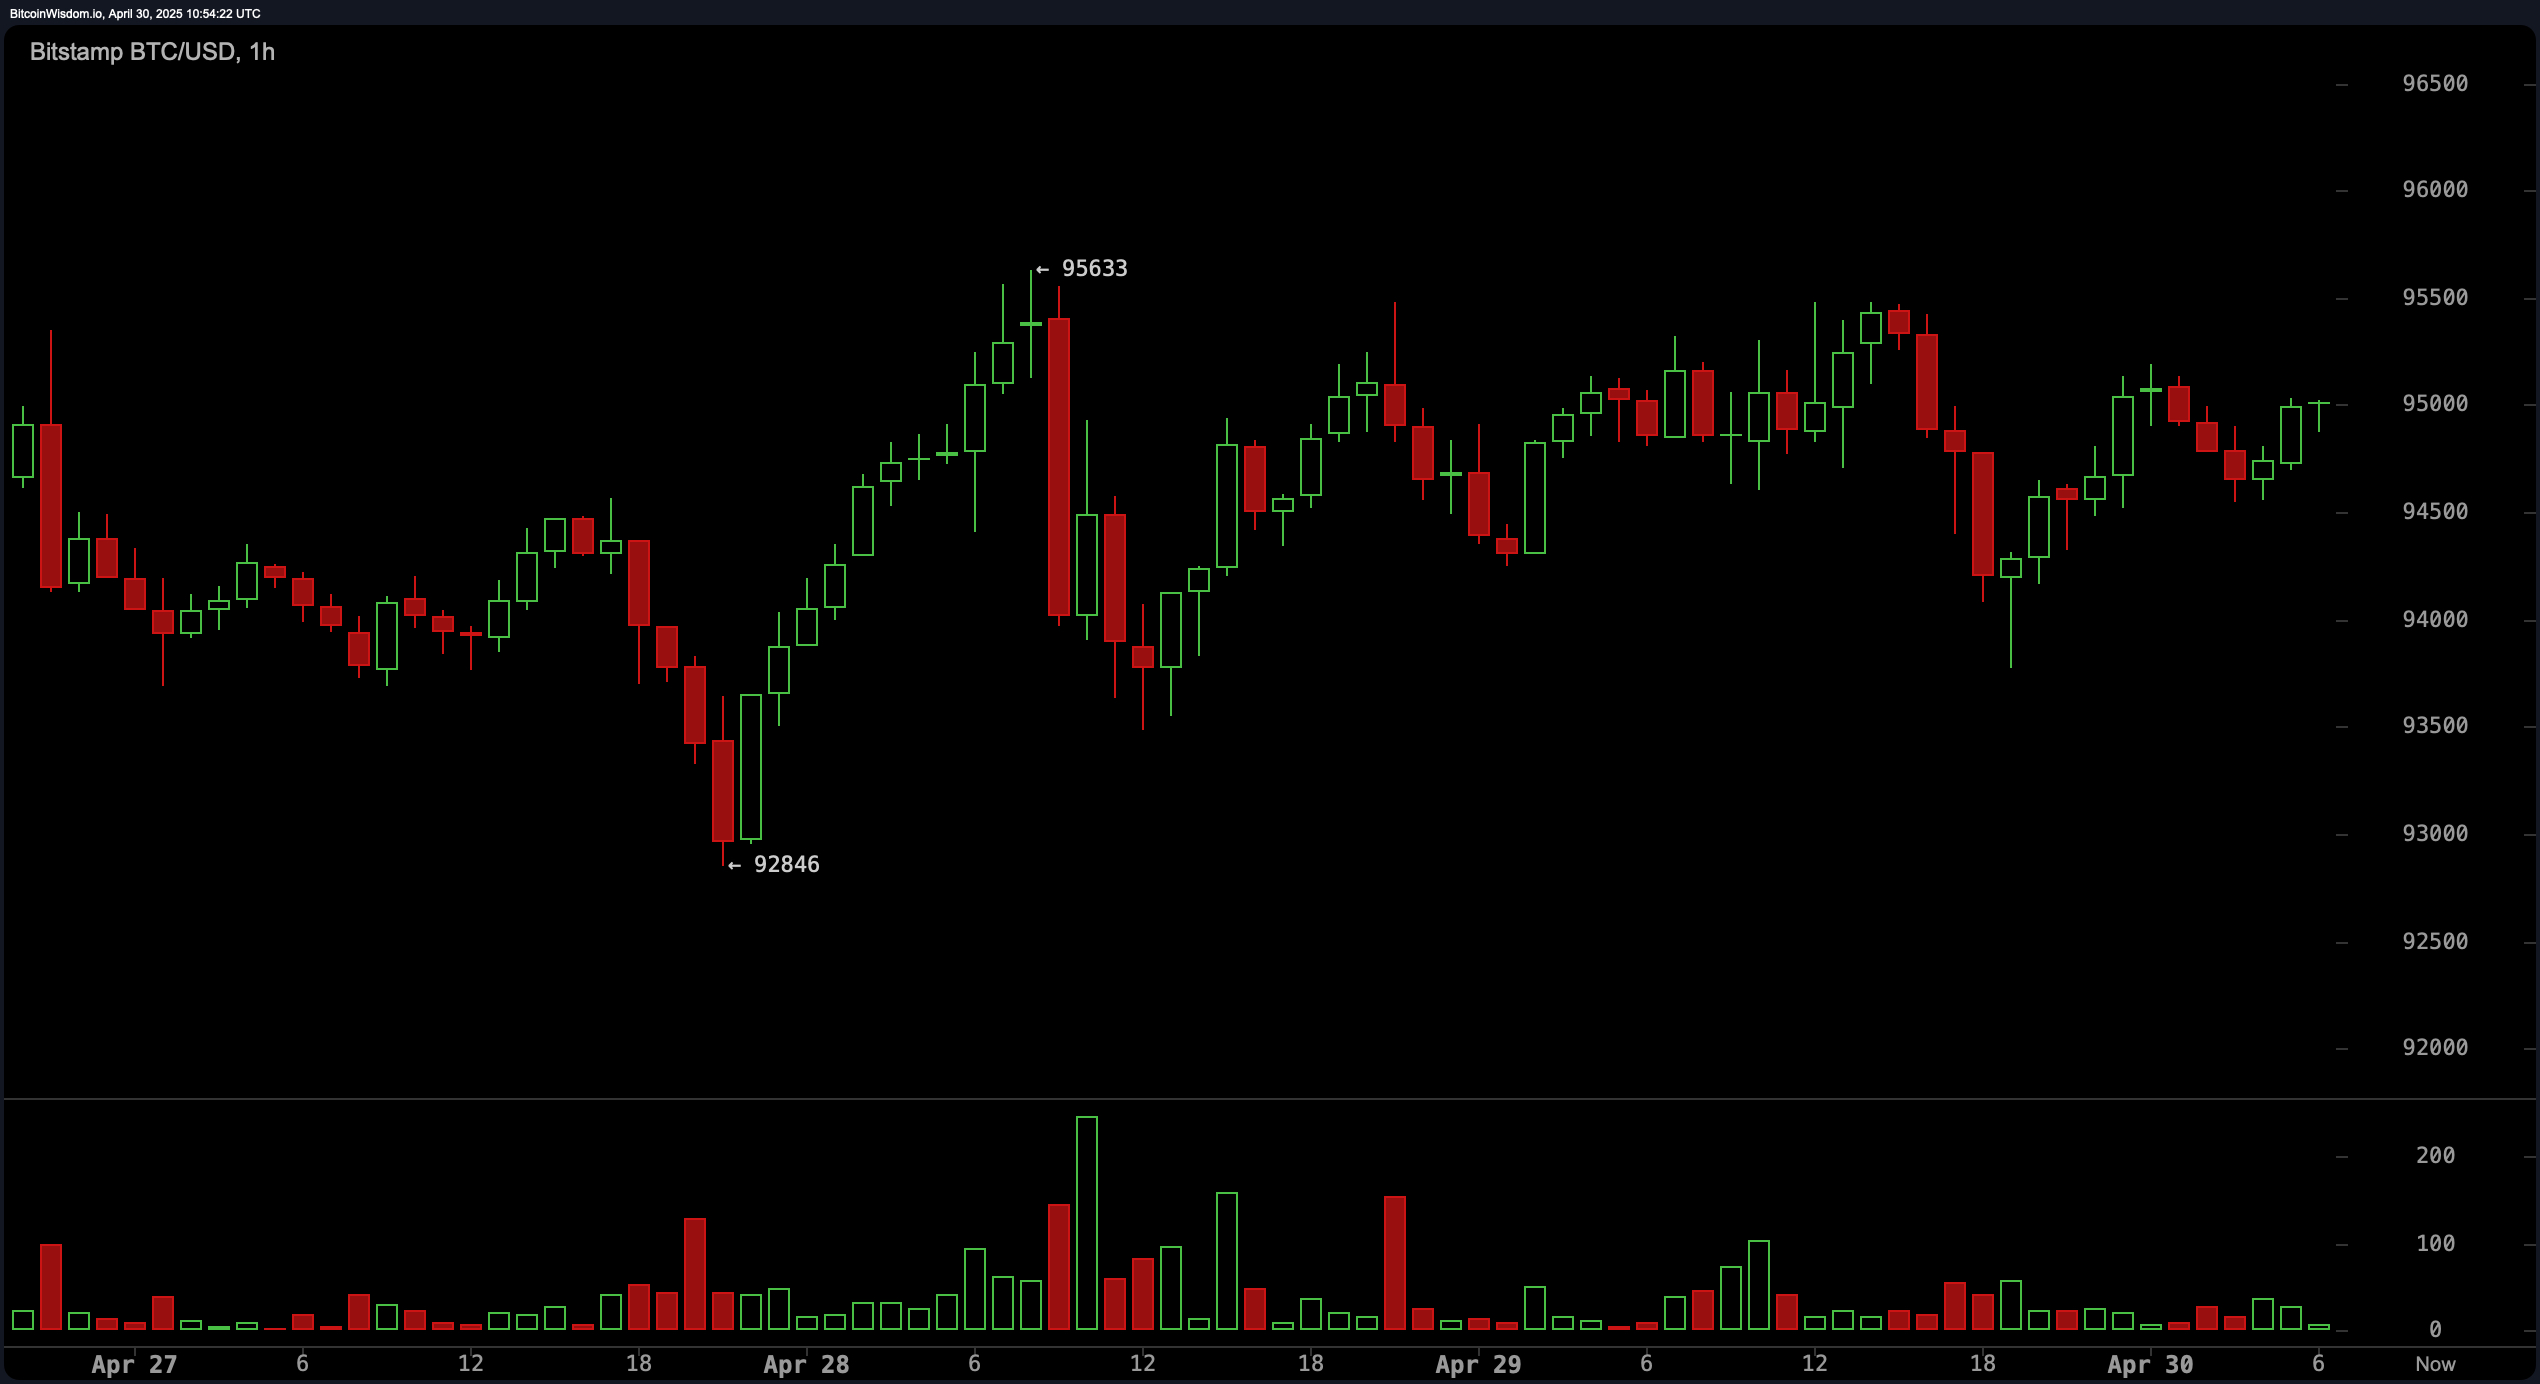
Hour by hour, bitcoin is dancing drunkenly at $93,000, hoping nobody notices the wobble. Movement has been as choppy as my last haircut, repeatedly failing to look pretty above $95,600—lots of rejection, a bit like my dating life. Volume has dipped, which in market-speak means traders are gossiping in the toilets, not making any moves. Scalpers: you could enter around $93,000–$93,500 with stops just below $92,800. Dream big, aim for $95K–$95.6K, and watch for bearish shenanigans or candlestick drama. 🍿
Indicators? You want indicators? Picture an entire jury of gossipy aunts—neutral to the point of passive aggression. The oscillators are mostly Switzerland: RSI’s at 67, Stochastic is 91 (calm down, keener), CCI at 86, ADX at 30—basically, everyone’s at the pub but nobody’s making a move. The momentum oscillator and MACD are finally loosening up, showing potential. The “awesome” oscillator is, in true British style, reserved. So—cautiously optimistic, or just “We’ll see what happens after another round.”
The moving averages are ALL bullish. Yes, everyone—EMAs, SMAs, from 10 all the way to 200-period—wave their bullish flags and probably post selfies with laser eyes. Exotic numbers: EMA (10) at $92,886, SMA (10) at $93,623, both batting below the current price, so short-term support is in the house. For the longer-term nostalgia, EMA (200) at $85,831 and SMA (200) at $89,681 serve as backup dancers. Frankly, it’s a bit of a bullish boy band reunion over here.
Bull Verdict:
If you’re singing “To the moon!” in the shower, you’re not alone. Strong support at every interval, momentum flirting with optimism, and volume waiting for a dramatic entrance. Flip $95,000 like it’s your neighbor’s pancake, and the market could swagger straight to $98,000…maybe even $100,000 if it’s feeling flirty. Risk management is a must, though, unless you like waking up in cold sweats. 🚀
Bear Verdict:
Look, just because the charts are bullish doesn’t mean the universe isn’t planning shenanigans. Failure to close above $95,000 and this could all unravel like my New Year’s resolutions. Fall below $93,000 (especially $92,800), and the bears get their turn at karaoke, heading for $90,000 and sobbing uncontrollably at $85,000. Don’t let a fake break fool you—sometimes resistance is just not that into you.
Read More
- Clash Royale Best Boss Bandit Champion decks
- Brawl Stars December 2025 Brawl Talk: Two New Brawlers, Buffie, Vault, New Skins, Game Modes, and more
- Best Hero Card Decks in Clash Royale
- Clash Royale December 2025: Events, Challenges, Tournaments, and Rewards
- Call of Duty Mobile: DMZ Recon Guide: Overview, How to Play, Progression, and more
- Best Arena 9 Decks in Clast Royale
- Clash Royale Witch Evolution best decks guide
- Clash Royale Best Arena 14 Decks
- Brawl Stars December 2025 Brawl Talk: Two New Brawlers, Buffie, Vault, New Skins, Game Modes, and more
- Deneme Bonusu Veren Siteler – En Gvenilir Bahis Siteleri 2025.4338
2025-04-30 14:59