So here we are, folks, with Brent crude futures hovering around $103, having climbed more than 40% in the last month. Why, you ask? Well, it’s all thanks to that delightful cocktail of the Iran-US conflict, some choppy waters in the Strait of Hormuz, and Iraq declaring “force majeure” like it’s a new dance move at a wedding-removing millions of barrels from global supply.
But just as we were getting comfortable with our overpriced gas station lattes, the rally started to lose steam faster than my enthusiasm for yet another Zoom meeting. Brent has slipped about 2.84% recently, and if you squint at the 4-hour chart, there’s a pattern emerging that suggests the market might be hoping for a peaceful resolution. But let’s be real; one headline-and boom!-everything can flip upside down faster than a pancake on a Sunday morning.
Head and Shoulders: The New Fashion Statement
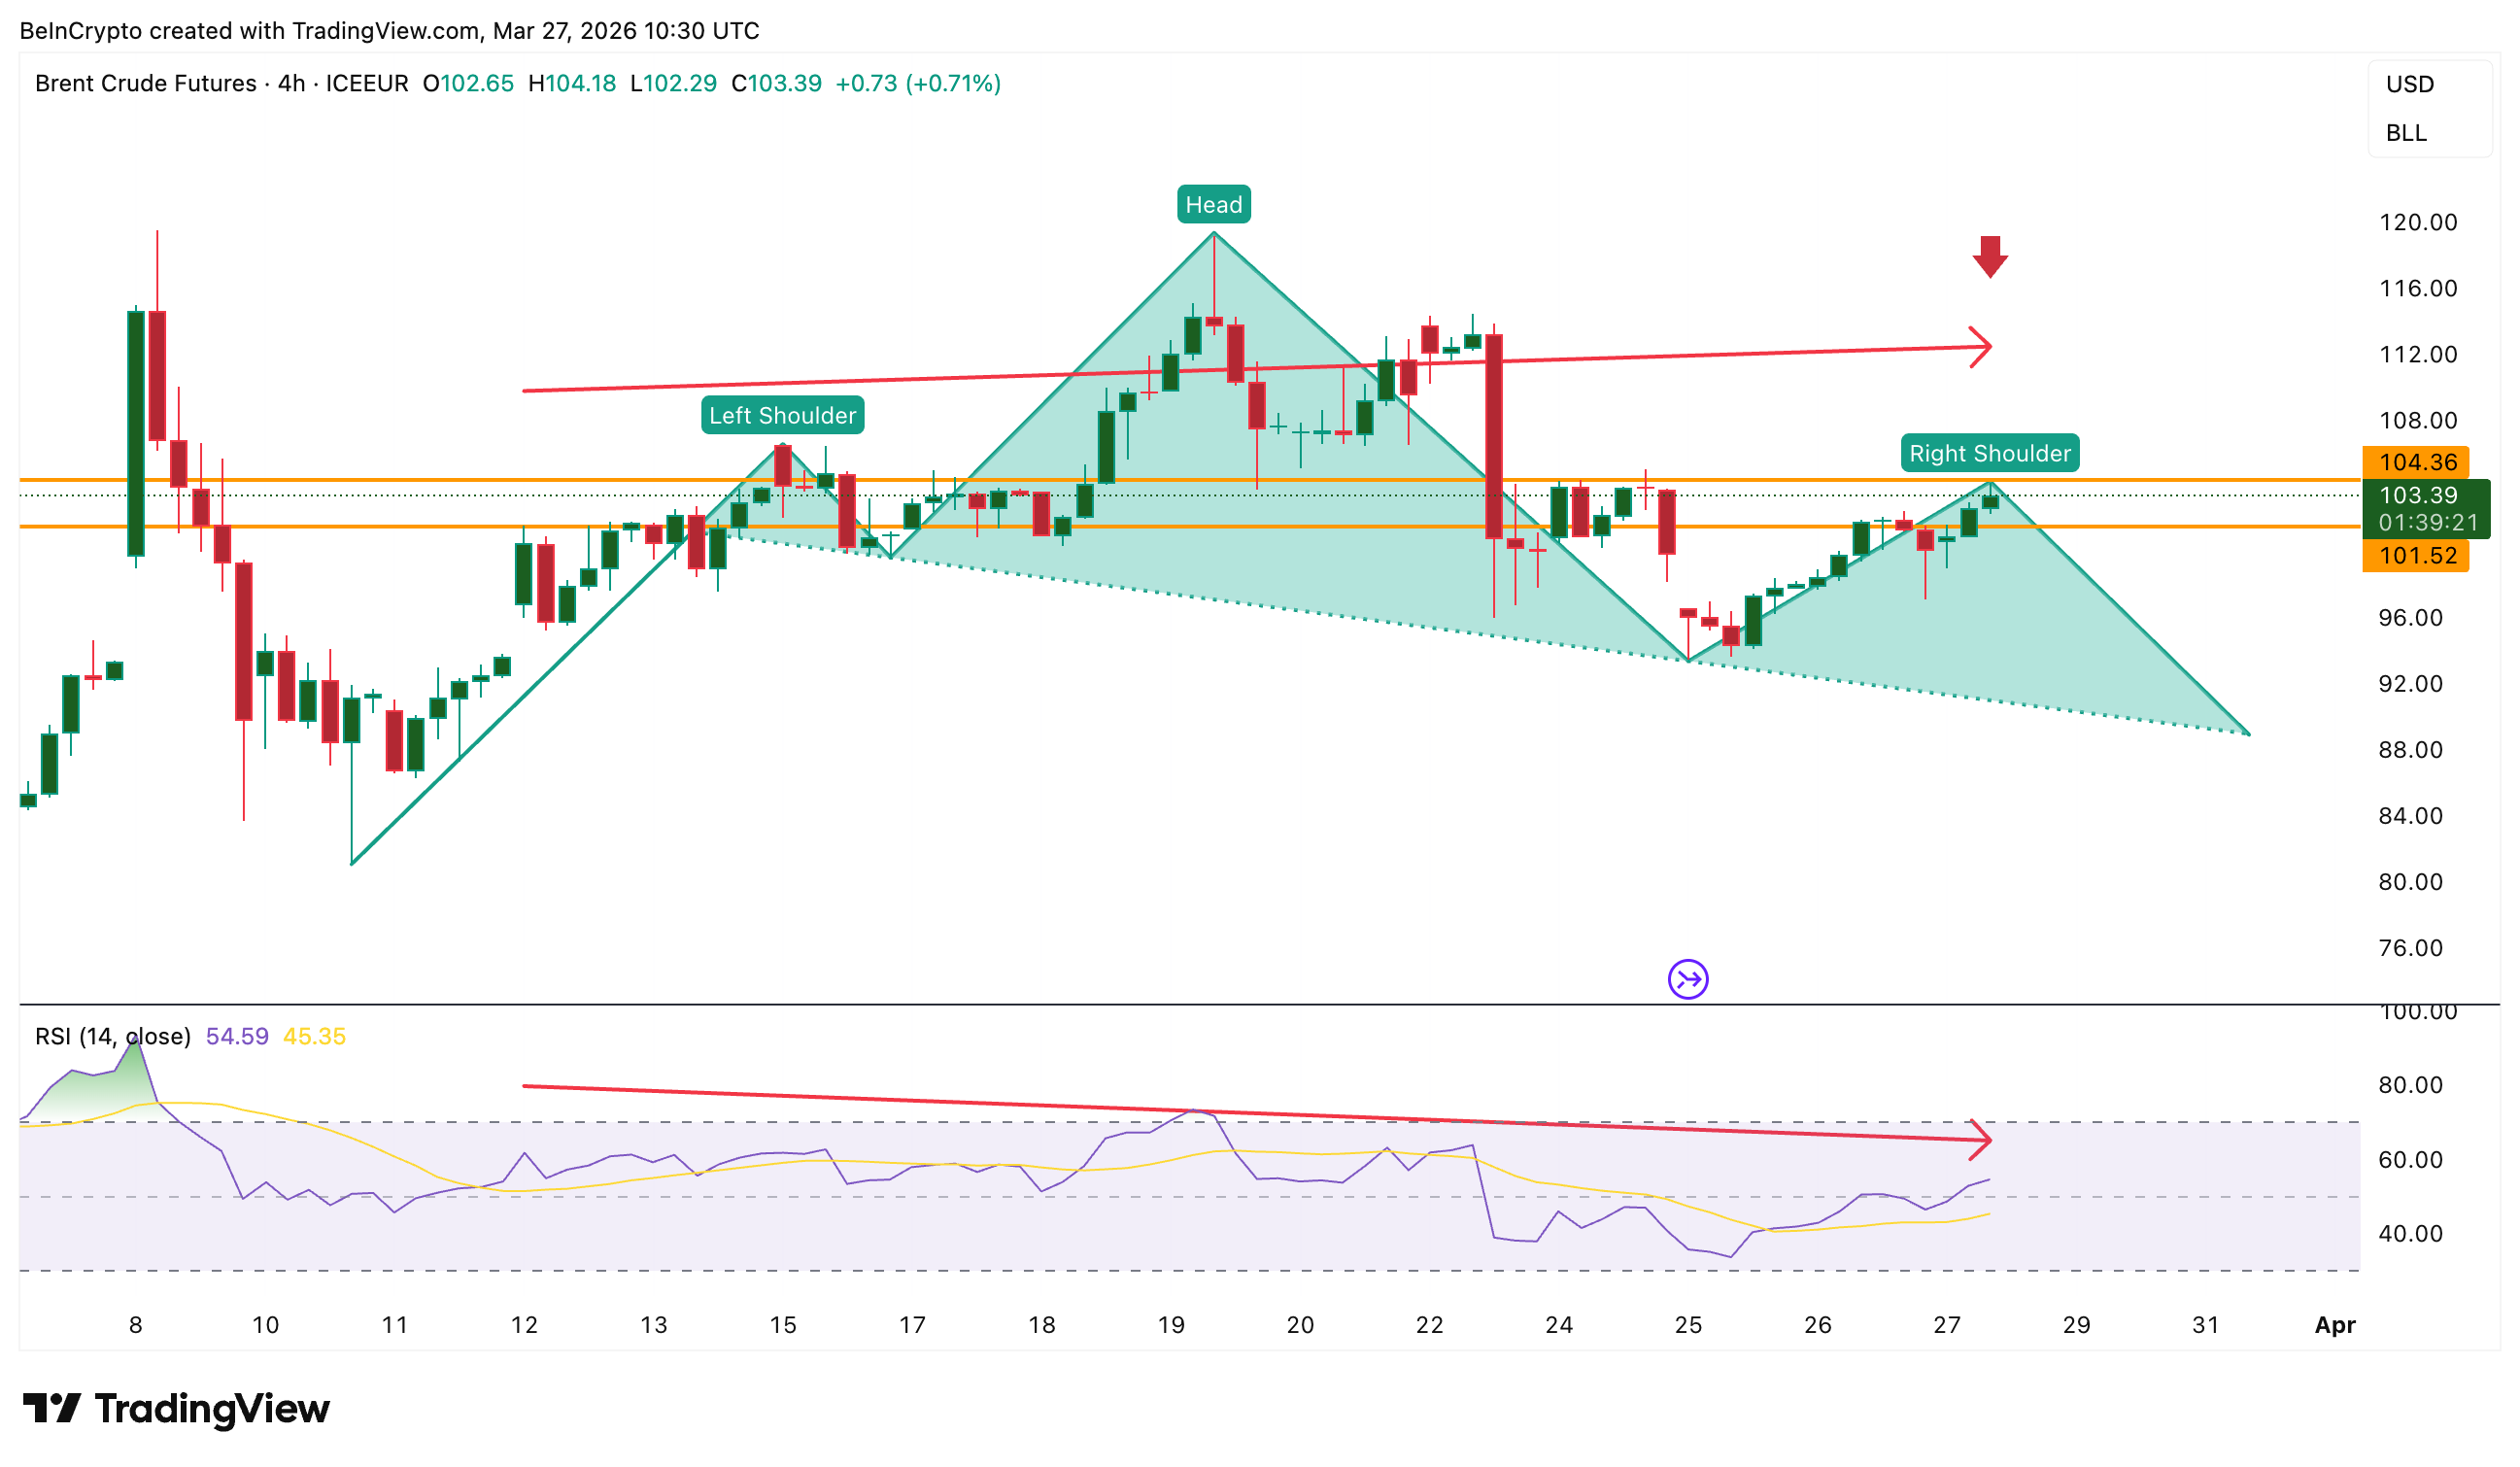
Looking at the 4-hour chart on ICE Europe, we see a head and shoulders pattern developing. No, it’s not the latest style trend, but rather a bearish indicator on a shorter time frame. Between March 12 and March 27, oil prices are pulling off a higher high while the Relative Strength Index (RSI)-you know, that momentum tracker-is forming a lower high. Classic case of “I’m fine” when clearly, things are not fine. This bearish divergence is like that friend who insists they’re totally okay when you can see they haven’t showered in days.
Now, confirmation of this divergence is still pending. If the next 4-hour candle closes below the current one’s high, we’d have ourselves a swing high, validating the RSI structure. But if we break above $104.37? Well, then we’ll have to toss this whole theory out the window.
In this geopolitical drama, the weakening momentum on our beloved chart could indicate traders are starting to hedge against a de-escalation scenario-because who doesn’t love playing both sides?
BREAKING: Iran has officially rejected the US’ peace proposal and sets five conditions for an end to the war.
Iran’s conditions include:
1. Immediate end to attacks and assassinations on Iran
2. Establishment of “concrete guarantees” against future US attacks
3. “Clear…
– The Kobeissi Letter (@KobeissiLetter) March 25, 2026
Ah, the sweet sound of diplomatic rejection. Iran may have turned down direct talks with the US, but the futures markets tend to act like your overly eager friend who jumps to conclusions before getting the full story.
Backwardation: The Trend That Just Won’t Quit
The spread between front-month and second-month Brent contracts (BRN1! minus BRN2!) has steadily climbed to $5.73. When front-month contracts trade at a premium over later deliveries, it’s called backwardation-a fancy way to say everyone wants their oil now and not later, like kids on Christmas morning.
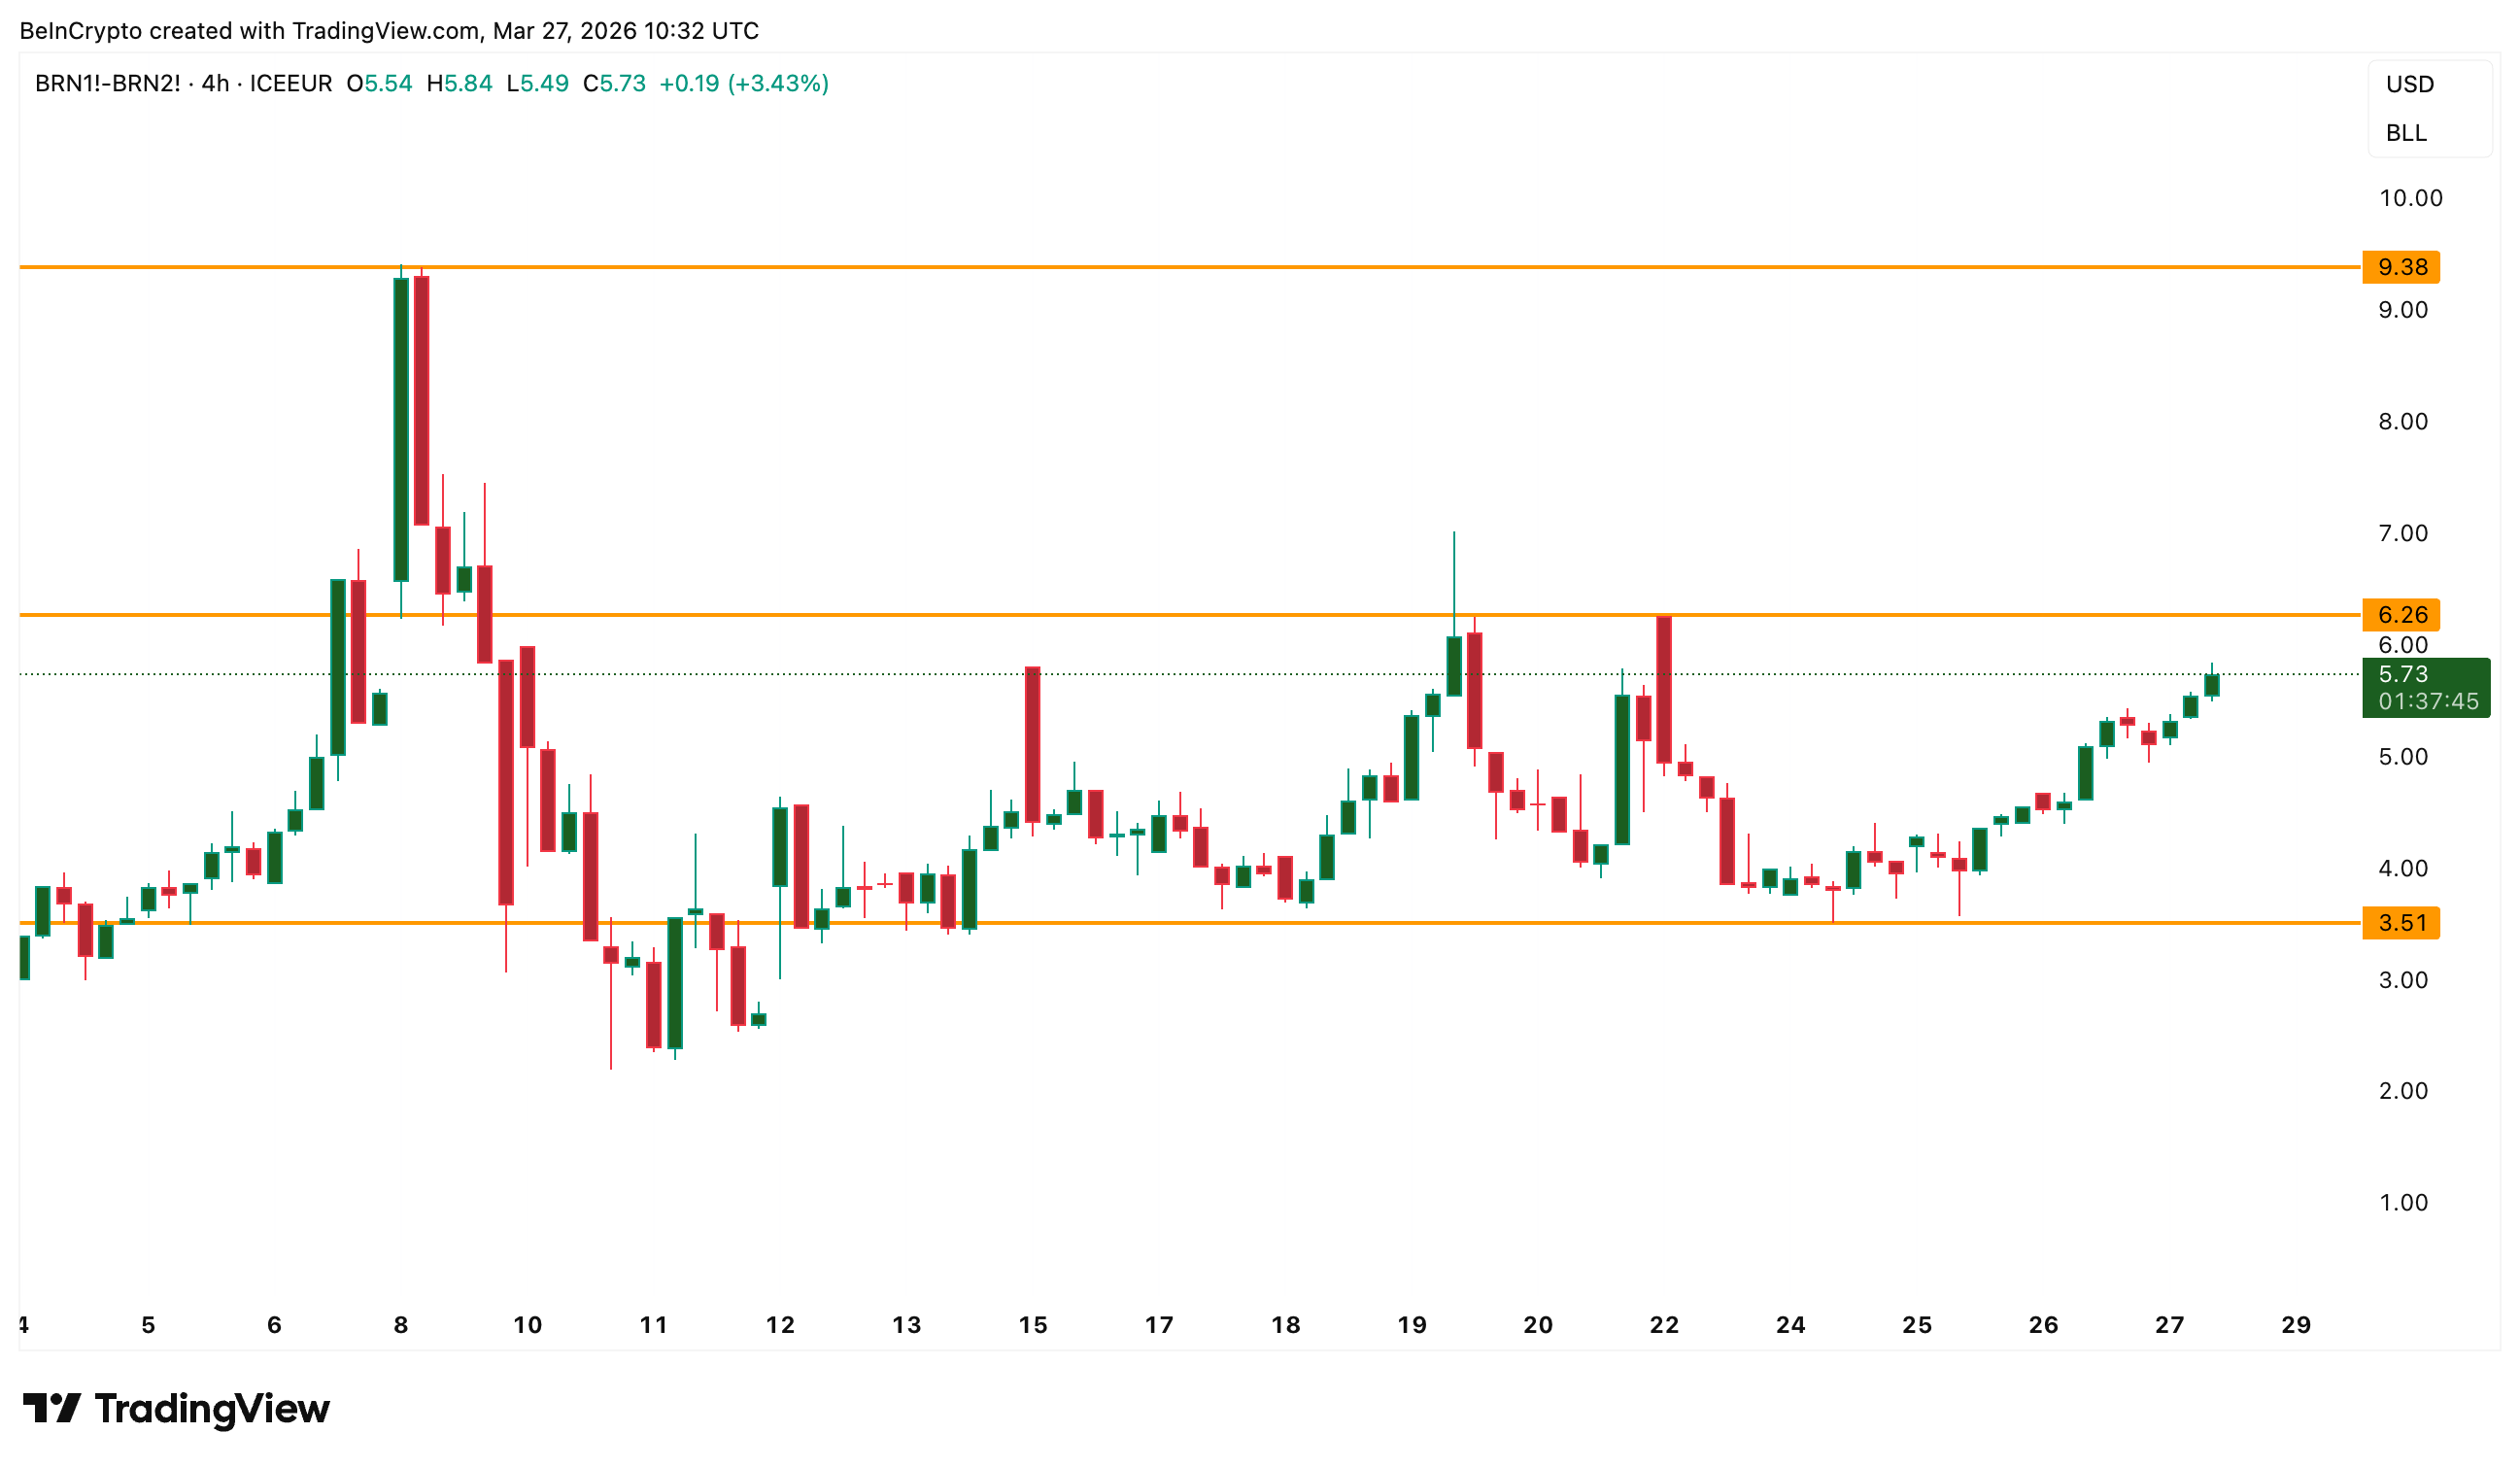
But wait! There’s a twist! When later-month contracts trade at a discount, it means the market expects lower prices ahead-like that moment when you realize your favorite restaurant has raised its prices. Could this be a hint at a ceasefire? We can only hope.
Meanwhile, the US Dollar Index (DXY) has broken out of a bull flag on the daily chart and is now lounging near 100.16.
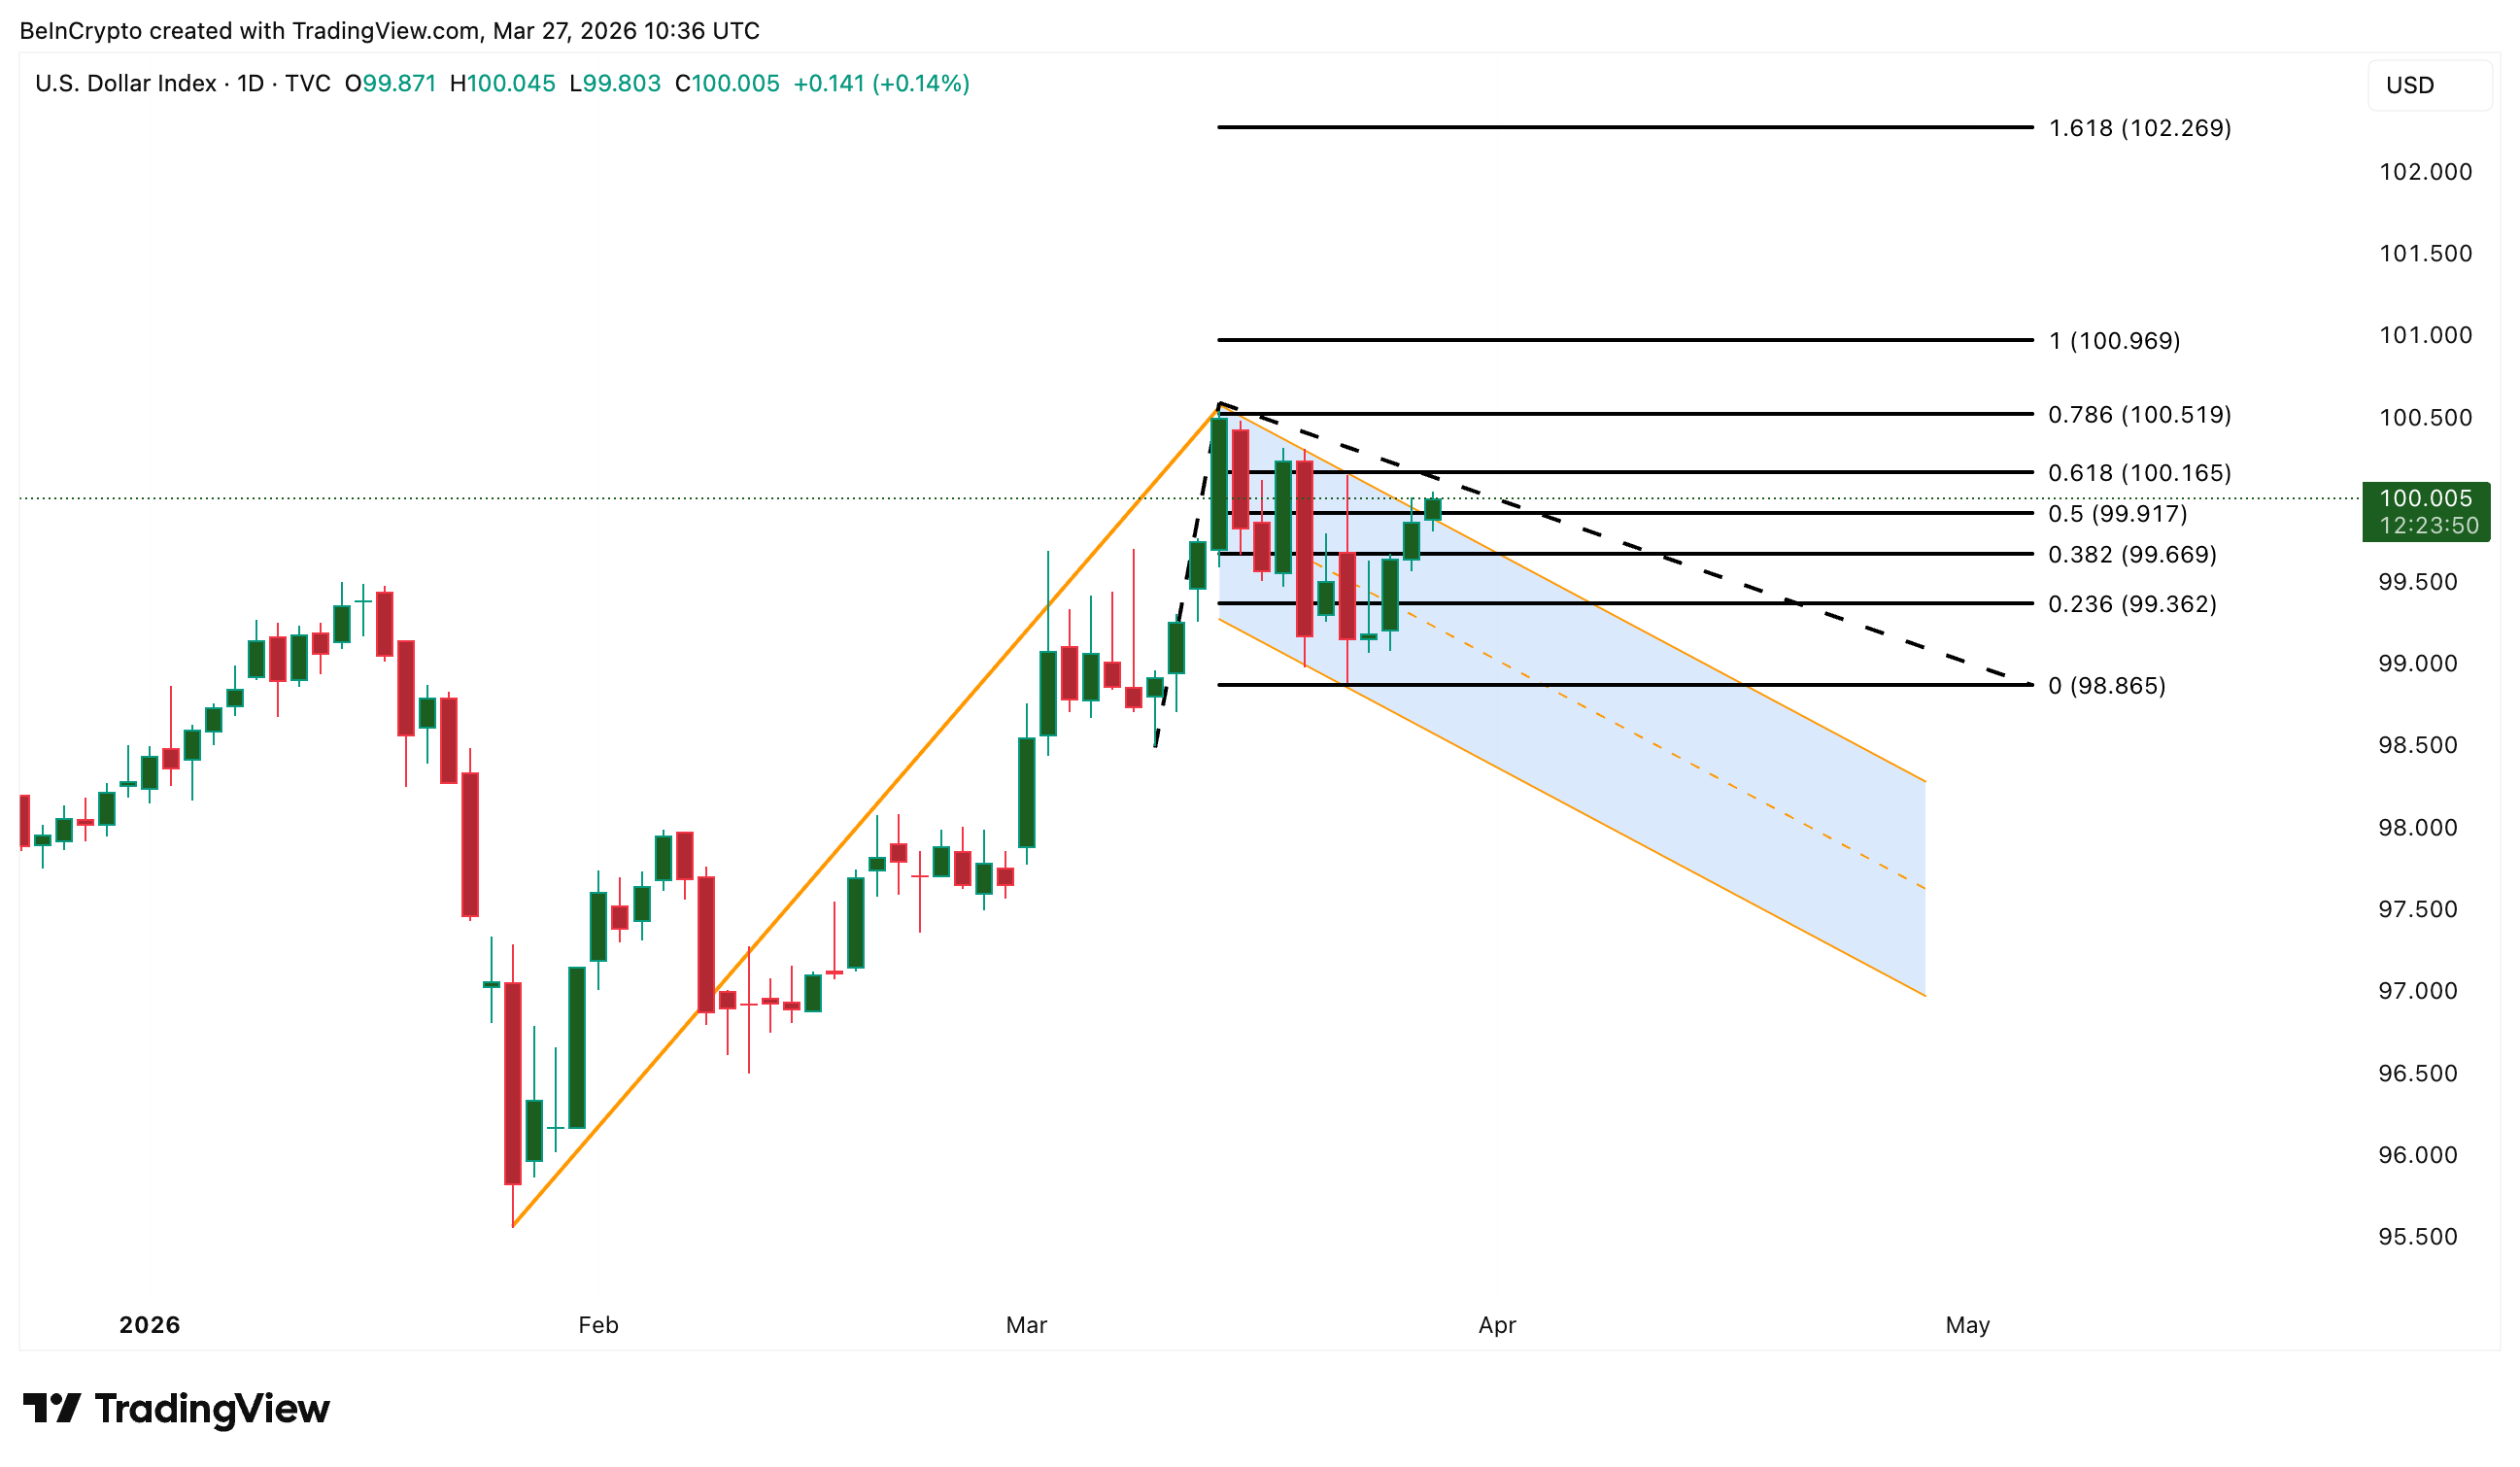
Traditionally, a rising dollar puts pressure on oil prices because crude is priced in dollars. However, this relationship seems to be playing hard to get lately. Over the past week, Brent slipped 2.84% even as DXY gained 0.34%. If we revert to our usual playbook, dollar strength might just become a headwind for good ol’ Brent.
BNO Positioning: Bullish or Just Bull?
The BNO United States Brent Oil Fund, which follows Brent crude futures, shows how options sentiment has shifted. A month ago, when BNO was at $34.81, traders were optimistically positioned for a price surge. Now, with BNO sitting at $50.55, the volume ratio has climbed to 0.29, signaling that traders are preparing for a rainy day, just in case the weather turns sour.
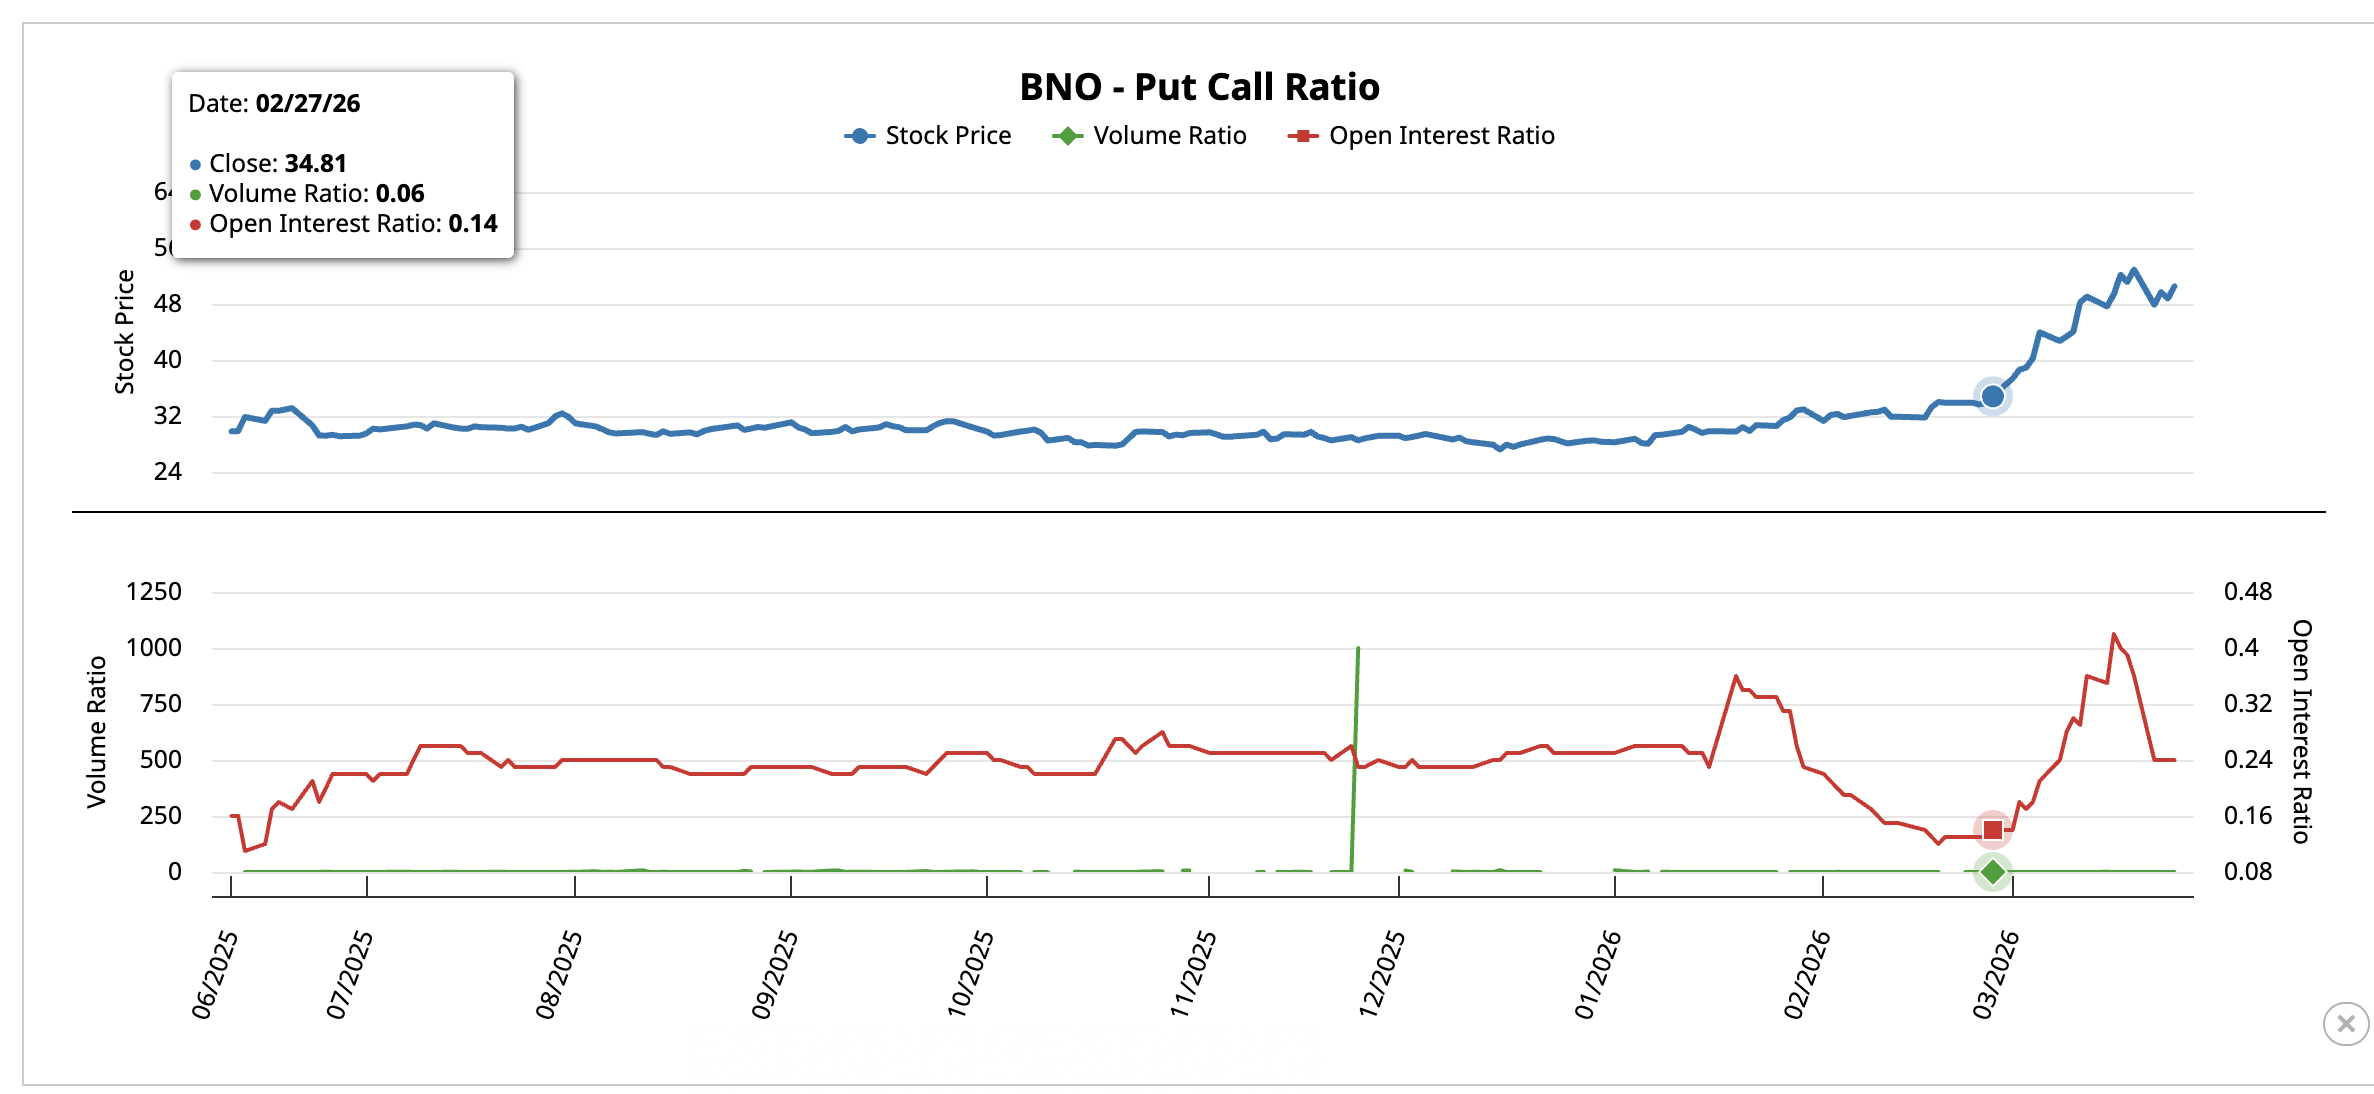
This shift means a breakdown could be on the horizon, but don’t hold your breath. The 4-hour pattern may lean bearish, the dollar might be a downer, and the put-call ratio shows that traders are cooling off. Yet, positioning hasn’t flipped entirely, and backwardation still indicates a real urgency for supply.
Oil Price Levels and the Ever-Persistent Ceasefire Question
Despite the bearish leanings of the 4-hour pattern, the market remains as unpredictable as a cat on a hot tin roof. Shorter-timeframe patterns in this geopolitical circus should be approached with caution-think of it as tiptoeing through a minefield while juggling flaming swords.
If that head and shoulders pattern confirms, we could see an 18% correction. Key downside levels include $98.27, followed by $88.39, the 0.618 Fibonacci level. If we drop below $88.39, we might find ourselves staring at the neckline, with the full measured move pointing toward $72.62-perfect for a good cry.
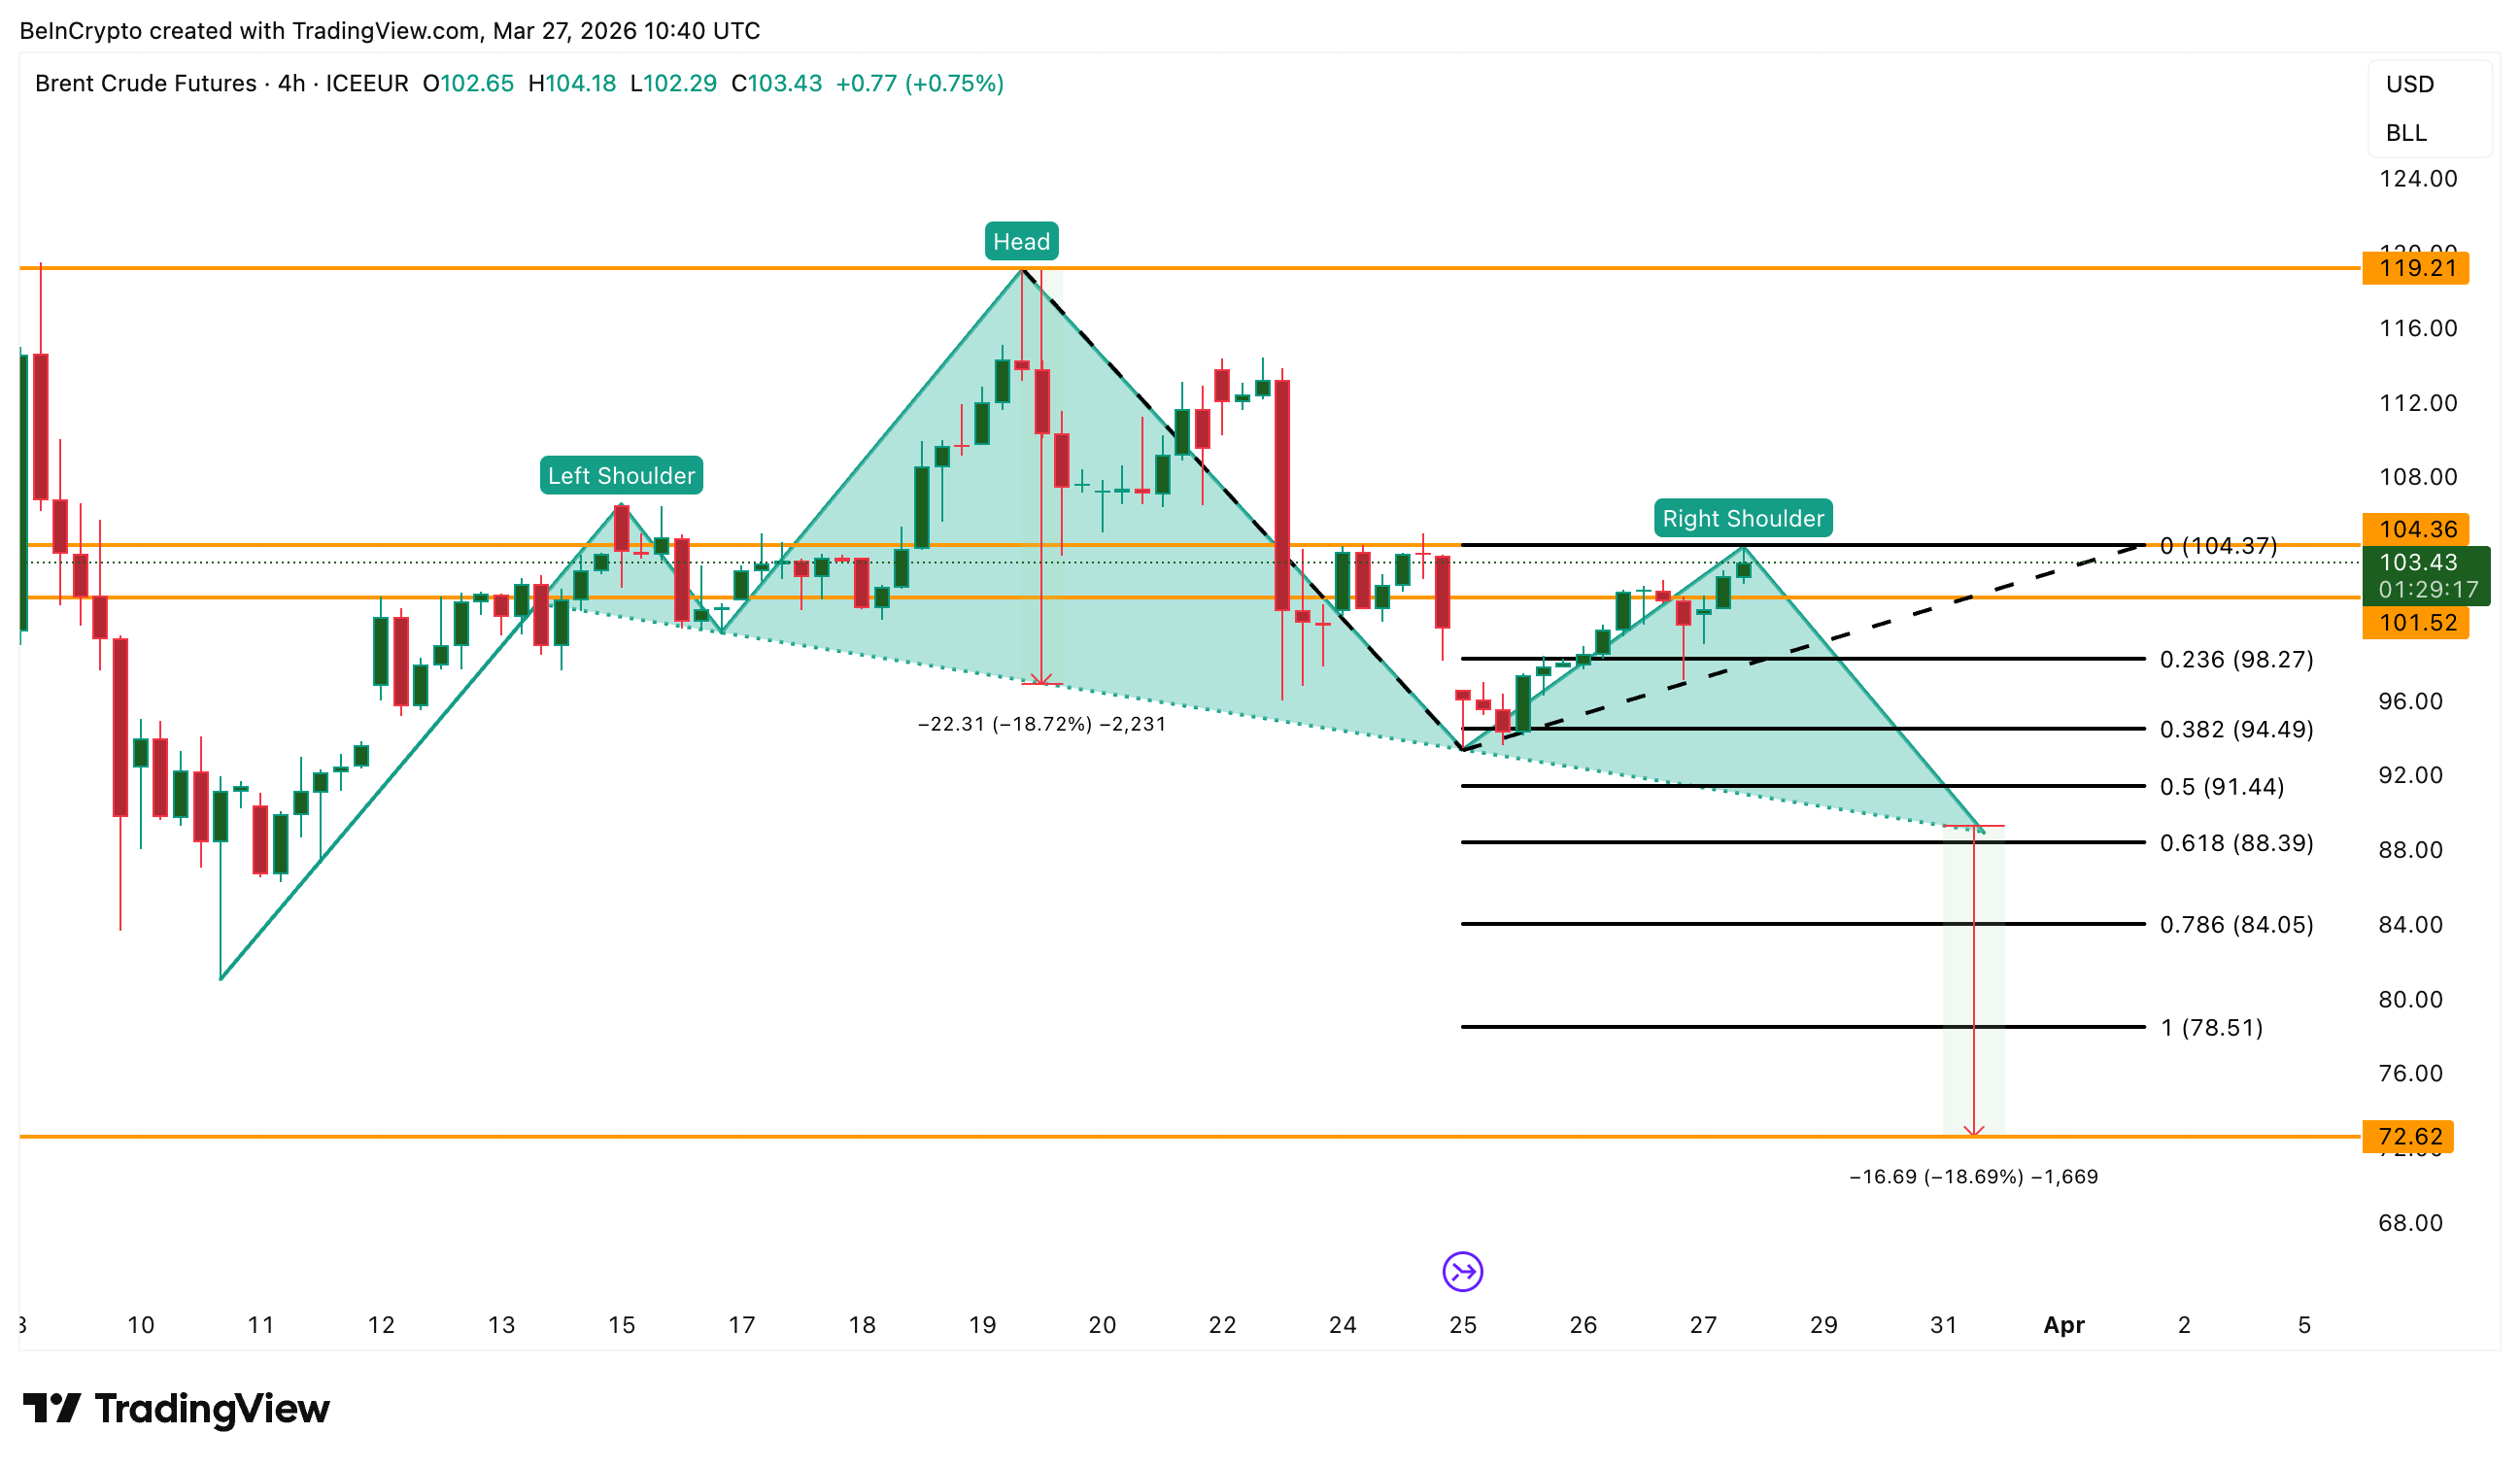
On the flip side, if we manage a 4-hour close above $104.37, we’ll weaken the bearish case for Brent Crude. The ultimate invalidation lies at $119-a number that feels as distant as my dreams of a quiet evening at home.
For now, the chart, the dollar, and the RSI are all asking the same question: Is the oil price already pricing in a resolution that the headlines have yet to confirm? Spoiler alert: Probably.
2026-03-27 16:21